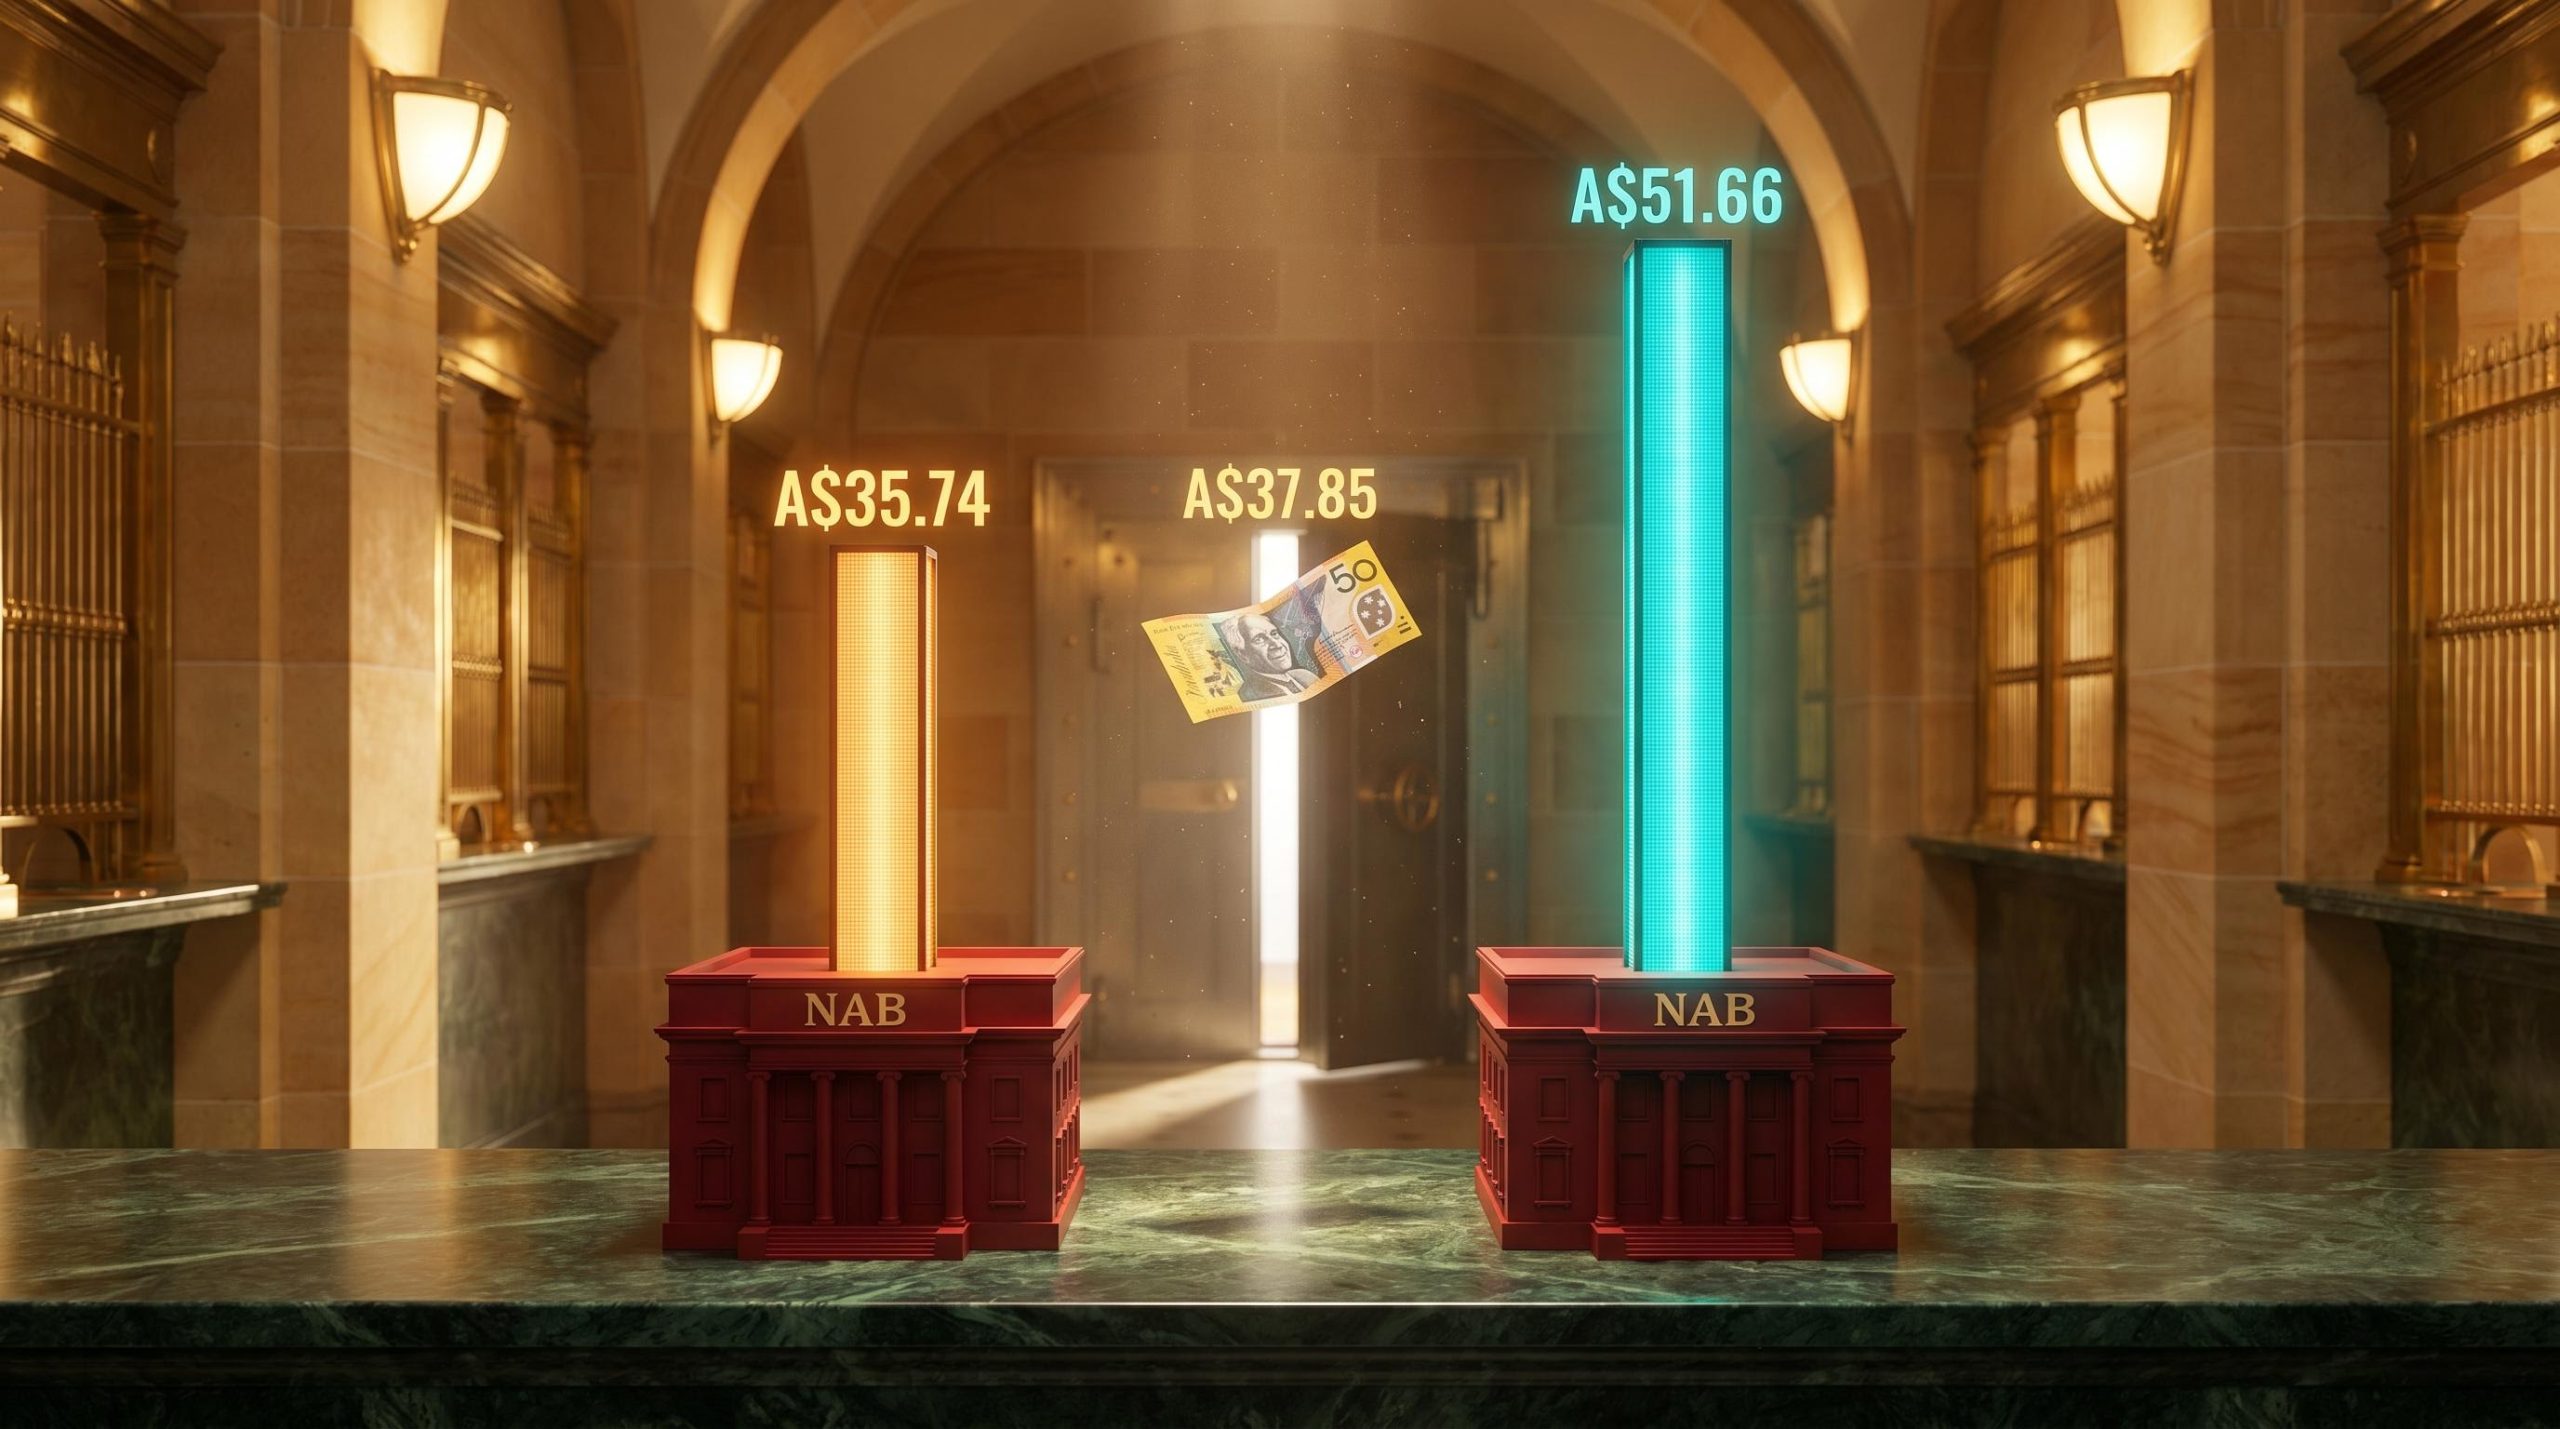
National Australia Bank shares have slipped from near A$50 in early 2026 to around A$37.85 as of 22 May 2026. That decline raises the question every bank shareholder eventually faces: is the stock undervalued, or has the market simply repriced it to where it belongs? Answering that question requires a valuation framework, and the two most commonly applied methods produce strikingly different results. A Price-Earnings ratio approach, using the banking sector average multiple, points to a fair value of roughly A$40.72. A Dividend Discount Model, applied to the same stock with the same publicly available data, generates estimates ranging from A$35.74 to A$51.66 depending on the assumptions plugged in. The gap between those outputs is not a flaw in the methods; it is the methods working as designed, each one sensitive to different inputs. What follows walks through both approaches as applied to NAB in May 2026, explains what each output actually captures, and shows why the discipline of stress-testing assumptions matters more than any single fair-value number.
Why NAB is a useful valuation case study right now
NAB is one of Australia’s four major banks, a group that collectively represents roughly 30% of the ASX by market capitalisation. When one of the big four re-rates sharply, the implications extend well beyond its own share register. Investors holding broad index exposure through vehicles like the Vanguard Australian Shares Index ETF (ASX: VAS) carry meaningful NAB weighting whether they chose it deliberately or not.
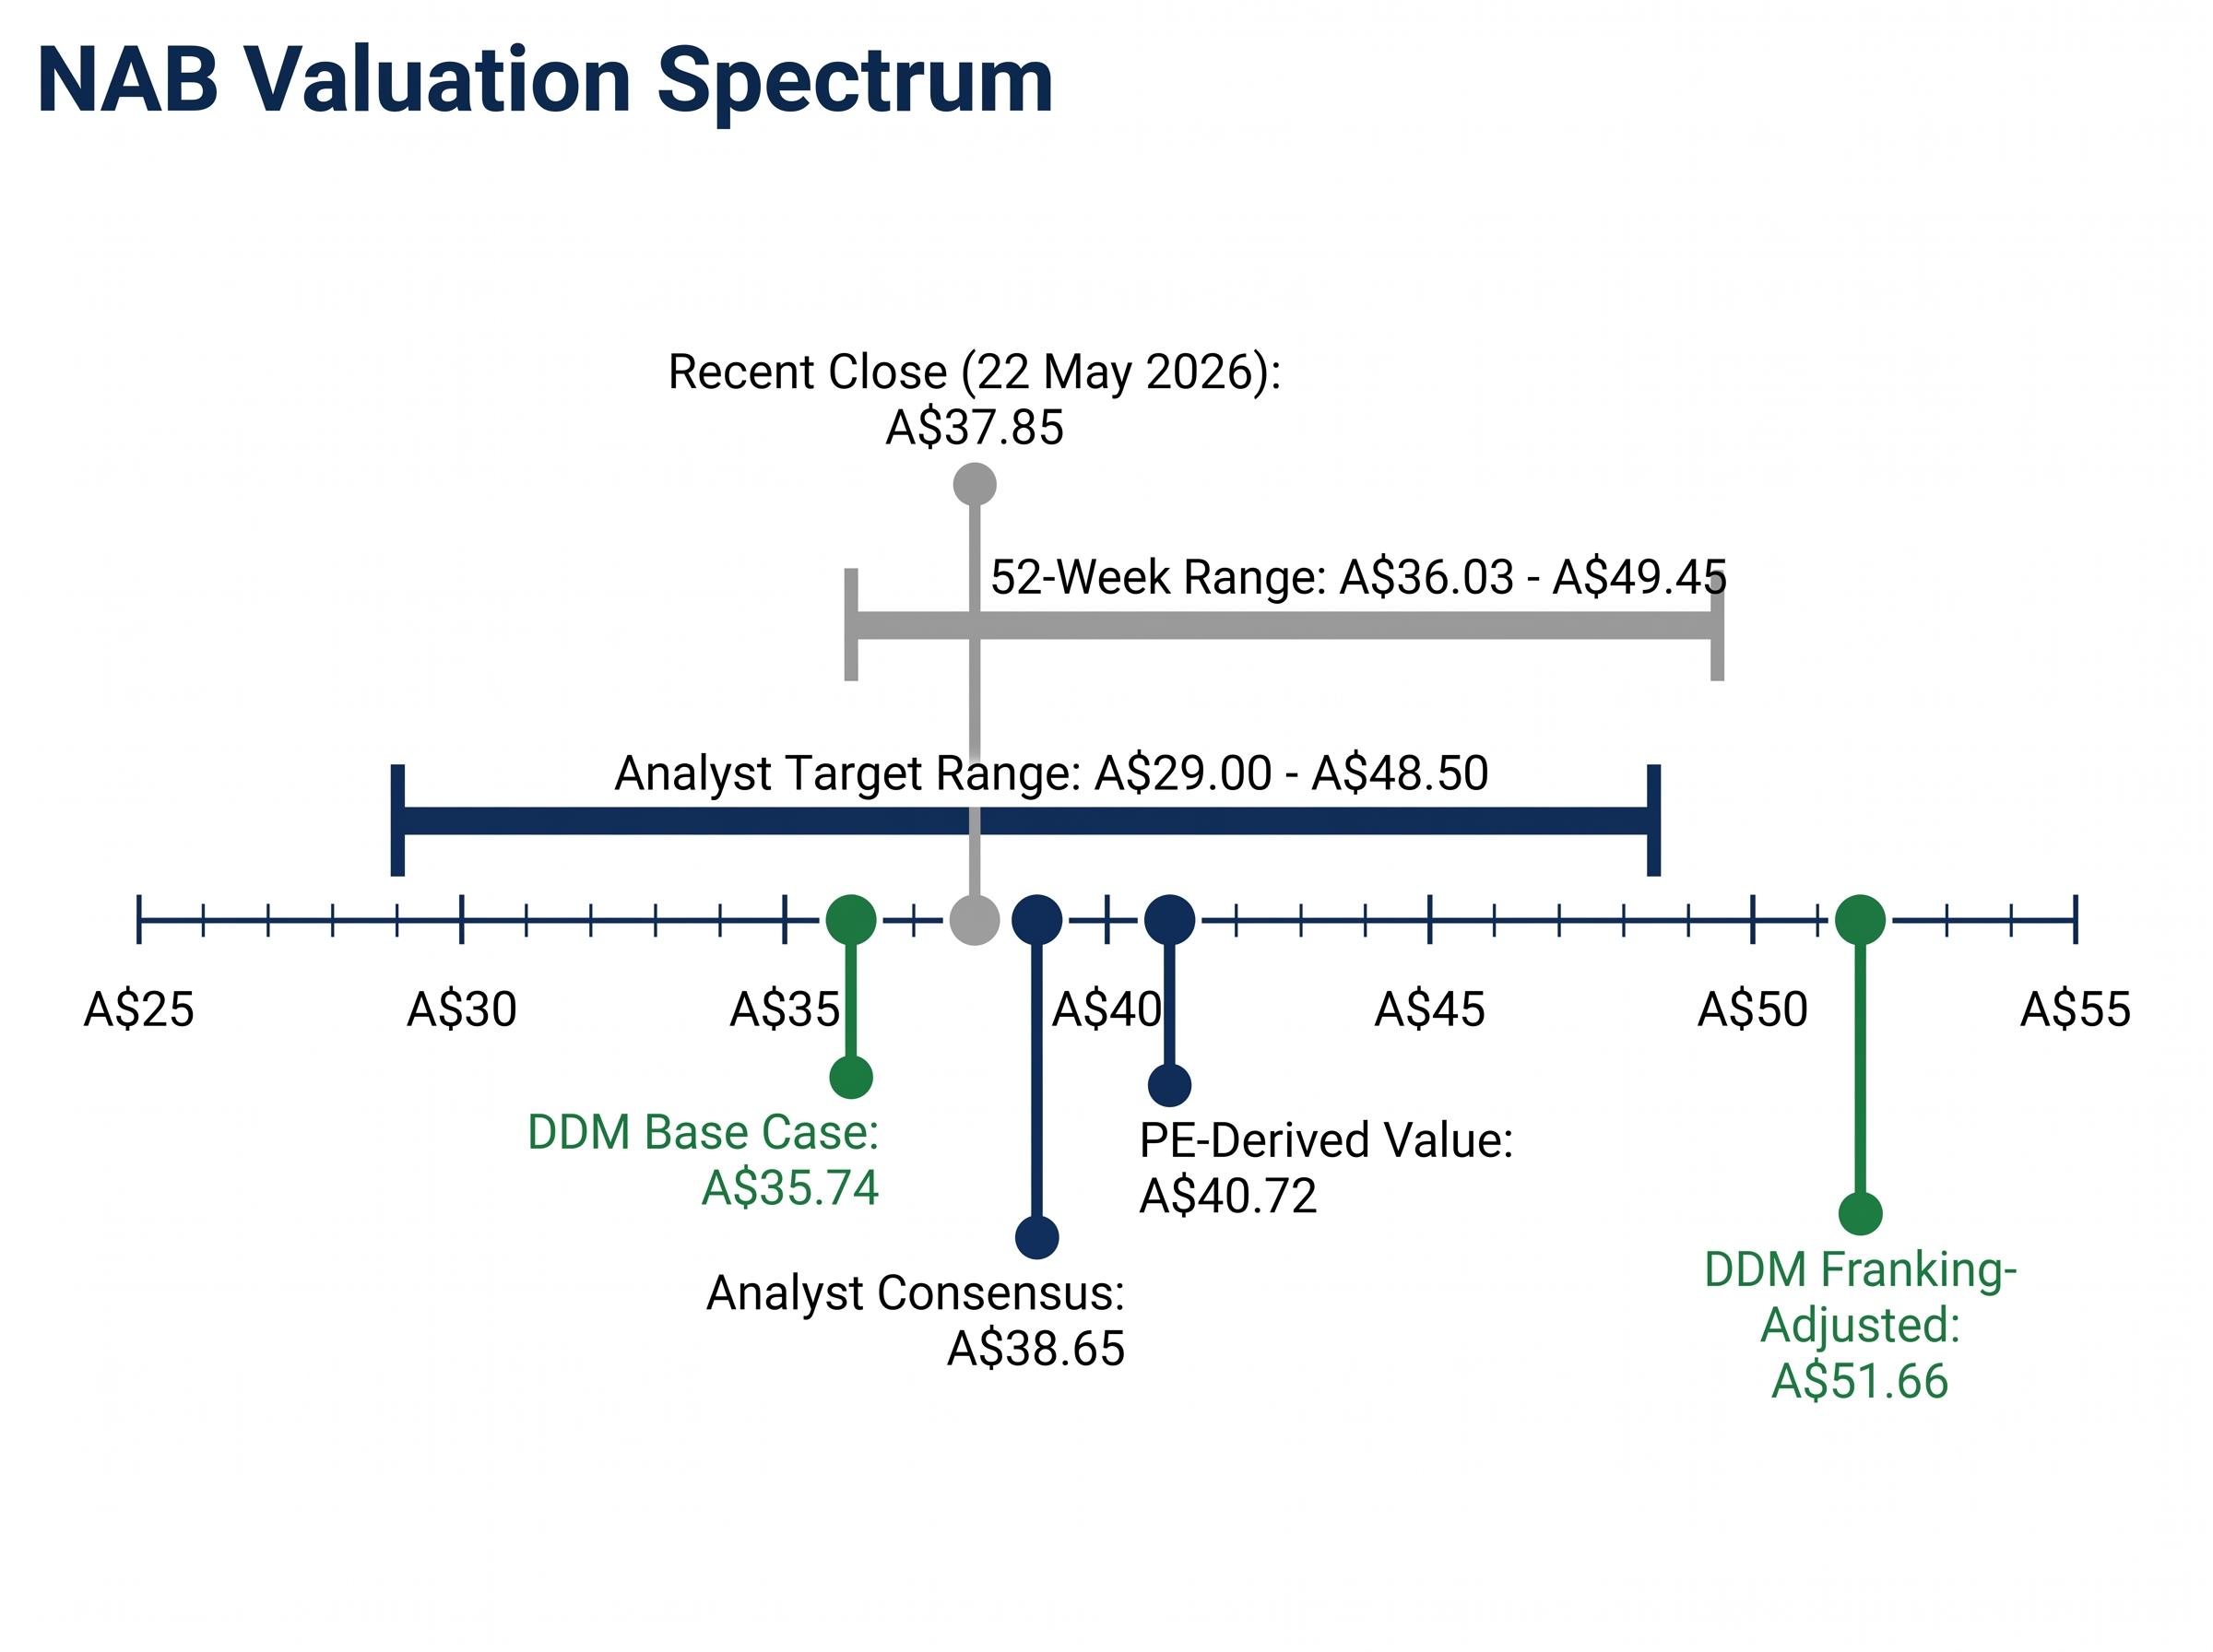
The recent price decline creates a natural laboratory for valuation analysis. NAB’s 52-week range spans A$36.03 to A$49.45, and the current trading level of approximately A$37.85 sits near the bottom of that range. At the same time, the stock trades below the consensus 12-month analyst price target of A$38.65 (derived from 14 analysts, with a range of A$29.00 to A$48.50) and below the sector-PE-derived estimate of A$40.72.
Key reference points for the analysis that follows:
- Recent close: A$37.85 (22 May 2026)
- 52-week range: A$36.03 to A$49.45
- Consensus analyst target: approximately A$38.65 (14 analysts; range A$29.00 to A$48.50)
- Sector-PE-derived fair value estimate: A$40.72
That three-way tension, between the market price, the analyst consensus, and the model-derived estimate, is what makes NAB a useful specimen for understanding how valuation methods work in practice.
When big ASX news breaks, our subscribers know first
What the Price-Earnings ratio actually measures (and what it misses)
The PE ratio answers a deceptively simple question: how many years of current earnings is the market asking you to pay for this share at today’s price? If a company earns A$2.26 per share and trades at A$37.59, the trailing PE is approximately 16.6x. That means the buyer is paying the equivalent of 16.6 years of current profits for the share.
The number on its own, however, says little. It becomes a valuation tool only when compared against a benchmark. The most common approach is to apply the sector average PE to the company’s earnings, which assumes the stock should trade at the same multiple as its peers.
The calculation for NAB involves three steps:
- Identify NAB’s most recent full-year earnings per share: A$2.26 (FY24 reported EPS)
- Identify the banking sector average trailing PE: approximately 18x
- Multiply: A$2.26 x 18 = A$40.72 implied fair value
Sector-PE-derived fair value: A$40.72 per share
At a trading price of approximately A$37.59, this method suggests NAB may be modestly undervalued relative to its peer group. The gap is around 8%.
The assumption doing the work here, however, is that NAB deserves to trade at the sector average. That premise is worth examining. The table below shows where each major bank sits:
The limitations of the PE ratio extend beyond sector-average distortions: the metric ignores capital structure entirely, meaning two stocks at identical multiples can carry dramatically different risk profiles depending on leverage, and it breaks down completely for any period in which earnings are temporarily depressed by one-off charges.
| Bank | Approximate trailing PE | Position vs sector average |
|---|---|---|
| CBA | 26-28x | Significant premium |
| NAB | 16.6-18.97x | At or slightly below average |
| ANZ | High teens | Broadly in line |
| Westpac | High teens | Broadly in line |
CBA trades at roughly 50% above its peers, which inflates the sector average. If CBA’s premium reflects factors specific to that franchise (brand strength, deposit market share, retail investor preference), then applying the CBA-inflated average to NAB may overstate NAB’s fair value. The A$40.72 estimate is only as reliable as the assumption that NAB’s earnings quality warrants the same multiple as the sector composite.
How the Dividend Discount Model values NAB’s income stream
The DDM takes a fundamentally different approach. Rather than asking what multiple the market should assign to today’s earnings, it asks: what is the present value of all the dividends this stock will pay in the future?
Banks are particularly well-suited to this method. Their relatively stable, regulated earnings tend to produce predictable dividend streams, and NAB’s recent dividend history reinforces that pattern. The 2025 final dividend and the 2026 interim dividend were both 85 cents per share, 100% franked. The ex-dividend date for the 2026 interim was 7 May 2026, with payment scheduled for 2 July 2026.
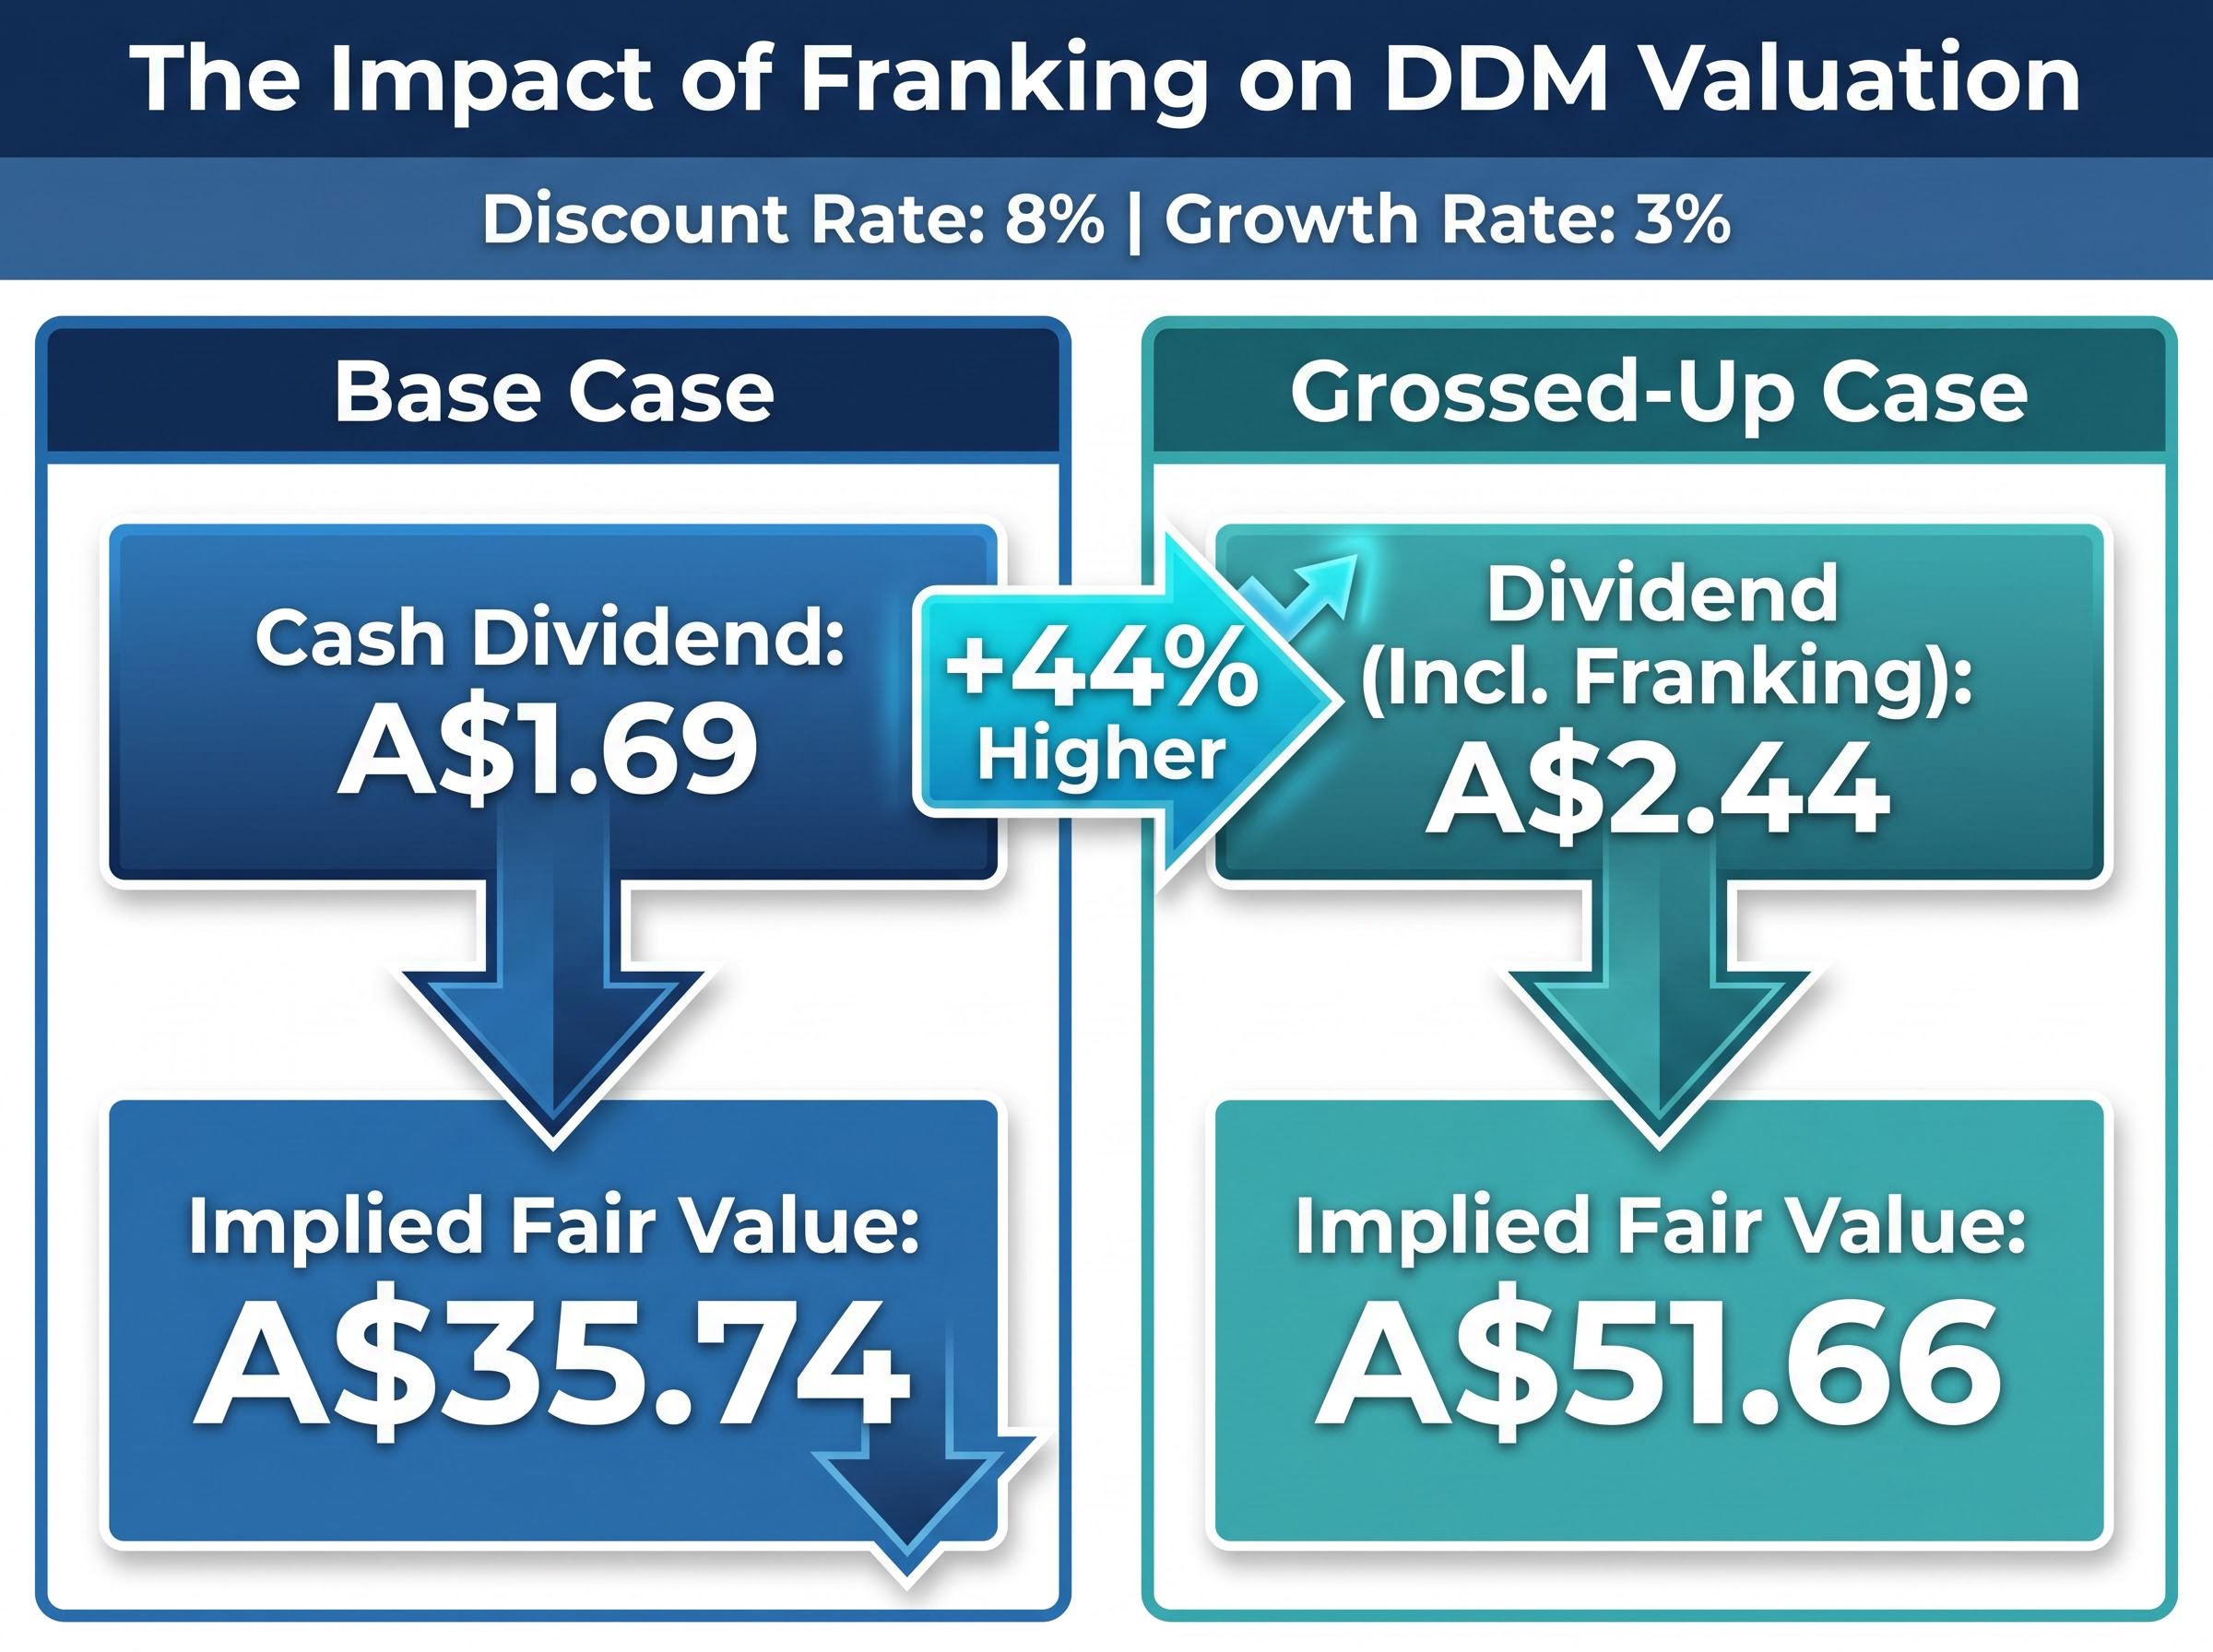
The base-case DDM uses NAB’s last-twelve-months (LTM) cash dividend of A$1.69 per share, a discount rate range of 6% to 11%, and a dividend growth rate assumption of 2% to 4%. At the midpoint assumptions, the model produces a fair-value estimate of A$35.74 per share. A slightly adjusted dividend figure of A$1.71 per share yields A$36.16.
The sensitivity of the output to input changes is the most instructive part of the exercise:
| Discount rate / Growth rate | Dividend input | Implied fair value |
|---|---|---|
| 8% / 3% (base case) | A$1.69 (cash) | A$35.74 |
| 8% / 3% (adjusted) | A$1.71 (cash) | A$36.16 |
| 6% / 2% | A$1.69 (cash) | Upper range |
| 8% / 3% (grossed up) | A$2.44 (incl. franking) | A$51.66 |
The base case sits close to NAB’s current trading price, suggesting the market may be pricing the stock approximately in line with its dividend stream. But the range across scenarios is enormous: A$35.74 to A$51.66, a spread of nearly A$16 on the same stock using the same method.
Franking-adjusted DDM upper bound: A$51.66 per share
Why franking credits change the valuation so dramatically
The upper-bound figure of A$51.66 uses a grossed-up dividend of A$2.44 per share, which includes the value of franking credits attached to NAB’s 100% franked distributions. That gross figure is 44% higher than the A$1.69 cash dividend, and because the DDM formula divides the dividend by the difference between the discount rate and growth rate, a 44% increase in the numerator flows directly through to a proportional increase in the output.
The grossed-up dividend yield adjusts the headline cash figure upward by the value of attached franking credits, and for NAB’s fully franked distributions that adjustment shifts the DDM numerator from A$1.69 to A$2.44, a 44% increase that flows directly through to the model’s fair-value output in proportion.
This adjustment is not universally applicable. Franking credits deliver their full value primarily to Australian resident investors in lower tax brackets, superannuation funds in accumulation phase, and self-managed super funds in pension phase (which may receive a full refund of excess franking credits). Non-resident investors, or those already paying the top marginal rate, derive less incremental benefit. The “right” DDM input depends entirely on the investor’s personal tax circumstances.
Why the same stock produces such different valuations
The PE approach and the DDM are not competing answers to the same question. They are answering different questions with different inputs, and the gap between their outputs reveals three structural sources of divergence.
- Earnings figure used: The PE calculation above uses NAB’s FY24 reported EPS of A$2.26. The FY26 consensus estimate has been revised down to approximately A$2.20 (from earlier forecasts of approximately A$2.47). Substituting the forward estimate would lower the PE-derived fair value.
- Discount rate: In the DDM, moving the discount rate from 6% to 10% on the same dividend stream can collapse the implied fair value from the high forties to the low twenties. Two analysts using identical dividend assumptions but different discount rates will reach opposite conclusions about whether NAB is cheap.
- Growth rate assumption: A 2% dividend growth assumption reflects a cautious outlook; 4% implies confidence in NAB’s ability to grow earnings and maintain its payout ratio. The difference between these two assumptions compounds over the perpetuity embedded in the DDM formula.
The analyst price target range for NAB spans A$29.00 to A$48.50 across 14 analysts, a spread of nearly A$20 on a stock trading at A$37.85.
That range is not evidence of analytical failure. It is the natural consequence of legitimate disagreement about which inputs are most defensible. Analysts operating at the bottom of the range are applying higher discount rates or lower growth assumptions; those at the top are crediting NAB with margin expansion potential or capturing franking value.
The sector forward PE of approximately 18-19x has itself been described by analysts as stretched relative to historical averages, which adds another layer. If the sector multiple compresses, the PE-derived fair value for NAB falls with it, even if NAB’s own earnings remain stable.
What these numbers do not tell you about NAB
Both the PE ratio and the DDM treat their inputs as stable. Neither model adjusts dynamically for the operating conditions that determine whether those inputs hold, improve, or deteriorate.
Three qualitative factors sit outside the models but directly affect their reliability:
- Net interest margin trajectory: NAB reported a NIM of 1.74% in FY25, an improvement of approximately 3 basis points. The FY26 outlook projects business credit growth of approximately 9% and housing credit growth of approximately 7%, both of which support revenue. Whether NIM holds or compresses under competitive pricing pressure will determine whether the EPS and dividend inputs used in the models remain valid.
- Regulatory capital requirements: New APRA rules require higher capital buffers, which can constrain dividend growth.
- Management quality and governance: Longer-term holders (those with horizons of 10 years or more) face compounding exposure to governance quality, which no quantitative model captures.
NAB’s May 2026 margin miss sits at the centre of the recent re-rating: reporting season revealed net interest margin underperformance driven by deposit competition and mortgage refinancing pressure, and Morgan Stanley reversed a February 2026 sector earnings upgrade of approximately 4% in direct response, citing a forward PE of 18.5 times that still had room to contract.
The regulatory and governance layer
APRA’s Loss-Absorbing Capacity (LAC) rules took effect on 1 January 2026, requiring major banks to hold Total Capital at a minimum of 4.5% of risk-weighted assets under the LAC framework. NAB has positioned its capital buffers to meet these requirements, but the framework constrains the capital available for dividend growth. If NAB must retain more capital to satisfy regulatory minimums, the dividend growth rate plugged into any DDM declines, which in turn compresses the model’s fair-value output.
APRA’s LAC framework for major banks sets the minimum Total Capital requirement at an additional 4.5 percentage points of risk-weighted assets for domestic systemically important banks, a binding constraint that directly limits how much capital NAB can direct toward dividend growth rather than regulatory buffers.
NAB’s governance culture has been assessed as not achieving a perfect rating in available evaluations, a factor that carries limited weight in short-term valuation exercises but becomes material for investors whose holding period spans multiple management cycles. The FY26 dividend per share expectation remains at 85 cents per share (fully franked), consistent with recent declared amounts, but the ability to sustain or grow that payout over time depends on the qualitative factors the models cannot see.
Valuation as a starting point, not a verdict
The two methods examined here produce outputs that bracket NAB’s current trading price rather than converging on a single answer:
- PE-derived fair value: A$40.72 (suggesting modest undervaluation at A$37.59)
- DDM base case: A$35.74 (suggesting the stock is approximately fairly priced)
- DDM franking-adjusted upper bound: A$51.66 (suggesting significant undervaluation for eligible investors)
Averaging scenarios, rather than anchoring to the most optimistic or pessimistic case, produces a more balanced estimate. But the real value of the exercise is not the output. It is the process of identifying which input is doing the most work in each model and asking whether that assumption is defensible.
In the DDM, the discount rate typically dominates. In the PE approach, the sector multiple assumed carries the calculation. Before accepting any fair-value estimate for NAB, or for any ASX bank stock, the most productive next step is to isolate that dominant input and pressure-test it against the company’s current operating environment: its margin trajectory, its capital constraints, and its earnings outlook.
Investors who want to extend this framework beyond PE and DDM will find our full explainer on ASX bank stock valuation methods, which covers price-to-book, discounted cash flow, and the qualitative due diligence on management track record and loan book quality that should precede any quantitative conclusion.
This article is for informational purposes only and should not be considered financial advice. Investors should conduct their own research and consult with financial professionals before making investment decisions.