Most stock valuation articles tell you to find a discount rate and discount some cash flows. Very few tell you what rate to use, how big a discount to demand, or why getting the answer slightly wrong still protects your capital if you build a sufficient buffer into the purchase price.
This guide presents a complete, step-by-step evaluation framework built around two non-negotiable parameters: a 15% minimum annualised return hurdle and a 30-50% margin of safety applied to calculated intrinsic value. The framework draws on principles developed by Benjamin Graham, Warren Buffett, and Phil Town. It is designed specifically for self-directed retail investors who want a repeatable, disciplined process rather than a set of loosely connected rules of thumb.
Here is the framework for evaluating any stock you are considering: a structured process that produces an actionable price target range, a mathematical formula for calculating intrinsic value per share, and a clear understanding of why the margin of safety concept is not just a valuation technique but a risk management philosophy that protects your capital when your assumptions turn out to be wrong.
Start before the spreadsheet: the qualitative screen that filters out most stocks
Most retail investors lose money not because their valuation model was wrong but because they applied it to a mediocre business. The numbers only matter if the business underneath them can sustain its economics over a decade. That means the qualitative screen comes first, and skipping it is the single most expensive mistake you can make.
The quantitative model is only worth running on businesses that pass the qualitative screen first. A cheap price on a bad business is not a bargain.
Before you open a spreadsheet, every candidate must clear three distinct criteria:
- Operational quality. Does the business produce free cash flow consistently and grow it over time? Is its core business model straightforward enough to understand and explain?
- Moat durability. What structural advantage prevents a well-capitalised rival from eroding this company’s economics within a five-year window? If no convincing answer exists, the analysis stops here.
- Management competence and integrity. Does the leadership team deploy capital wisely, communicate with shareholders transparently, and have meaningful skin in the game through ownership?
The moat assessment is not decorative. It directly determines which tier of margin of safety you will apply later. A company with a wide, durable moat earns a 30% margin of safety. A cyclical or leveraged business with a narrower moat demands 40-50%. That calibration decision starts here, not at the spreadsheet stage.
Economic moat investing formalises moat assessment into five distinct source categories: intangible assets, switching costs, network effects, cost advantage, and efficient scale, with companies possessing multiple reinforcing sources considered materially more durable than those relying on a single driver.
If a business cannot pass all three gates, the price is irrelevant. Move on.
When big ASX news breaks, our subscribers know first
Why 15%? Understanding the return hurdle that anchors the whole model
The 15% annualised return hurdle is a required return for new positions. It is not a prediction about what the market will earn, and it is not a weighted average cost of capital (WACC, the blended rate a company pays across its debt and equity financing) derived from beta and capital structure. It is a pre-committed policy choice, and that distinction matters.
Standard discounted cash flow (DCF) guides typically suggest an equity discount rate or WACC of 8-12% for mature, non-hyper-growth companies. The 15% hurdle is deliberately higher. It forces you to demand more from every position before you deploy capital.
Damodaran’s DCF discount rate guidance establishes that the discount rate applied in a cash flow model must be consistent with the riskiness of the cash flows being discounted, which is precisely why a 15% hurdle applied to concentrated, high-conviction positions is a deliberate policy choice rather than an arbitrary figure.
The conditions under which the 15% rate is appropriate:
- You are building a concentrated portfolio where each position carries meaningful weight
- You are willing to hold cash and wait for the right price rather than deploy capital into marginal opportunities
- You treat the hurdle as unconditional, meaning you do not lower it when a stock you like fails to clear it
For very stable mega-cap businesses in highly efficient markets, some practitioners use a lower discount rate but insist on a comparable margin of safety instead, achieving equivalent conservatism through a different mechanism.
The correct response to higher business risk is to scale the margin of safety upward, demanding 40-50% rather than 30%, not to lower the discount rate. The discount rate is your floor. The margin of safety is your shock absorber.
The 15% hurdle works as a second filter. If a stock cannot clear a 15% return requirement even at an already-discounted price, treat that as a signal to wait. The temptation to lower the bar is precisely what the pre-commitment prevents.
How to calculate intrinsic value: the ten-year DCF model step by step
This is the mechanical core. A discounted cash flow model takes a company’s projected future cash flows, discounts them back to today’s value at your required return rate, and tells you what those cash flows are worth right now. Here is how to build one.
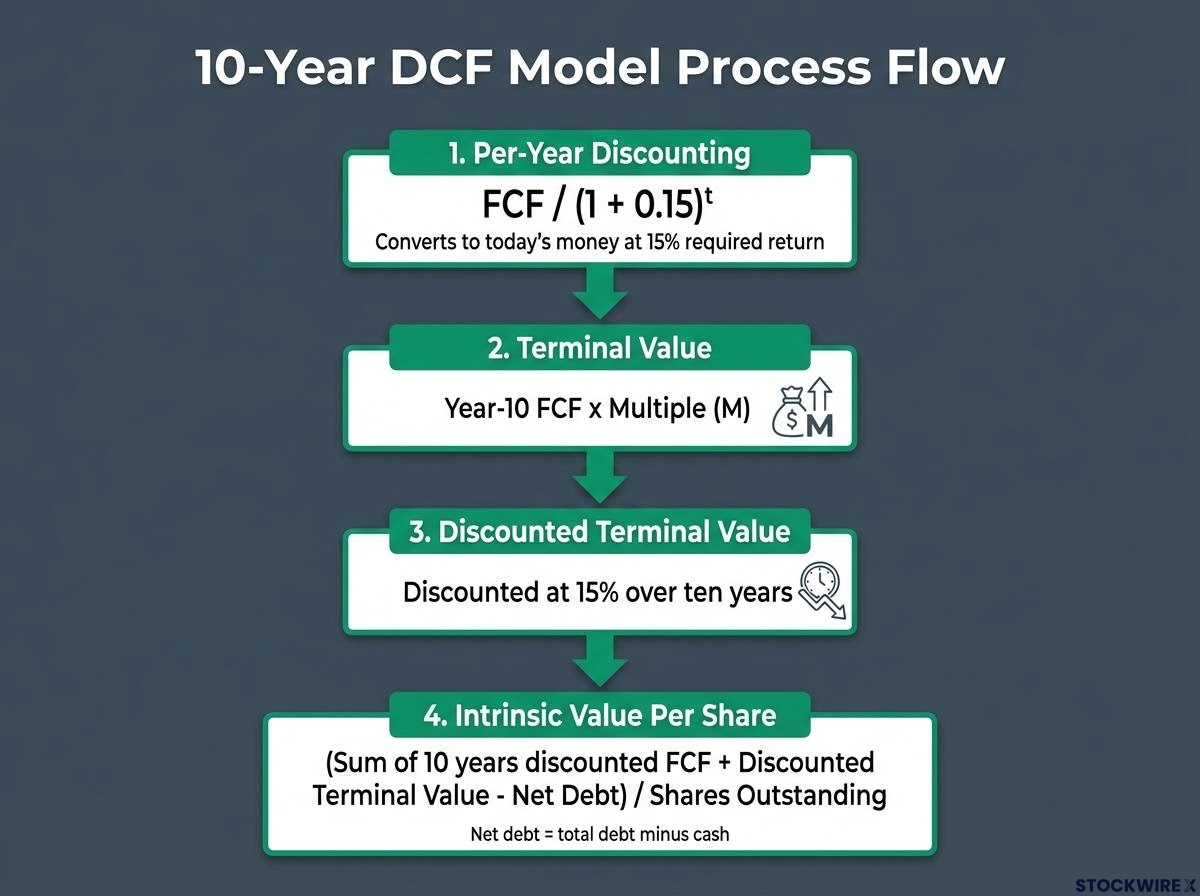
The model uses four formulas in sequence:
- Per-year discounting: Present value of each year’s free cash flow (FCF) equals FCF in year t divided by (1 + 0.15) raised to the power of t. This converts each future year’s cash flow into today’s money at your 15% required return.
- Terminal value: Multiply year-10 FCF by a reasonable earnings or cash flow multiple (M) to estimate the business’s value at the end of the projection period.
- Discounted terminal value: Take that terminal value and discount it back to today at 15% over ten years.
- Intrinsic value per share: Sum all ten years of discounted cash flows plus the discounted terminal value, subtract net debt (total debt minus cash), then divide by shares outstanding.
| Parameter | What it represents | How to select it conservatively |
|---|---|---|
| FCF base year | Starting free cash flow for projections | Use the most recent full-year FCF; normalise for one-off items |
| Growth rate | Annual FCF growth over ten years | Take the lower of historical FCF CAGR, industry prospects, and your own conservative estimate |
| Terminal multiple | Valuation multiple applied to year-10 FCF | Use a moderate multiple consistent with the business’s quality; avoid using peak-cycle multiples |
| Discount rate | Your required annual return | 15% as the framework’s standard hurdle |
Setting your growth rate assumptions
The growth rate is where most valuation errors originate. To keep inputs grounded, identify three separate figures and select only the most modest of them.
- The company’s historical 5-10 year FCF compound annual growth rate (CAGR, the smoothed annualised growth rate over the period)
- Industry growth prospects
- Your own conservative estimate
Anchoring to the lowest of the three prevents optimistic inputs from inflating intrinsic value. The historical CAGR ties you to what the business has actually delivered. Industry growth and your own estimate serve as caps, not as reasons to reach for a higher number.
Treating the output as a range, not a price tag
No single model output should be treated as the answer. Re-run the model with different growth rates and terminal multiples. If you project 8% growth, also run 5% and 10%. If you use a terminal multiple of 12x, also try 10x and 15x.
The range produced by this sensitivity analysis is more trustworthy than any single point estimate. Valuation is part science and part judgment. If the investment only looks attractive at the optimistic end of your range, the margin of safety is doing no real work. You want a stock that looks compelling even at conservative assumptions.
The terminal value assumption alone typically drives 60-80% of a DCF model’s total implied value, making intrinsic value estimation an exercise in stress-testing assumptions rather than solving for a single correct number.
Calibrating the margin of safety: when to demand 30% and when to demand 50%
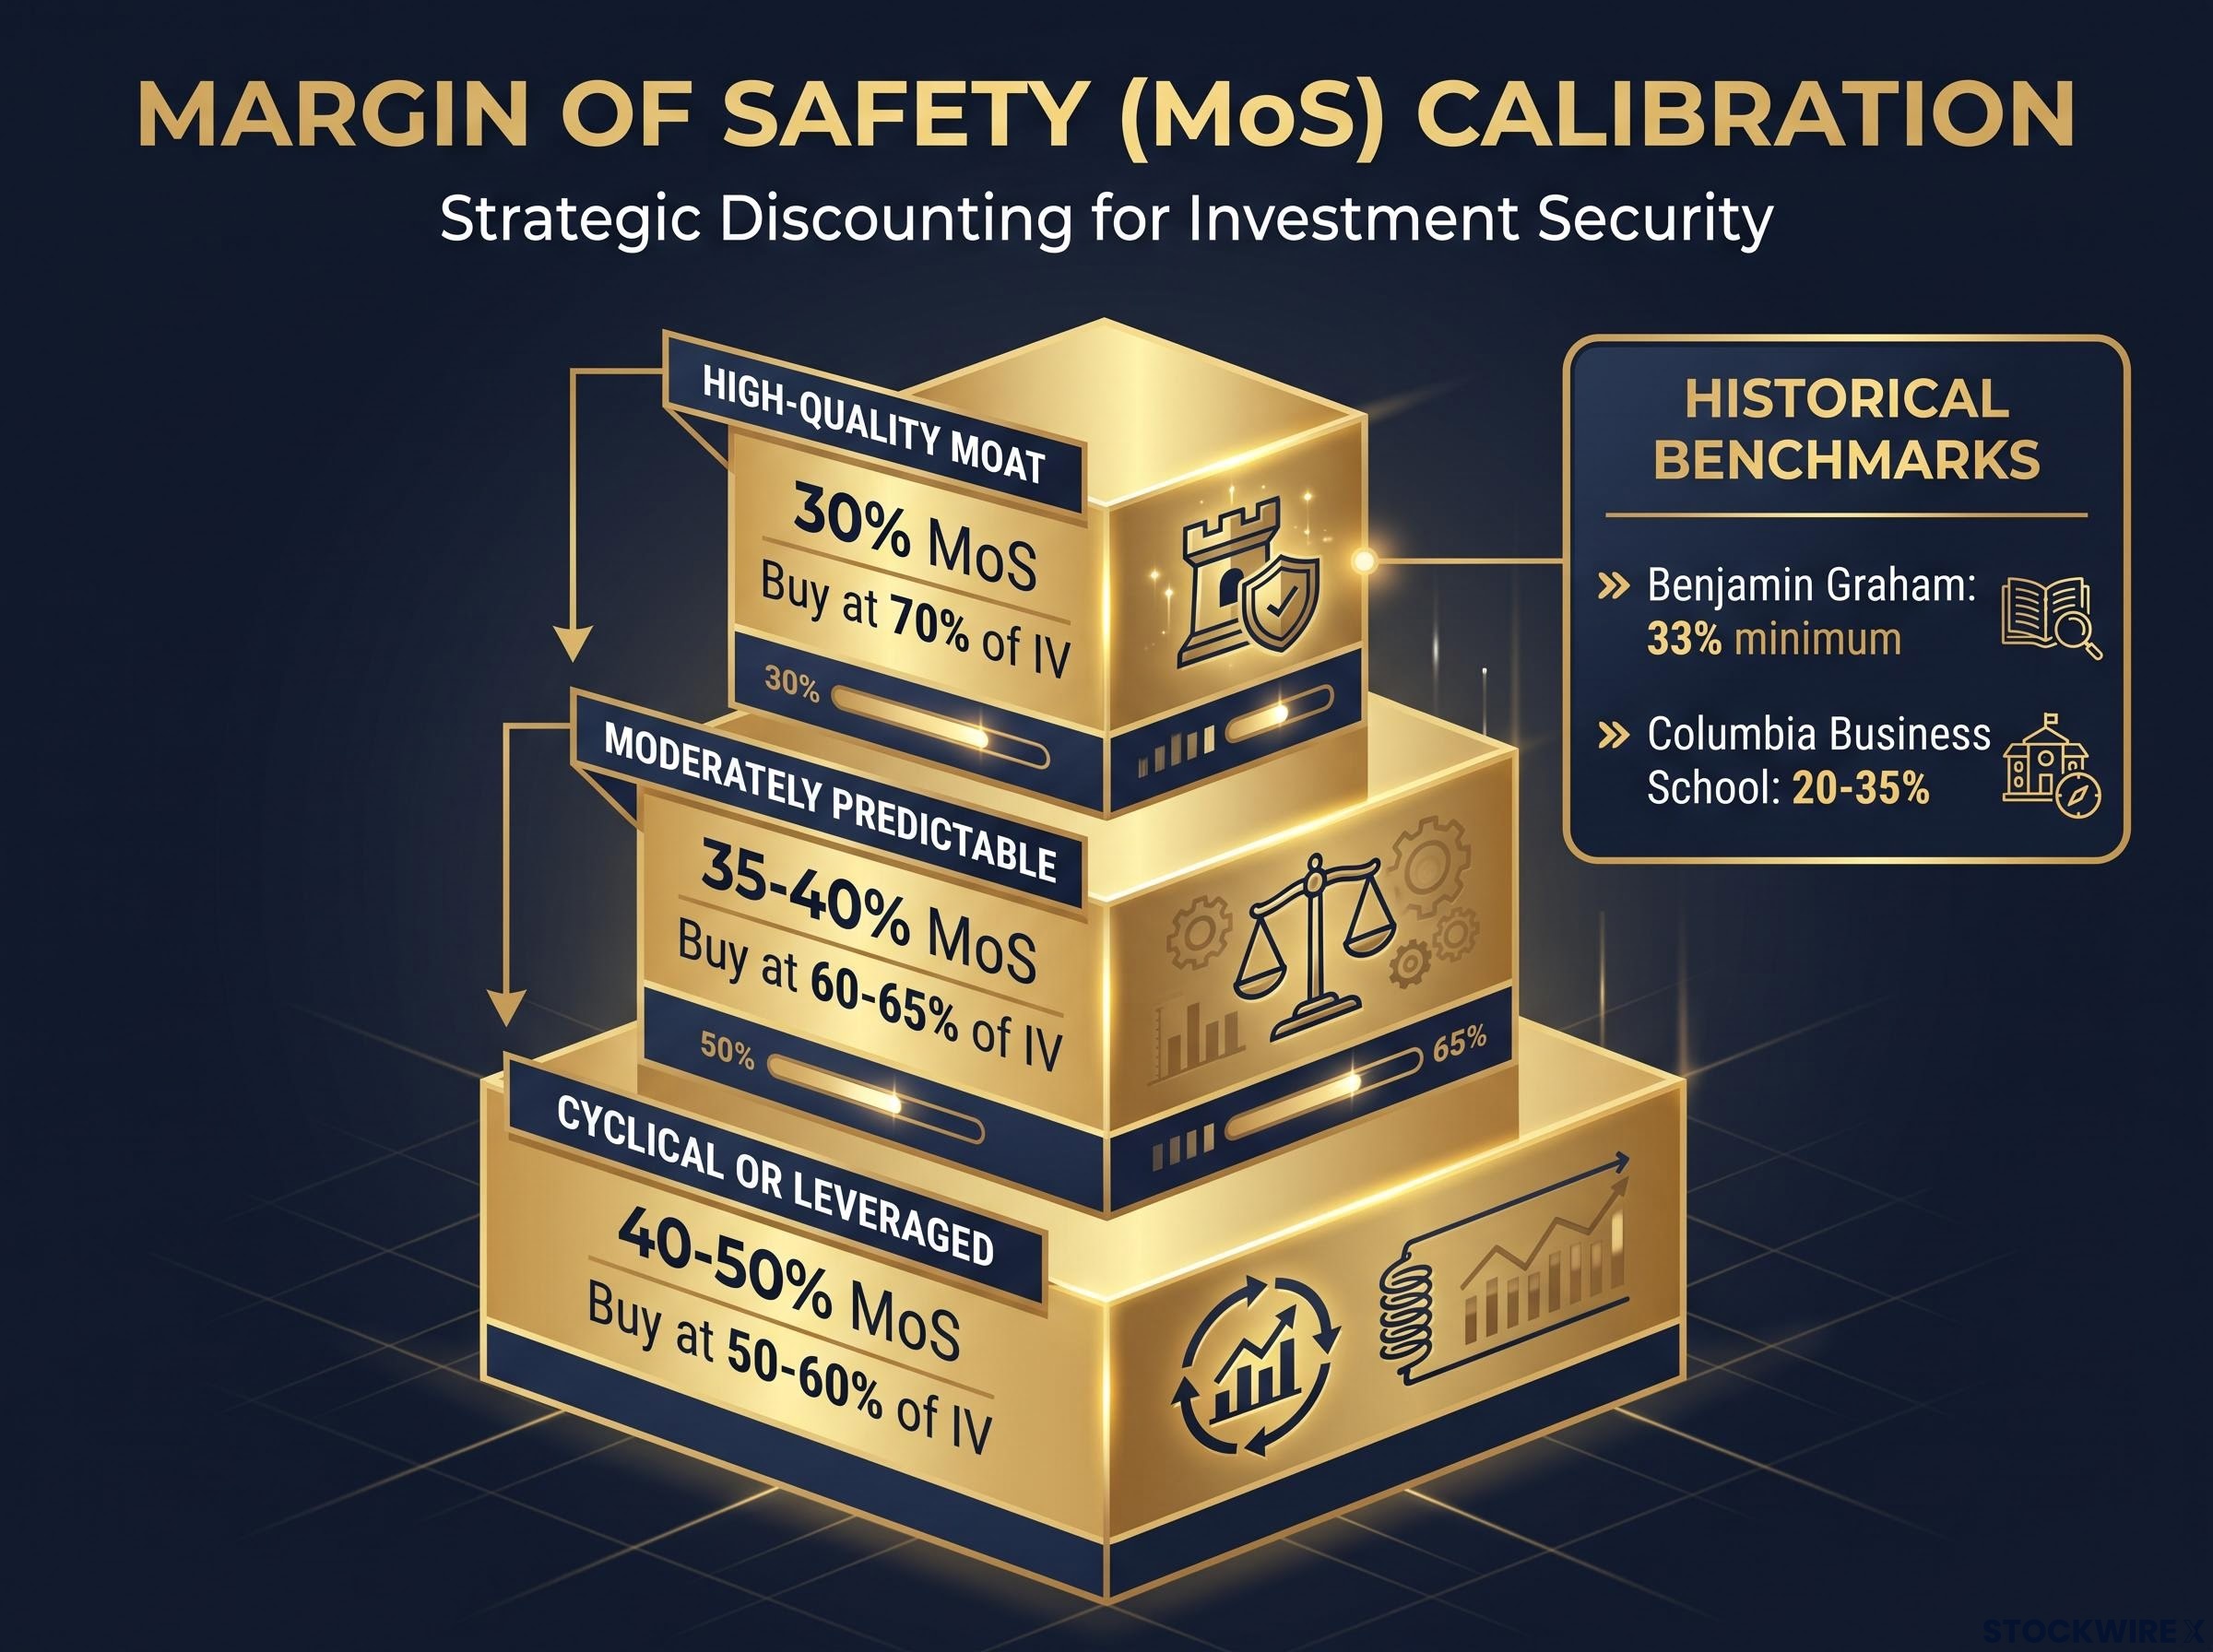
The margin of safety is not a single number applied uniformly. It is a band calibrated to the predictability, moat quality, and leverage profile of the specific business you evaluated in the qualitative screen.
| Business type | Characteristics | Appropriate MoS | Buy price (% of IV) |
|---|---|---|---|
| High-quality moat | Durable competitive advantage, stable and predictable cash flows | 30% | 70% of IV |
| Moderately predictable | Solid business with some cyclicality or competitive pressure | 35-40% | 60-65% of IV |
| Cyclical or leveraged | Less predictable cash flows, higher leverage, narrower moat | 40-50% | 50-60% of IV |
Benjamin Graham recommended a minimum margin of safety of approximately one-third (33%), with higher margins for cyclical or lower-quality firms. Research from Columbia Business School indicates investors should typically demand margins of 20-35%, with larger margins justified for especially risky businesses.
The framework’s 30-50% band sits at or near the conservative edge of mainstream value investing practice, where industry-standard practitioner ranges run approximately 25-50%.
Two simple formulas give you the buy prices. A 30% margin of safety price equals 0.70 times your calculated intrinsic value. A 50% margin of safety price equals 0.50 times intrinsic value.
Concentrated portfolios require higher margins of safety than well-diversified ones, because individual position errors have greater impact on your total portfolio outcome. When you cannot decide whether a business deserves 30% or 50%, default to the higher number. The cost of being too conservative is a missed opportunity. The cost of being too generous is a permanent capital loss.
The structural advantage retail investors hold over professional fund managers
You probably assume you are competing at a disadvantage against institutional capital. The opposite is closer to the truth, at least for this particular style of investing.
The three structural advantages you hold:
- No redemption risk. Client withdrawals are not a constraint you face, so you will never be forced to exit a undervalued position simply because others are panicking. A fund manager who has correctly identified value can still be compelled to sell by investor outflows, regardless of their conviction.
- No career-risk groupthink. Fund managers operate within a competitive landscape where being visibly out of step with peers carries professional consequences. The incentive to shadow consensus positioning is powerful and largely absent for a private investor who reports only to themselves.
- No mandate constraints. You are free to sit in cash for extended periods, build a highly concentrated book of your best ideas, and hold out for prices that meet your criteria. Most institutional mandates require near-full deployment, broad diversification, and capital allocation on rigid quarterly schedules.
Harvard Law’s analysis of institutional investment mandates identifies at-will termination clauses and short-term incentive structures as the primary mechanisms that force fund managers into near-full deployment and constrain their ability to hold cash through extended periods of overvaluation.
The patience the 30-50% margin of safety demands is something you can actually exercise. Institutional managers structurally cannot. That patience is the single most valuable edge available to a self-directed investor.
These advantages compound over time. Every time you choose not to sell a deeply discounted position because an institution triggered a market panic, you are exercising an advantage that professionals cannot replicate. The timing of convergence between market price and intrinsic value is unknown; buying at deep discounts is the only reliable way to give yourself enough room for patience.
The five-step implementation process: from screening a stock to placing an order
This checklist converts the framework into a repeatable process you can apply to any stock you are evaluating. Each step produces a decision gate: a business that fails Step 1 does not proceed to Step 2, and a price that sits outside the margin of safety band in Step 4 does not trigger an order.
Steps 1 to 3: valuation work
- Qualitative screen.
- Confirm operational quality
- Assess the durability and width of the economic moat
- Evaluate management competence and integrity
- If the business fails any gate, stop here
- Ten-year FCF projection.
- Establish base-year free cash flow
- Select your growth rate using the conservative rule (lower of historical CAGR, industry growth, and your own estimate)
- Project FCF for each of ten years
- Select a terminal value multiple appropriate to business quality
- Discount and calculate intrinsic value.
- Discount each year’s FCF at 15%
- Calculate and discount terminal value at 15% over ten years
- Subtract net debt, divide by shares outstanding
- Cross-check your result against earnings multiples or other valuation filters as a secondary sanity test; different methods used in combination reduce the risk of a single-method blind spot
Alongside DCF-based intrinsic value, value investing metrics such as the price-to-earnings ratio below 15, price-to-book below 1.5, and free cash flow yield above 5% serve as useful cross-checks that flag when a model output is meaningfully out of step with market-based signals.
Steps 4 to 5: patience and position management
- Establish your margin of safety price band.
- For high-quality, predictable businesses, multiply intrinsic value by 0.70 to arrive at the 30% MoS buy price
- For cyclical, leveraged, or less predictable firms, multiply intrinsic value by 0.50 to arrive at the 50% MoS buy price
- Re-run the model with different growth and multiple assumptions to confirm the range
- Monitor and hold.
- Only purchase when the market price falls within your appropriate MoS band
- Accept that time to convergence is unknown; maintain patience
- Re-assess qualitative factors and assumptions periodically, not in response to price movements
The discipline here is specific: re-assess your assumptions, not the price. Price volatility below your margin of safety threshold is noise. Changes in the underlying business quality or your projection inputs are signal.
A natural extension of this process is a spreadsheet structured as three tabs: Tab 1 for the qualitative checklist, Tab 2 for ten-year FCF projection scenarios with adjustable growth rate and multiple inputs, and Tab 3 for automated intrinsic value and margin of safety band calculations with built-in sensitivity tables.
If you complete all five steps on a stock and find it does not yet meet the purchase threshold, you have not wasted your time. You have built a price-alert framework. Now you wait for the market to deliver the discount the framework requires.
Investors exploring how to build a candidate pipeline before applying this valuation framework will find our full explainer on finding undervalued stocks useful, covering how Buffett, Lynch, Klarman, and Greenblatt each source opportunities in low-coverage corners of the market.
Putting the framework to work in an uncertain market
Three interlocking disciplines protect your capital against the three main sources of investment loss. The qualitative screen protects you from bad businesses. The disciplined 15% return hurdle and DCF model protect you from overvalued entry points. The 30-50% margin of safety protects you from insufficient patience and the inevitable imprecision in your own assumptions.
The framework is not a guarantee. The timing of price convergence is unknown, and the margin of safety mitigates but does not eliminate that risk. What it gives you is a repeatable, auditable process that puts the odds in your favour by ensuring you only buy good businesses at prices that have already absorbed a meaningful amount of bad news.
As a retail investor, you are structurally free to practise the patience, concentration, and price discipline this method demands. That freedom is not available to institutional managers operating under mandates, client redemption pressures, and career-risk incentives. It is a genuine and durable competitive advantage.
Your next step is the simplest one: apply Step 1, the qualitative screen, to one company you are already considering. If it clears all three gates, the rest of the framework is ready.
This article is for informational purposes only and should not be considered financial advice. Investors should conduct their own research and consult with financial professionals before making investment decisions. Financial projections are subject to market conditions and various risk factors, and past performance does not guarantee future results.