Australia’s inflation rate reached 4.6% in the March quarter 2026, the highest reading since 2023, and the Reserve Bank of Australia has raised the cash rate three times this year to 4.35%. For investors holding portfolios built during the low-rate years of 2015-2021, that combination creates a problem that standard diversification alone does not address. Underlying inflation is forecast to remain above the RBA’s 2-3% target band until late 2027, and markets are pricing at least one further rate hike before the end of 2026. The “higher for longer” thesis is no longer speculative; it is the base case. Different ASX sectors respond to this environment in fundamentally different ways, and understanding those distinctions is the starting point for any meaningful portfolio response. This guide walks through the specific risk-and-opportunity profile for ASX banks, listed property trusts, resources and energy stocks, and inflation-linked fixed income, then maps concrete ASX-listed ETFs that give investors targeted exposure to each sector.
Why 2026 is a different macro environment for Australian investors
This is not a single rate hike or a temporary inflation spike. The RBA has executed a coherent tightening cycle across three consecutive decisions in 2026:
- 4 February 2026: Cash rate raised to 3.85%
- 18 March 2026: Cash rate raised to 4.10%
- 5 May 2026: Cash rate raised to 4.35%
Each move followed data confirming that the economy had not slowed sufficiently. Headline CPI printed at 4.6% year-on-year for the March quarter, while the trimmed mean measure, which strips out volatile items and represents the RBA’s preferred gauge of underlying price pressures, came in at 3.3%. That trimmed mean figure sits well above the 2-3% target band and has not responded to prior tightening the way the RBA initially projected.
Trimmed mean inflation, the RBA’s preferred gauge that strips out the most volatile items in each direction, sat at 3.3% for the March quarter, a number that carries more policy weight than the 4.6% headline because it reflects the persistence of underlying price pressures rather than a single category shock.
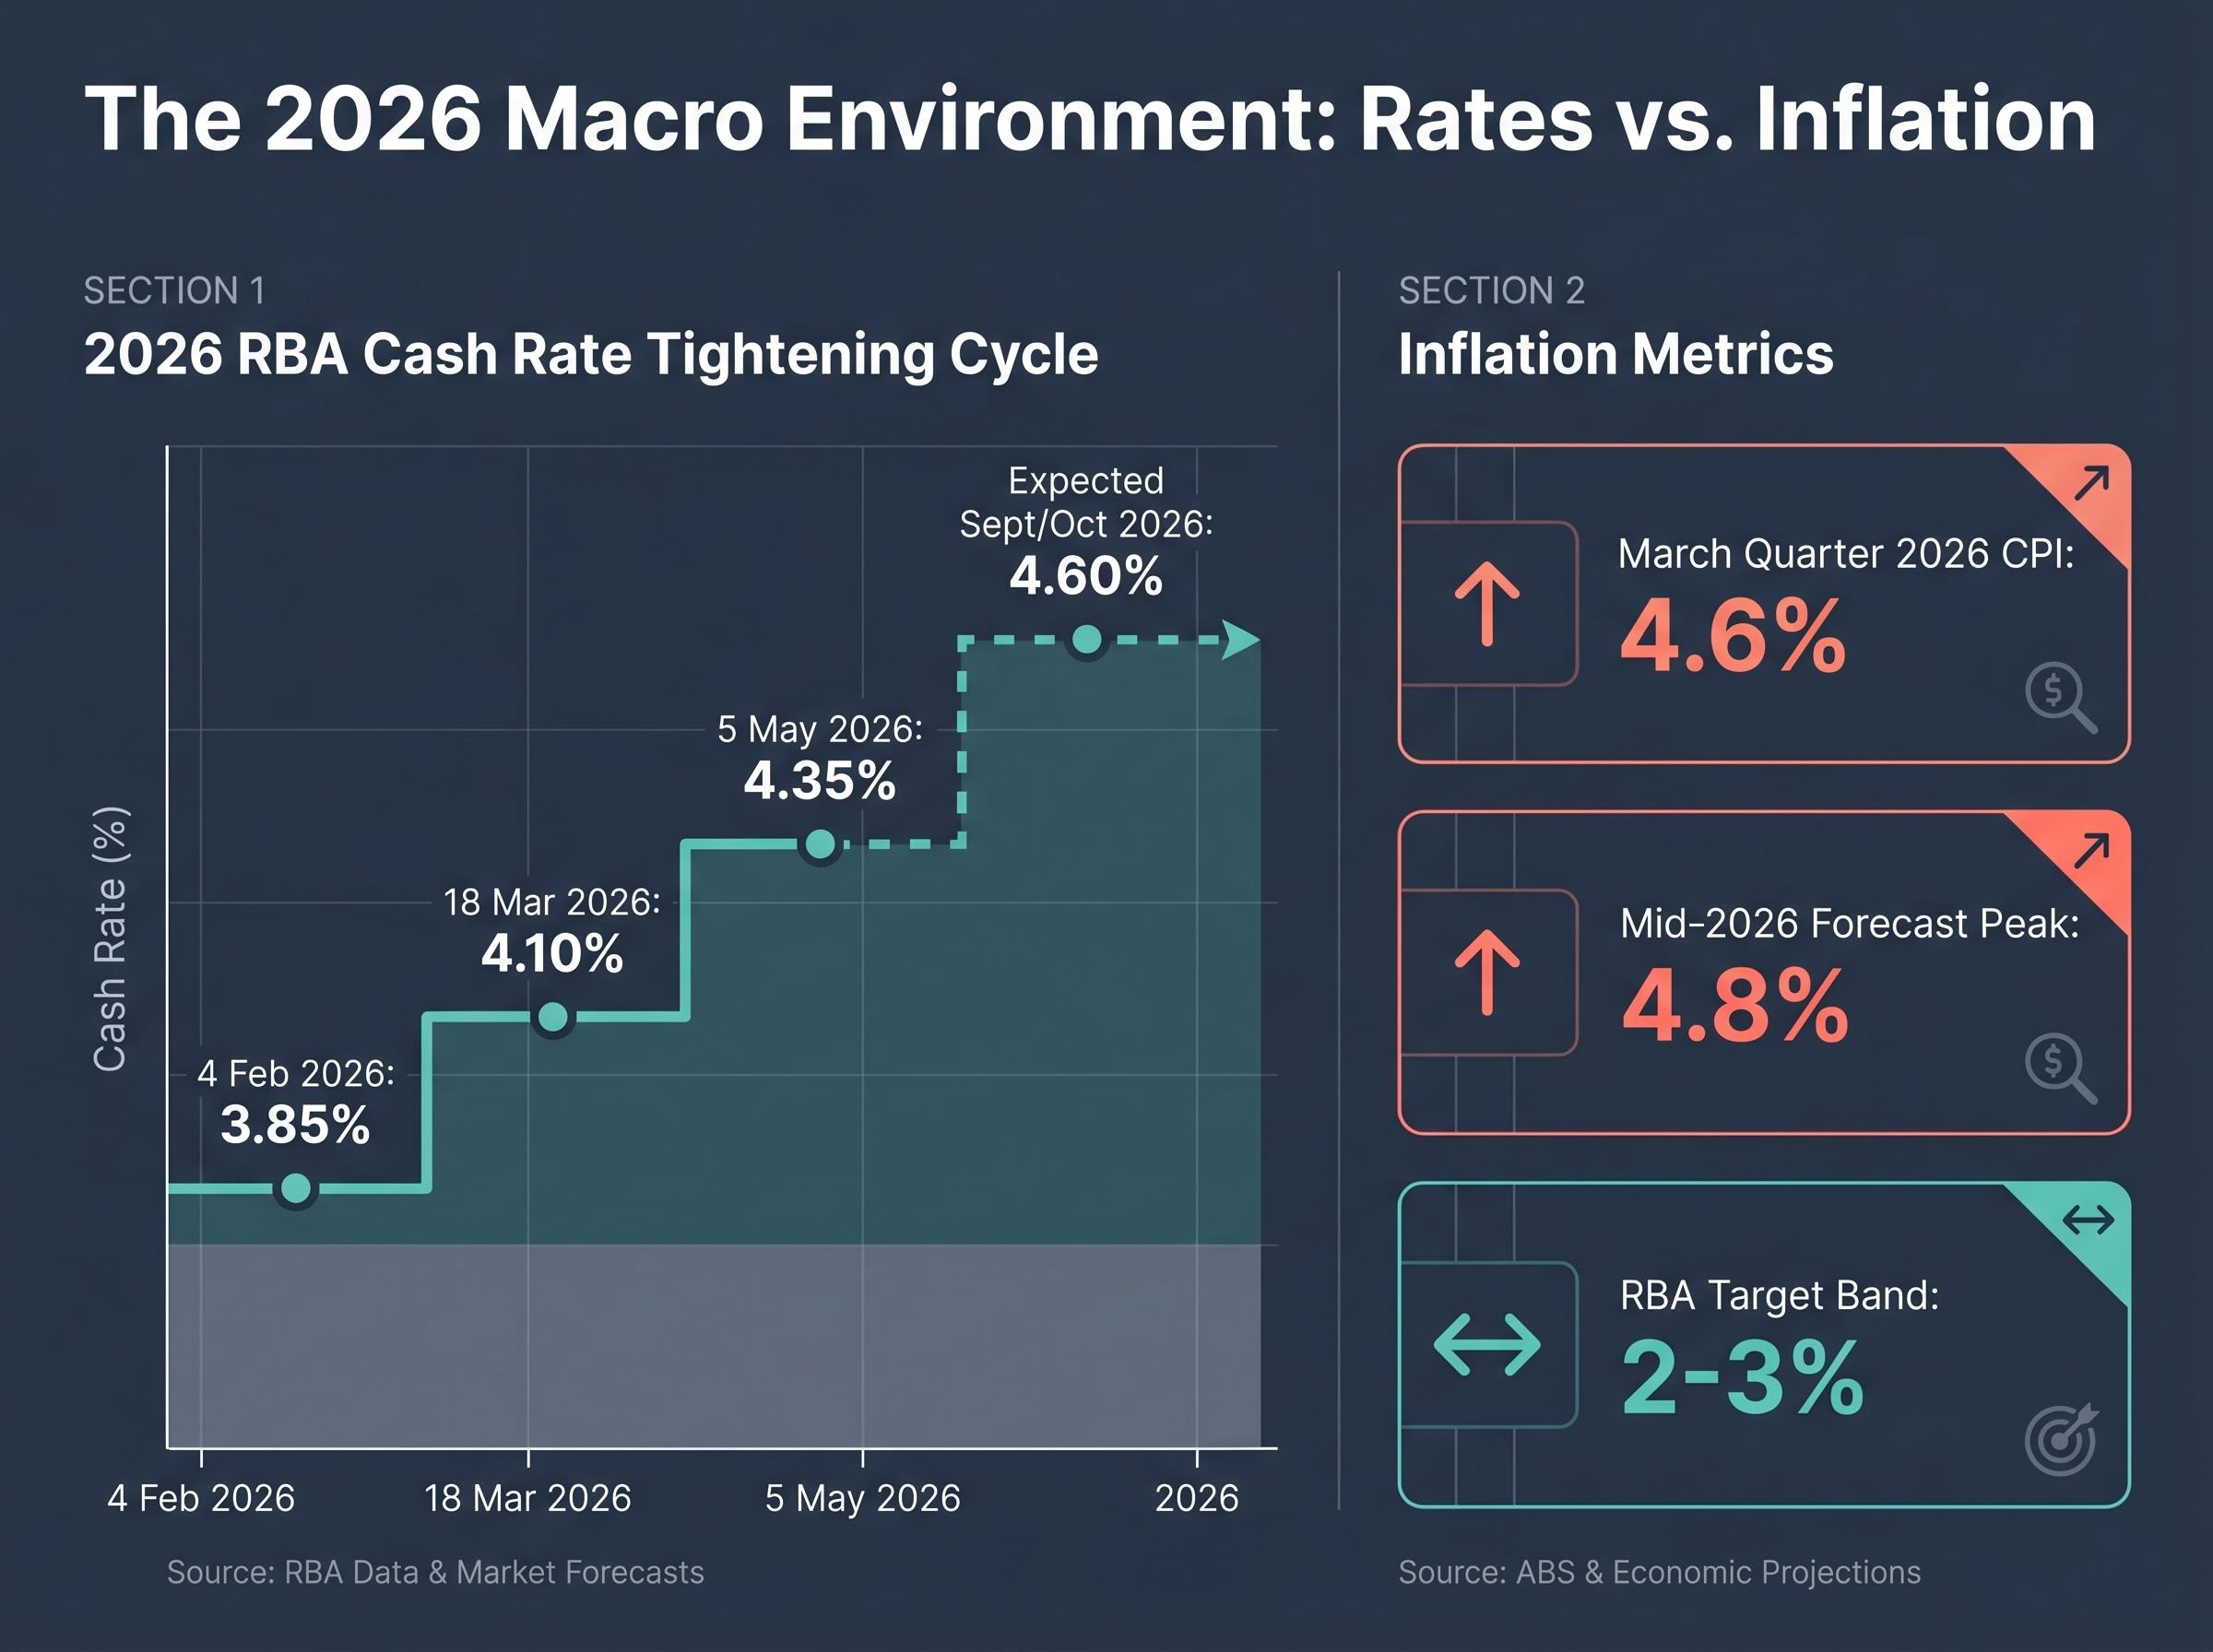
The RBA’s own revised forecasts now place the inflation peak at approximately 4.8% around mid-2026, with underlying inflation remaining above 3% until late 2027. Market pricing reflects this trajectory: at least one further 25 basis point hike to 4.60% is expected, most likely at the September or October 2026 meeting.
The RBA Statement on Monetary Policy published in May 2026 places the projected inflation peak at approximately 4.8% around mid-2026, with underlying inflation expected to remain above 3% until mid-2027 and the assumed cash rate rising to 4.7% by year-end, a trajectory that frames every sector allocation decision discussed in this guide.
RBA revised projection: Underlying inflation is forecast to remain above the 2-3% target band until late 2027, making this a multi-year inflationary environment rather than a transient shock.
Geopolitical tensions, particularly the ongoing Middle East conflict, add an independent upside risk. Elevated energy prices are feeding through to domestic costs as a second-round effect, making the inflationary picture more persistent. Investors who recognise the structural nature of this cycle are better positioned to make allocation decisions that hold up over a multi-year horizon, rather than being caught off guard by a rate environment that proves stickier than consensus initially expected.
When big ASX news breaks, our subscribers know first
What persistent inflation actually means for a portfolio
Understanding that inflation is running at 4.6% is necessary but not sufficient. The more actionable question is how that headline number transmits into specific asset classes, and why the effects diverge so sharply across a portfolio.
Rising interest rates compress equity valuations by increasing the discount rate applied to future earnings. A company expected to generate the same profits in five years is worth less today when those profits are discounted at 4.35% rather than 1.5%. That mathematical relationship penalises long-duration assets, including growth equities priced on distant earnings and long-dated nominal bonds. The Australian 10-year government bond yield at approximately 5.06% in May 2026 reflects exactly this repricing.
The other side of the equation favours assets with genuine pricing power or revenue streams that index directly to inflation. Businesses and instruments that can pass through CPI increases, whether through commodity pricing, CPI-linked rental escalations, or inflation-indexed bond structures, are structurally better positioned than those with fixed revenue and rising cost bases.
The screening criterion that matters most in this environment is inflation-linked revenue: can the asset’s income stream keep pace with, or exceed, the 4.6% annual erosion in purchasing power?
The ABS Consumer Price Index release for the March 2026 quarter confirms both the 4.6% headline CPI figure and the 3.3% trimmed mean reading, giving investors a verified baseline against which to assess the real return of each asset class discussed below.
| Inflationary environment beneficiaries | Inflationary environment headwinds |
|---|---|
| Commodities and resources equities | Long-duration nominal bonds |
| Gold and precious metals | Highly leveraged REITs with fixed rents |
| Inflation-linked bonds | Growth equities priced on distant earnings |
| CPI-linked rental income (select REITs) | Consumer discretionary with limited pricing power |
| Energy producers (oil, LNG) | Fixed-rate income instruments at below-CPI yields |
This framework underpins every sector-specific view that follows. Where a sector falls on this spectrum determines whether it represents an opportunity, a risk, or a more nuanced combination of both.
ASX banks in a high-rate environment: margin tailwind meets credit risk
The bull case for the major banks is straightforward: when lending rates rise faster than deposit costs, net interest margins (NIMs) expand. NIMs represent the difference between what a bank earns on its loans and what it pays on its deposits, and they are the primary driver of bank profitability. That dynamic has been the dominant thesis for ASX bank investors through the 2026 hike cycle, and in the short term, it has delivered. NAB reported half-year profit of $3.6 billion, a 2% increase, with consensus NIM estimates sitting at approximately 1.77%.
The complication arrives when the rate cycle matures. At 4.35% in a 4.6% CPI environment, mortgage stress risks are building. Variable-rate mortgage holders face affordability pressure that has not yet produced a spike in arrears but represents a credible downside risk if rates hold at this level or move higher. Analyst consensus has shifted toward the view that banks are “less advantaged” now than at the start of the tightening cycle, with the NIM expansion trade largely priced in.
The distinction between the bull and bear case is not binary:
- Bull case: Stable short-term earnings, NIM expansion from asset repricing, dividend yields supported by current profit levels
- Bear case: Mortgage stress and credit quality deterioration if rates persist at 4.35% or above, NIM expansion largely exhausted, competitive dynamics in the mortgage market compressing future margins
Some brokers have also flagged outperformance potential for insurers relative to banks in the current environment, making the choice of financial sector vehicle more consequential than it first appears.
Analyst consensus on the Big Four has shifted materially through the 2026 tightening cycle, with CBA carrying unanimous sell ratings from all 14 covering analysts at an average price target implying approximately 25.5% downside, a divergence between price momentum and fundamental valuation that makes stock selection within the sector more consequential than broad financial sector allocation.
MVB versus QFN: choosing your financials exposure
ASX: MVB (VanEck Australian Banks ETF) holds only the Big Four banks, providing concentrated exposure to the NIM thesis but also concentrated exposure to credit quality risk. ASX: QFN (BetaShares Australian Financials Sector ETF) extends coverage to insurers and diversified financials, diluting pure bank risk while capturing the broader financial sector.
For investors who believe the credit quality risk is manageable and the NIM tailwind still has room to run, MVB provides the cleaner expression. For those seeking financial sector exposure with greater diversification, particularly given the insurer outperformance thesis, QFN offers a more balanced vehicle.
Listed property trusts: not all REITs face the same headwinds
The instinct to avoid Australian Real Estate Investment Trusts (A-REITs, which are listed property trusts that own and manage portfolios of commercial, retail, or industrial properties) entirely in a rising-rate environment is understandable but imprecise. Rising discount rates do compress property valuations, and refinancing costs have increased meaningfully at the 4.35% rate level. That structural headwind is real. It is not, however, uniform across the sector.
The S&P/ASX 300 A-REIT Index rose 4.8% in the March quarter 2026, a signal of selective resilience that contradicts a blanket bearish view.
The partial offset comes from CPI-linked rent escalations. REITs with lease structures that index rental income to inflation benefit from the same 4.6% CPI that pressures their borrowing costs. The net effect depends on balance sheet quality, and this is where discrimination within the sector becomes the key investment decision.
The risk differentiators that separate resilient A-REITs from vulnerable ones include:
- Balance sheet leverage: Delevered names with reduced debt levels, such as Charter Hall Retail REIT (CQR), are positioned to weather further rate increases without refinancing stress
- Refinancing timeline: REITs with near-term debt maturities face the steepest cost increases, while those with longer-dated facilities have more runway
- Revenue indexation type: CPI-linked rent escalations provide inflation protection; fixed-rent structures do not
The office sub-sector showed momentum from 2025 improvements but remains structurally challenged by hybrid work trends, making it a less reliable inflation hedge than retail or industrial REITs with stronger occupancy profiles.
Retail REIT occupancy dynamics illustrate the sub-sector divide clearly: Scentre Group and Vicinity Centres are operating at 99.8% and 99.6% occupancy respectively with positive leasing spreads of 3.3% and 4.6%, giving both landlords near-complete pricing power at each lease renewal cycle, a structural position that contrasts sharply with office-exposed names facing delayed recovery and ongoing hybrid work headwinds.
ASX: VAP (Vanguard Australian Property Securities Index ETF) provides broad market exposure to the A-REIT sector. Its index-tracking approach captures both the delevered outperformers and the more leveraged names, meaning investors using VAP as their sole REIT vehicle should understand that the portfolio-level outcome reflects the full spectrum of balance sheet quality across the sector.
Resources and gold: the hard asset case in an inflationary cycle
Rio Tinto (ASX: RIO) has delivered a year-to-date total return of approximately 29.19% as of May 2026. Gold is trading at approximately USD 4,568 per ounce. Silver sits at approximately USD 73.56 per ounce. Iron ore is at approximately USD 110.86 per tonne.
Those numbers are not coincidental. The same geopolitical factors driving domestic inflation, particularly Middle East conflict and elevated energy prices, are simultaneously supporting commodity prices. Resources and energy stocks sit on the beneficiary side of the inflationary equation because their revenue is denominated in the very commodities whose prices are being pushed higher by the macro environment.
Gold warrants specific attention. At 4.6% CPI and elevated geopolitical uncertainty, gold functions as a hard asset hedge whose price behaviour reflects two forces simultaneously: real interest rate dynamics (when inflation exceeds nominal yields, the opportunity cost of holding gold falls) and safe-haven demand driven by geopolitical risk. Both forces are active in the current environment.
The primary bear case for the sector is a resolution of geopolitical tensions or a sharper-than-expected global growth slowdown, either of which would compress the commodity risk premiums that have driven recent performance.
Choosing between broad resources and gold-specific exposure
The ETF landscape offers distinct expressions of the resources thesis. Broad resources ETFs capture diversified commodity upside including base metals and energy, while gold-specific ETFs provide a purer inflation and geopolitical hedge with lower correlation to global growth cycles.
| ETF code | Provider | Underlying exposure | AUD hedged |
|---|---|---|---|
| QRE | BetaShares | Australian resources and mining equities | No |
| OZR | State Street (SPDR) | S&P/ASX 200 Resources (BHP, RIO, Woodside) | No |
| QAU | BetaShares | Gold bullion | Yes |
| GHLD | Global X | Gold bullion | Yes |
| QCB | BetaShares | Diversified commodities (metals, energy, agriculture) | Yes |
QCB adds agricultural commodity exposure, broadening the inflation hedge beyond metals and energy. For investors seeking the broadest possible commodity diversification with AUD hedging, it represents the widest expression of the hard asset thesis.
Fixed income in an inflationary environment: the case for inflation-linked bonds over nominals
The real return arithmetic at current levels reveals the problem with nominal bonds. The Australian 10-year government bond yield sits at approximately 5.06% in May 2026. CPI is running at 4.6%. The steps that follow illustrate why that gap matters:
- Nominal real yield calculation: A 5.06% nominal yield minus 4.6% CPI leaves a real yield of approximately 0.46%. That margin is thin, and any upward revision to inflation expectations erodes it rapidly.
- Inflation-linked bond (ILB) structure: ILBs index both principal and income payments to CPI. The real return is protected against further inflation surprises because the bond’s value adjusts with the price level, rather than depending on inflation falling back to target.
- Current environment comparison: At 4.6% CPI, the structural advantage of ILBs over nominals is clear. Nominal running yields on comparable hedged instruments sit at approximately 2.78%, well below the inflation rate.
- Duration of the advantage: With underlying inflation forecast to remain above 3% until late 2027, the conditions favouring ILBs over nominals may persist for an extended period.
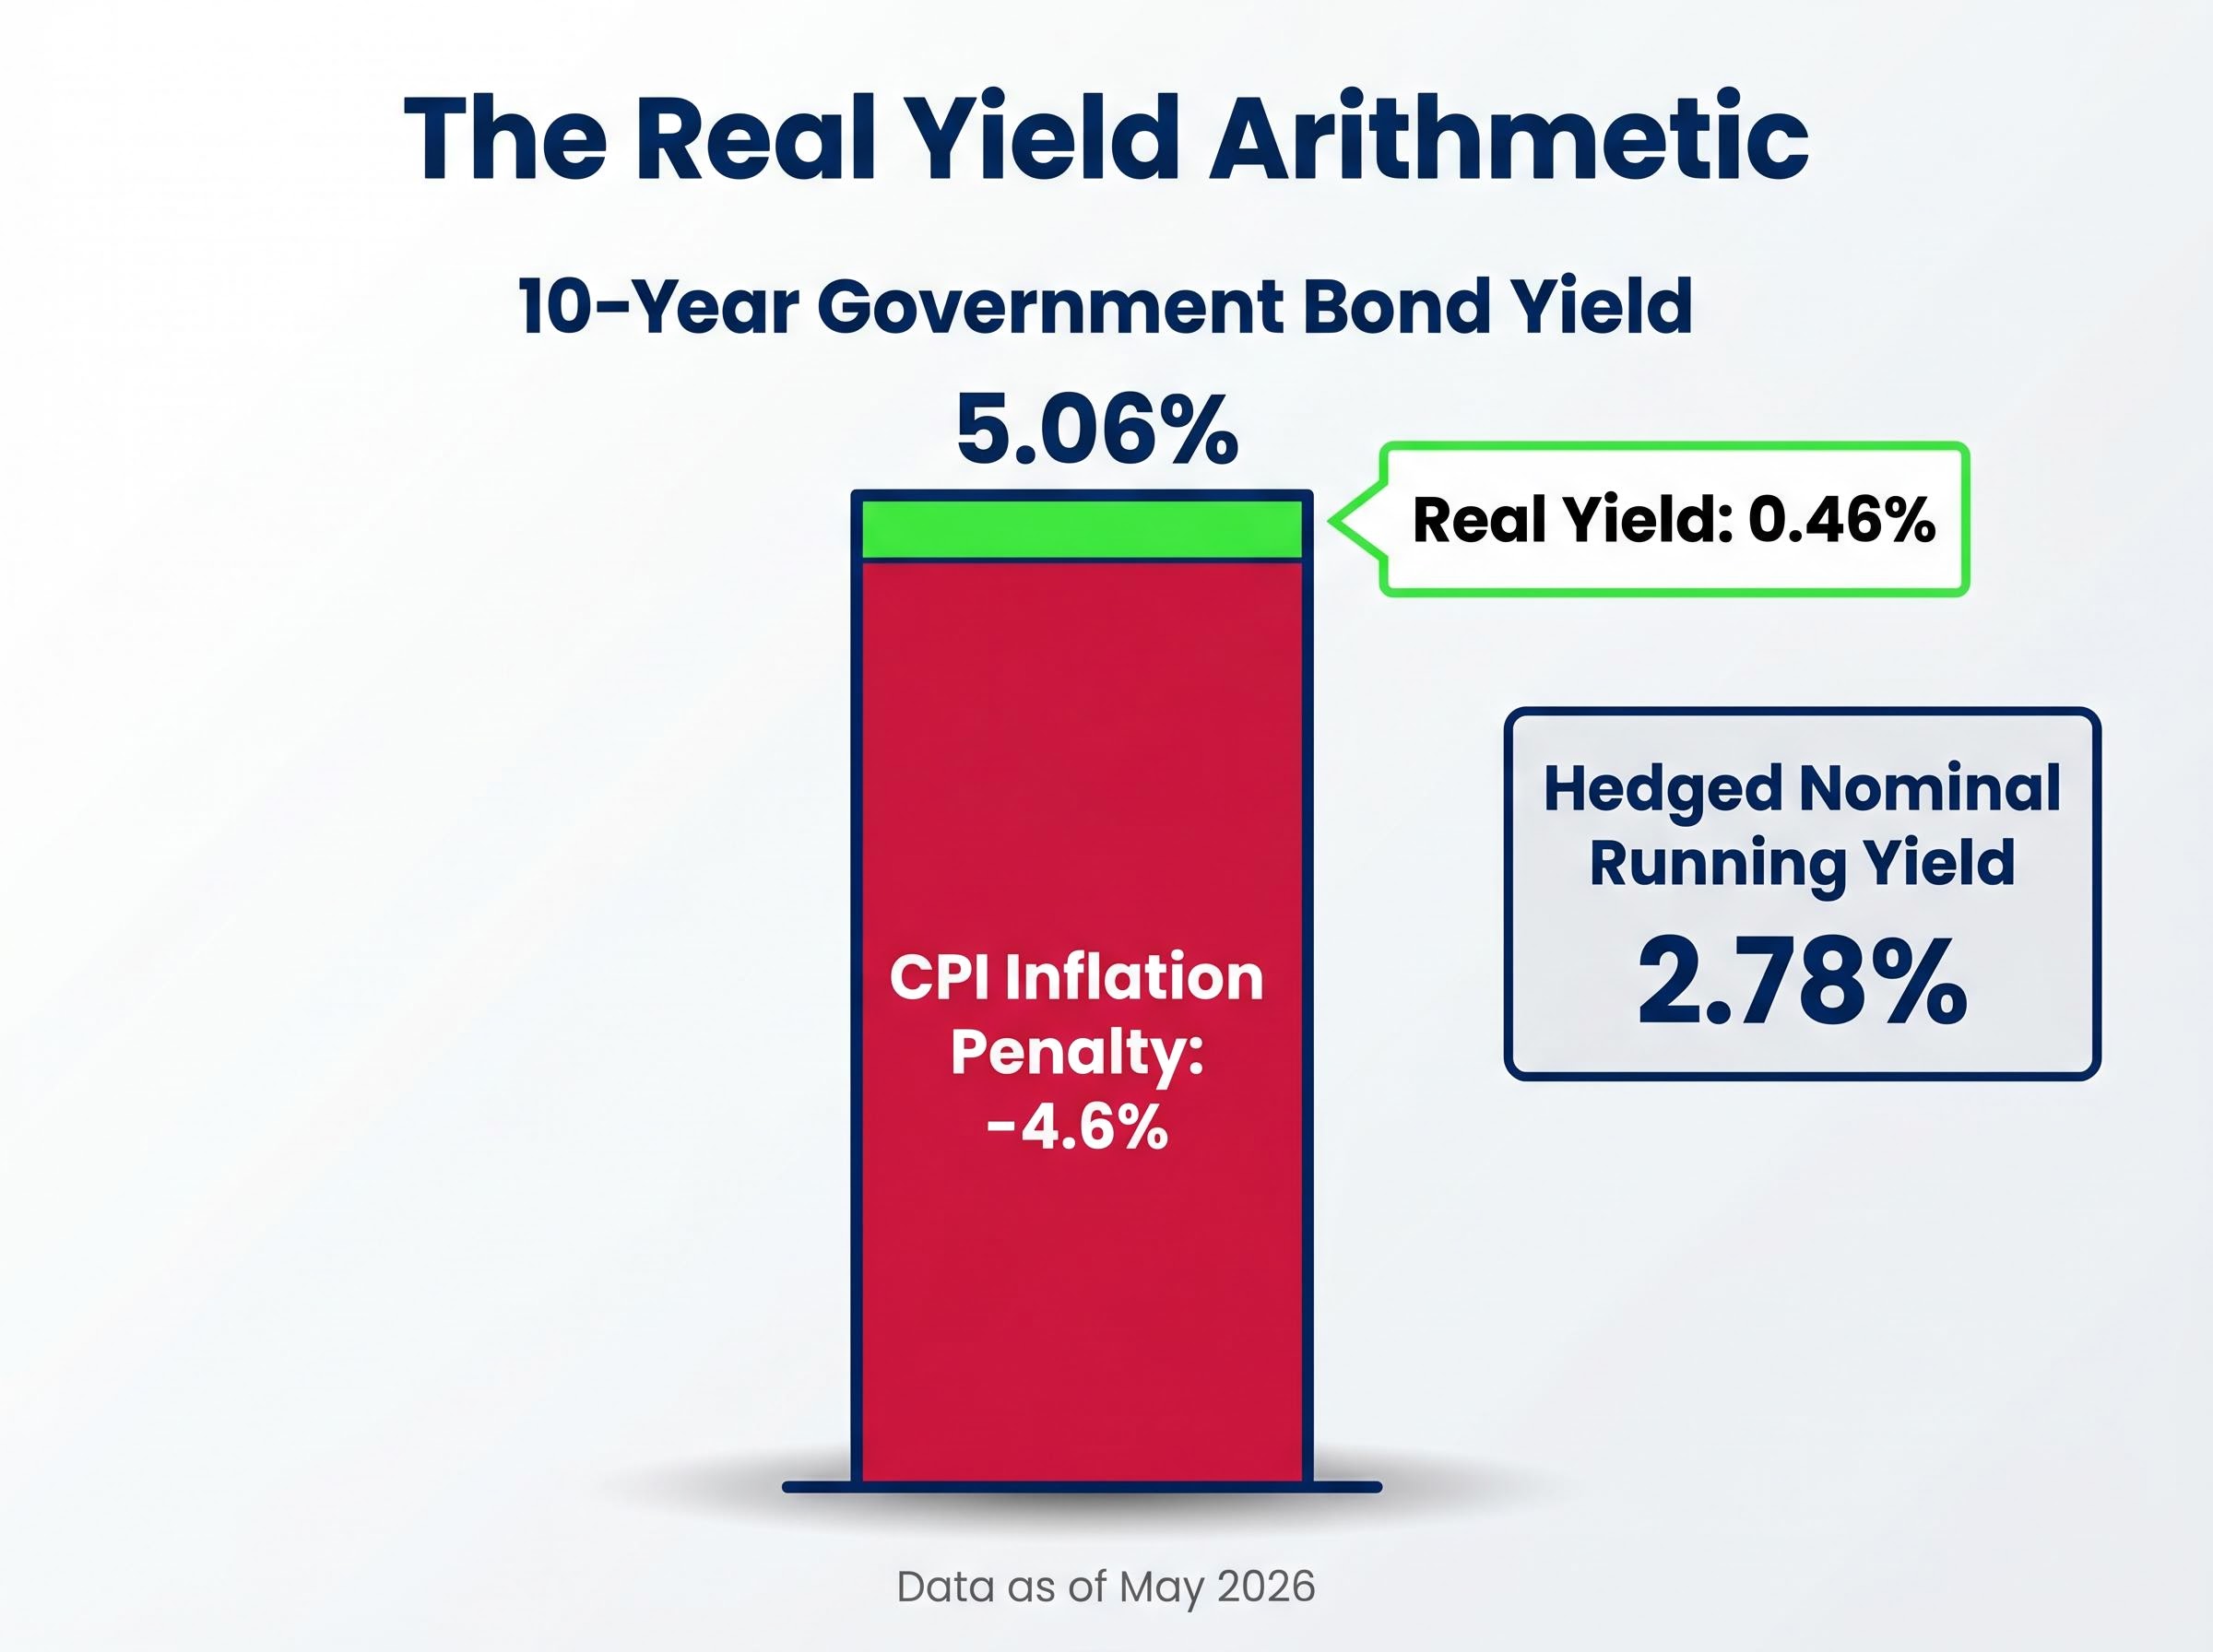
The real margin in context: A 5.06% 10-year nominal yield against 4.6% CPI leaves investors with less than 0.5% in real terms, and that margin narrows further if inflation surprises to the upside.
ASX: ILB (BlackRock Australian Government Inflation-Linked Bond ETF) is the primary vehicle for this thesis. Investors should verify current running yields directly via the ETF provider before making allocation decisions, given the pace of macro developments in 2026.
The limitation is worth noting: ILBs have lower liquidity than nominal government bonds, and the advantage is sensitive to the inflation trajectory. A rapid downside inflation surprise, such as a geopolitical de-escalation cutting energy costs sharply, would erode the ILB advantage quickly by reducing the CPI indexation that drives the return premium.
What Australian investors face for the rest of 2026
The sector-by-sector views presented in this guide converge on a coherent portfolio posture: hard assets and inflation-linked bonds form the structural core of an inflation-resilient allocation; banks are a selectively held position where the NIM tailwind must be weighed against credit quality risk; REITs belong only where balance sheet quality is high; and nominal bonds represent the weakest structural position in the current environment.
The May 12 Federal Budget, delivered by Treasurer Jim Chalmers in the first Albanese government budget since the May 2025 election, introduces a near-term variable. An expansionary fiscal outcome would add inflationary pressure and raise the probability of a further RBA hike to 4.60%. A more restrained fiscal posture would give the RBA room to pause, potentially extending the window before the fourth hike arrives.
| ETF code | Sector / asset class | Provider | Key risk in current environment |
|---|---|---|---|
| MVB | ASX banks (Big Four) | VanEck | Credit quality deterioration; NIM expansion exhausted |
| QFN | Broad financials (banks + insurers) | BetaShares | Mortgage stress; sector concentration |
| VAP | A-REITs (broad index) | Vanguard | Leveraged names; refinancing cost pressure |
| QRE | Resources and mining equities | BetaShares | Global growth slowdown; geopolitical resolution |
| OZR | ASX 200 Resources | State Street (SPDR) | Commodity price reversal; demand weakness |
| QAU | Gold bullion (AUD hedged) | BetaShares | Real rate rise if inflation falls sharply |
| GHLD | Gold bullion (AUD hedged) | Global X | Real rate rise if inflation falls sharply |
| ILB | Inflation-linked government bonds | BlackRock | Downside CPI surprise; lower liquidity vs nominals |
Before making allocation changes, investors should verify current ETF running yields and total return data directly via the respective ETF providers: BetaShares, VanEck, Vanguard, BlackRock, State Street, and Global X. The pace of macro developments in 2026 means published figures may shift between the time of reading and the time of execution.
Key dates and data that could shift the outlook before year-end
The following dates represent the sequenced decision points that will shape the RBA’s direction and, by extension, the relative attractiveness of each sector position:
- 12 May 2026 (Federal Budget): Does the fiscal stance add to inflationary pressure, or does restraint give the RBA room to pause?
- Late May 2026 (CPI data): Is underlying inflation accelerating toward the RBA’s projected 4.8% peak, or plateauing earlier than expected?
- 21 May and 25 June 2026 (labour market reports): Is the employment buffer narrowing, and are wages growth figures reinforcing the inflationary cycle?
- September or October 2026 (RBA meeting): Does the fourth hike to 4.60% arrive, or has the data provided enough evidence for the Board to hold?
Each data release answers a specific question. Together, they will determine whether the inflation-resilient posture outlined in this guide needs to be maintained, extended, or unwound.
Investors ready to translate this sector-by-sector framework into a complete portfolio construction, including specific allocation weights, fixed income yield comparisons, and the role of global equity ETFs as a complement to domestic inflation tilts, will find our comprehensive walkthrough of inflation-beating ASX ETF portfolios covers the mechanics of building a six-fund structure designed to preserve purchasing power across the 2026-2027 inflation window.
This article is for informational purposes only and should not be considered financial advice. Investors should conduct their own research and consult with financial professionals before making investment decisions. Past performance does not guarantee future results. Financial projections are subject to market conditions and various risk factors.