KOSPI Drops 10% as Crowded AI Trade Unwinds Across Global Markets
8 hrs ago

A hypothetical $10,000 invested in Australian shares in 1996 would have grown to a substantially larger sum than the same amount left in cash over 25 years. But the journey would have tested every instinct to sell, switch, and retreat to safety. That gap between what an investor feels during a drawdown and what the portfolio actually delivers over decades sits at the heart of the relationship between investment risk and return.
With Australian interest rates elevated and cost-of-living pressure acute in 2026, many investors are defaulting to cash and term deposits. The instinct is understandable. The long-term cost, however, is not always visible. What follows draws on 25 years of verified Australian asset class data to show how volatility and return are connected, why time horizon changes the calculus, and what personal factors should shape every individual’s position on the risk spectrum.
Investment risk, in its simplest form, is the possibility that unforeseen events negatively affect an asset’s performance. It exists in a direct trade-off with potential return: the more an asset can lose in a bad year, the more it has historically gained over a full cycle.
Cash and term deposits sit at the lowest end of that spectrum. Volatility is minimal. But over the 20-year period measured in the research, cash failed to keep pace with inflation, meaning its holders experienced a near-certain erosion of purchasing power. Reduced risk, in this context, did not mean safety from loss. It meant a different kind of loss: a quiet, compounding one.
For readers who want to understand the mechanics in more depth before working through the asset class data, our full explainer on inflation and purchasing power erosion covers how central banks respond to rising prices, why the 2026 structural environment differs from historical precedents, and how the erosion compounds silently across different asset types.
Choosing low-risk assets is not choosing no risk. It is choosing a different kind of risk: the near-certain erosion of purchasing power over time.
The four major asset classes sit along this spectrum from lowest to highest risk and return:
Understanding this spectrum is where every informed investment decision begins.
Cash, bonds, property, and shares each carry distinct risk and return characteristics, but they are best understood as points along a continuum rather than four separate choices. Volatility, the range between an asset’s highest peaks and lowest troughs in performance over a given period, increases as investors move from cash toward shares. So does the historical reward.
| Asset Class | Risk Level | Return Potential | Volatility Characteristics |
|---|---|---|---|
| Cash / Term Deposits | Lowest | Lowest | Minimal price movement; returns bounded by prevailing interest rates |
| Bonds | Moderate-low | Moderate-low | Yield-sensitive; capital value moves inversely with interest rates |
| Property | Moderate-high | Moderate-high | Smoother long-term path than shares; subject to economic and supply cycles |
| Shares | Highest | Highest | Widest peak-to-trough range; exposed to sentiment, economic data, and global flows |
Bonds and cash preserve capital with greater certainty, but they face a structural ceiling: returns are typically bounded by prevailing interest rates and inflation. Australian government bond yields as of July 2025 illustrate the current income potential: the 3-year yield sat at 3.459%, the 10-year at 4.367%, and the 30-year at 5.044%.
Elevated bond yields in 2025-2026 have improved the income case for fixed income. The Bloomberg AusBond Composite index returned 4.09% over one year and 5.71% annualised over 10 years as of September 2025. These are positive figures, but over the longer term, bonds’ return ceiling remains below that of growth assets. Shares and property sit at the higher end of the spectrum precisely because they are subject to more variables: economic cycles, interest rate shifts, investor sentiment, and supply-demand dynamics. Over long periods, those same forces have historically worked in favour of patient holders.
The most concrete way to understand the risk-return relationship is to track what actually happened. Research sourced from Reuters, the Real Estate Institute of Australia, CoreLogic, and IRESS modelled a hypothetical $10,000 invested across each of the four asset classes from 1996 to 30 June 2022.
The differences compound over decades. Residential property delivered a 9.16% annualised return over 20 years with a relatively smooth volatility path. Australian shares, measured by the ASX 200, returned 7.55% annualised over the same period, with significantly wider peak-to-trough swings along the way. Bonds delivered approximately 4.24% annualised over the 20-year pre-inflation-shock period, and cash failed to keep pace with inflation over extended horizons.
Negative real returns on cash are not a theoretical outcome in 2026: Australia’s headline CPI reached 4.6% for the 12 months to March 2026, compared with a RBA cash rate of 4.10%, meaning passive cash holders are experiencing a documented and measurable purchasing power decline in real time.
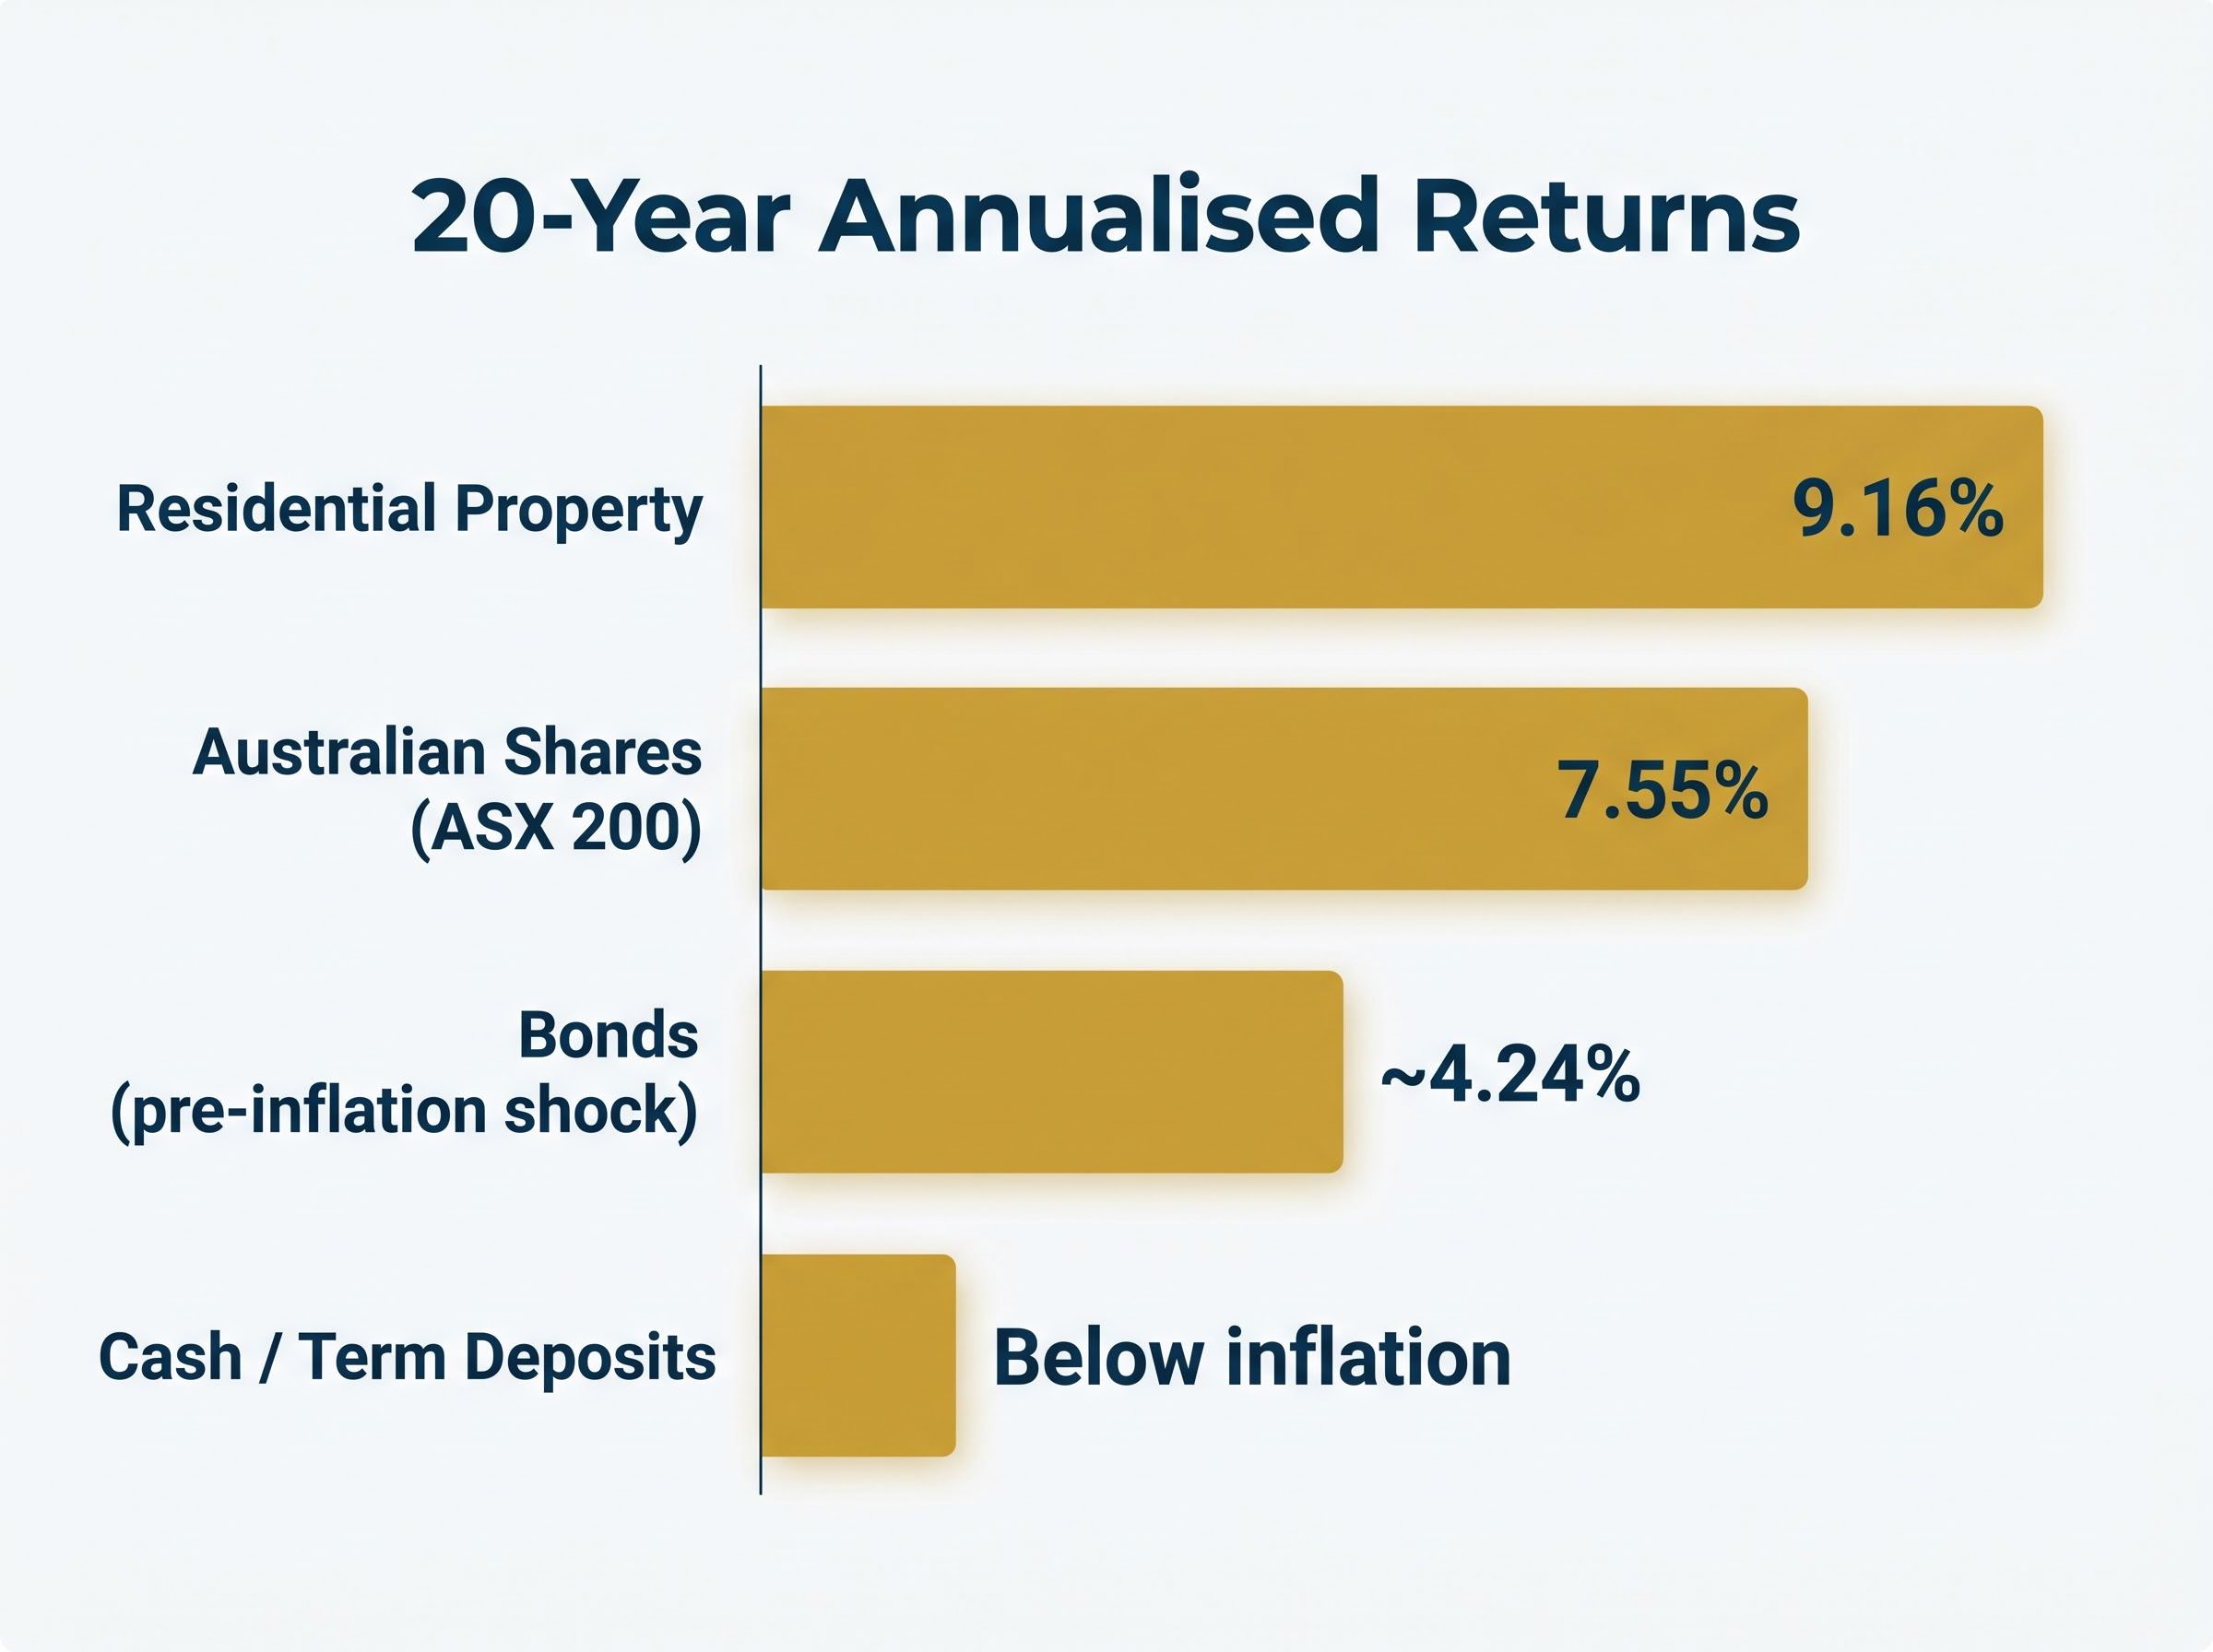
National median house prices rose 412% over 25 years, equivalent to 6.8% per annum. Units delivered 316% growth, or 5.9% per annum, over the same period.
| Asset Class | 20-Year Annualised Return | Volatility Profile | 25-Year Property Growth |
|---|---|---|---|
| Residential Property | 9.16% | Relatively smooth path | Houses +412% (6.8% pa); Units +316% (5.9% pa) |
| Australian Shares (ASX 200) | 7.55% | Higher volatility | N/A |
| Bonds (pre-inflation shock) | ~4.24% | Lower volatility, yield-sensitive | N/A |
| Cash / Term Deposits | Below inflation | Minimal volatility, negative real return | N/A |
Ranked by cumulative long-term return:
Vanguard’s asset class risk and return data for Australian investors shows long-term average annual returns across cash, fixed interest, property, and shares that reinforce the same directional relationship this article documents: each step up the risk spectrum has historically corresponded with a meaningful improvement in cumulative return over full market cycles.
One further data point adds context. The ASX 200 finished second-last among 24 major global stock indices in 2025, according to Livewire Markets. Australian equities delivered positive returns over the long term, but the recent underperformance relative to global peers reinforces the case for international diversification, particularly within superannuation portfolios.
The data above describes what each asset class returned over long periods. The question that matters for any individual investor is different: how long do I have?
Short-term volatility in growth assets (the wide swings that make shares and property feel dangerous in any given year) becomes progressively less meaningful as the investment horizon extends. Compounding accumulates. Temporary drawdowns are absorbed into the longer trend. A five-year investor and a 25-year investor in shares experience the same price movement in any given quarter, but the significance of that movement to their final outcome is entirely different.
Property’s smooth 9.16% per annum return over 20 years illustrates this directly. Holding through market cycles, tolerating moderate illiquidity, and allowing compounding to work produced a return that outpaced every other asset class. The cost was patience. The reward was cumulative.
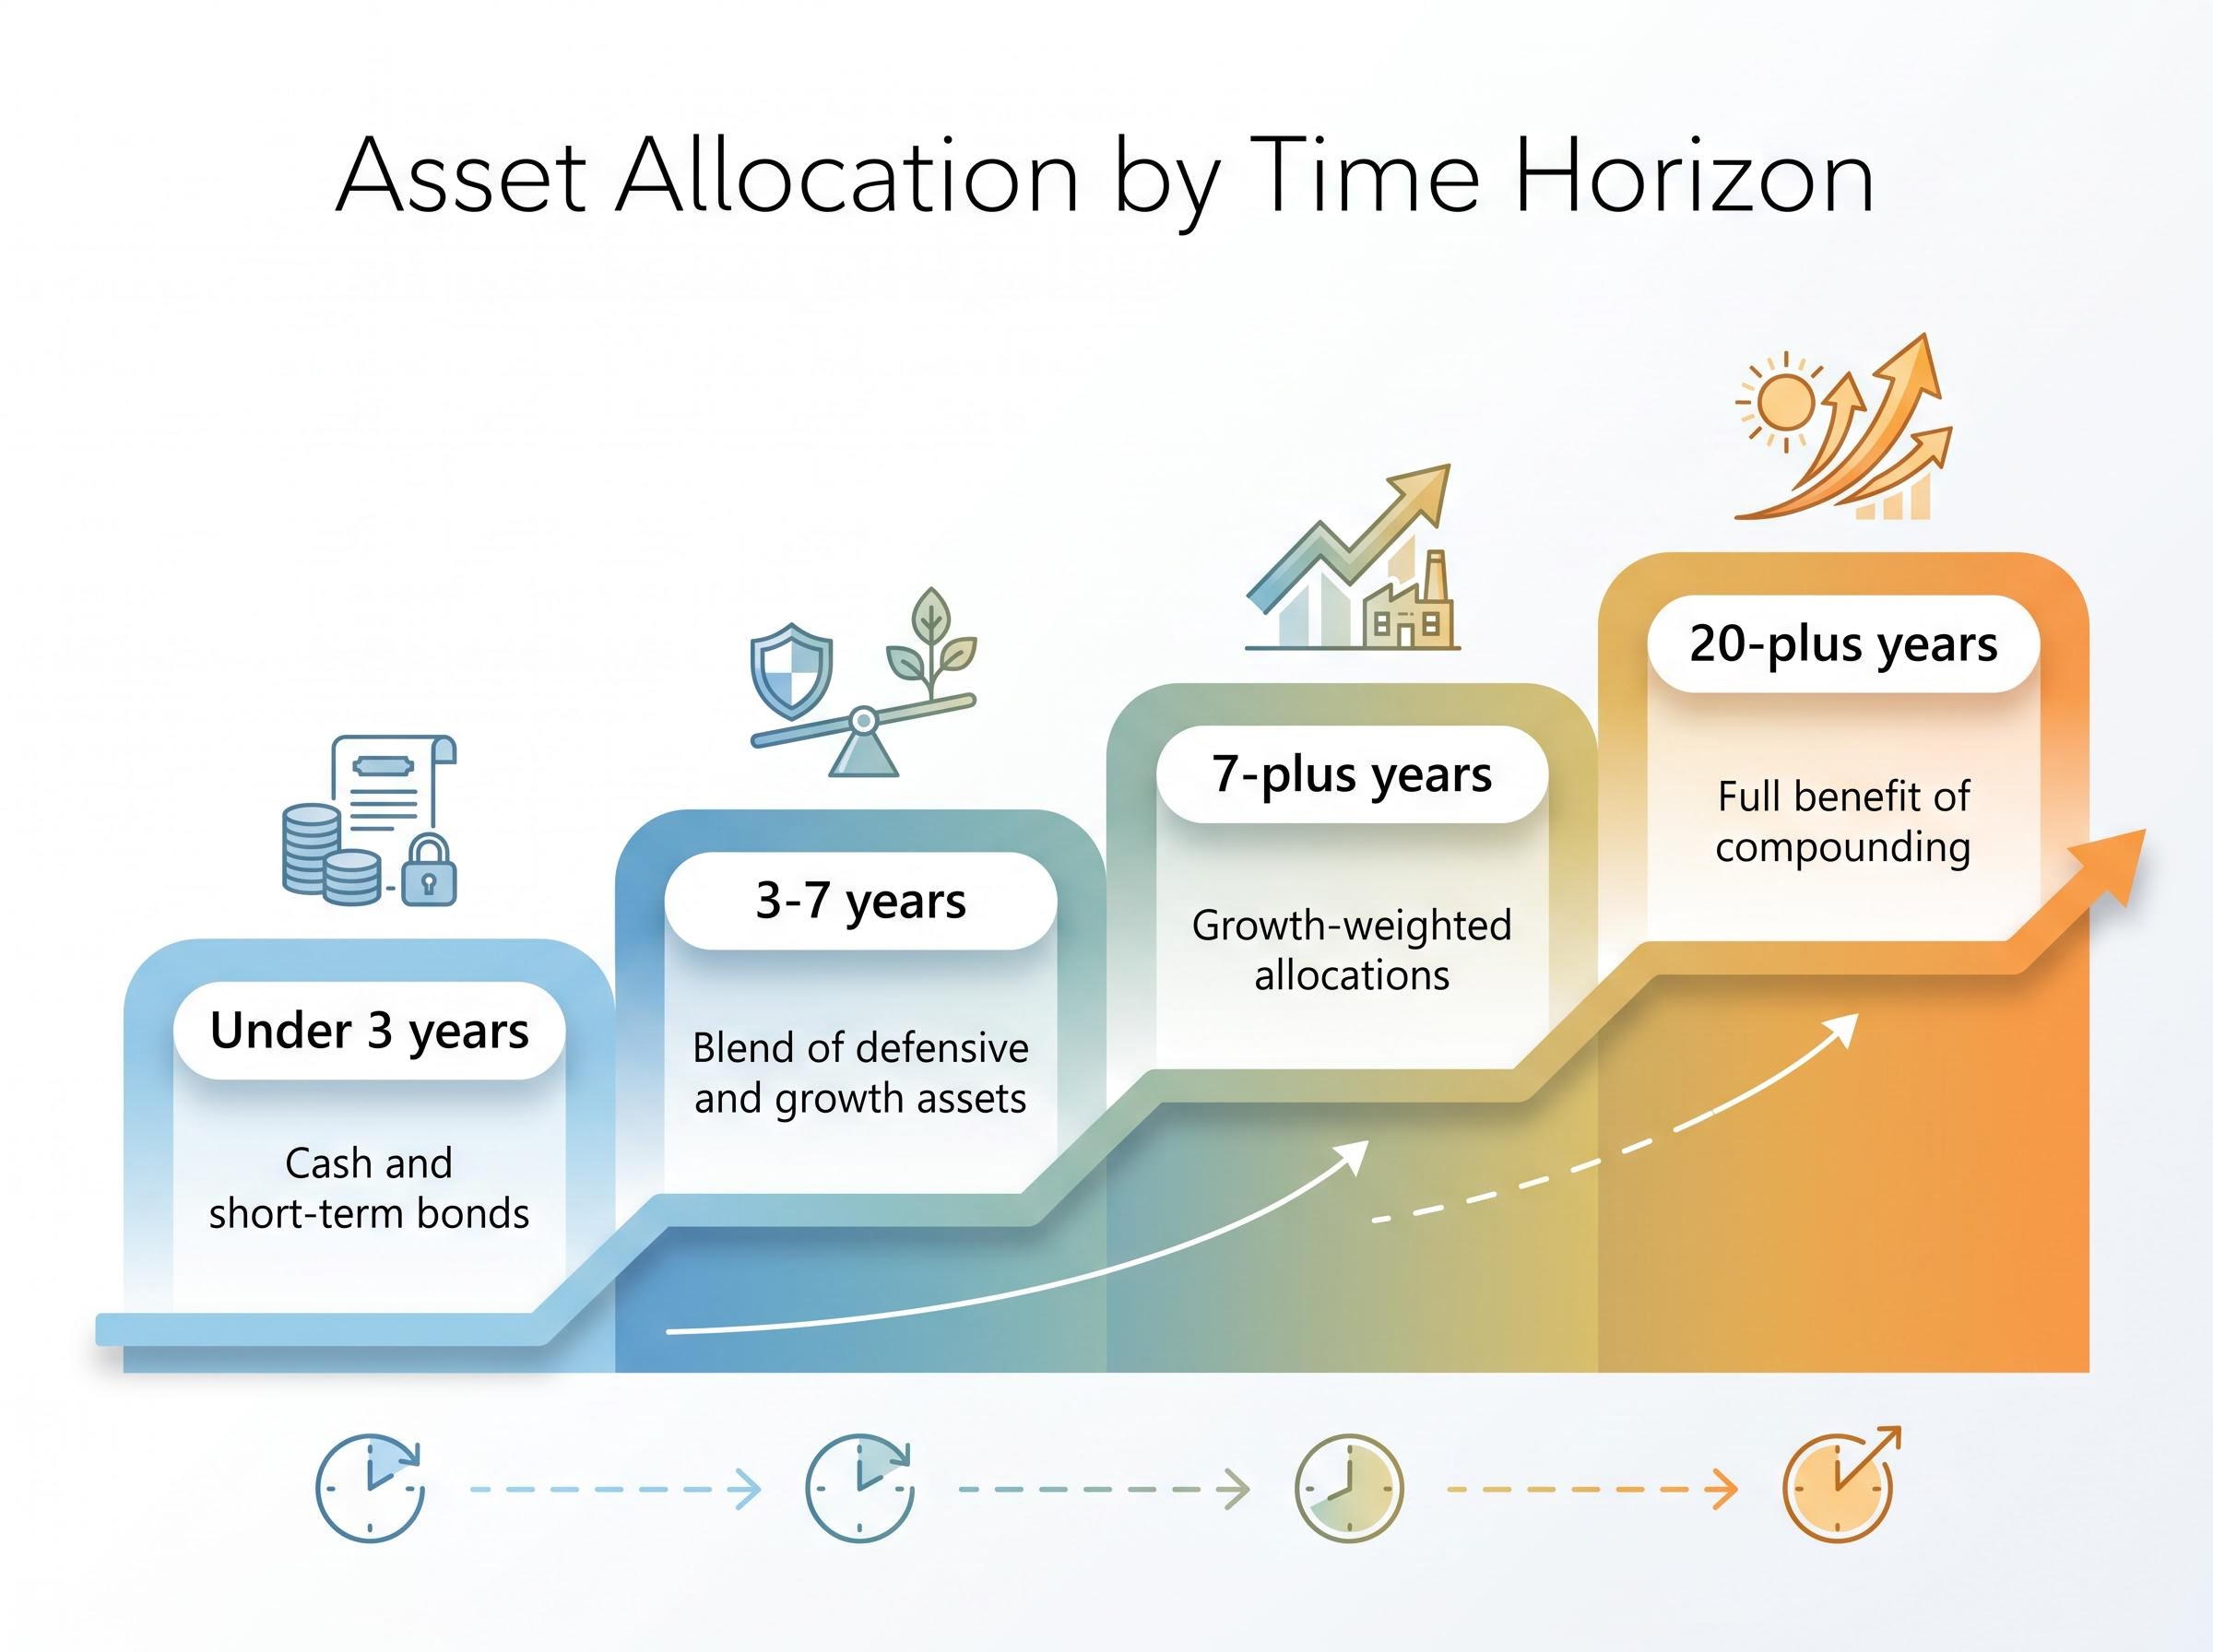
As a general framework, time horizon shapes which end of the spectrum is appropriate:
Compounding in growth assets means returns generate further returns. The effect accelerates over time: the first decade of investment growth is less powerful than the second and third, because each year’s return is applied to an ever-larger base. This is why short-term volatility has relatively limited impact on a 25-year investor’s outcome but can be disproportionately damaging for a 3-year investor whose portfolio has insufficient time to recover.
The behavioural risk sits here too. Rotating to cash or bonds at market lows locks in losses and removes the investor from the recovery. The compounding clock resets.
The strongest argument for long-term growth asset allocation is mathematical. The strongest argument against it is psychological. Volatility does not just move prices; it moves people.
Three behavioural patterns pose the greatest threat to long-term returns:
Home-country bias among Australian retail investors has historically meant portfolios concentrated heavily in ASX-listed equities, but Q1 2026 data shows a structural inflection: international ETFs overtook domestic funds as the most purchased ETF category on major platforms for the first time on record, suggesting the cost of that concentration is increasingly visible to investors themselves.
A Livewire Markets poll of more than 1,500 readers found that engaged Australian investors correctly anticipated cash and bonds would lag inflation. The broader retail tendency toward perceived safety in low-risk assets, however, remains a documented pattern.
The largest cost of volatility is often not the market movement itself but the investor’s response to it.
Research from multiple Australian market commentators points to the same practical response: tolerate short-term volatility in growth assets rather than rotating to cash at market lows, and diversify beyond the ASX into global equities to reduce portfolio-level volatility while accessing broader return sources.
Twenty-five years of data tells a clear story about asset classes in aggregate. What that story means for any individual depends on three variables:
Past performance does not guarantee future results. Asset performance fluctuates over time and is influenced by multiple factors, including economic conditions, policy changes, and global events. No historical data constitutes a guarantee of future returns.
Superannuation’s long accumulation horizon, often 20-40 years for younger investors, typically aligns with the higher-risk, higher-return end of the spectrum. Growth asset weightings in most accumulation-phase super funds reflect this alignment.
For those approaching or in retirement, the calculation shifts. The post-COVID recovery in bond yields has improved the income case for fixed income within balanced fund allocations, making asset class mix a live and ongoing conversation between members and their advisers.
Independent financial and tax advice is recommended before acting on any general investment information. The four asset classes described in this article are tools, not prescriptions, and each is suited to different circumstances.
For investors ready to translate the risk-return framework into a concrete allocation structure, our dedicated guide to structuring a portfolio for volatile ASX markets covers a three-layer cash, income, and growth approach, examines how the bond-equity hedge breaks down during supply shocks, and explains how dollar-cost averaging and tax-loss harvesting turn volatility into a structural advantage.
Over 25 years, higher-volatility assets delivered materially superior cumulative returns for Australian investors. Time horizon proved to be the primary variable determining whether an individual could benefit from that relationship. The pattern holds at the aggregate level, but individual outcomes vary.
Readers who have absorbed this data are better positioned to have an informed conversation with a financial adviser about their own risk profile, time horizon, and return requirements. The numbers identify the trade-offs. Personal circumstances determine which trade-offs are appropriate.
This article is for informational purposes only and should not be considered financial advice. Investors should conduct their own research and consult with financial professionals before making investment decisions.
Investment risk and return share a direct trade-off: the more an asset can lose in a bad year, the more it has historically gained over a full market cycle. Cash carries the lowest risk but also delivers the lowest return, while shares carry the highest risk and the highest long-term return potential.
Australian shares (ASX 200) returned 7.55% annualised over 20 years, while cash failed to keep pace with inflation over the same period, meaning cash holders experienced a negative real return. A $10,000 investment in shares in 1996 would have grown substantially more than the same amount held in cash.
Cash carries minimal price volatility, but in 2026 it is delivering a negative real return: Australia's headline CPI reached 4.6% for the 12 months to March 2026, while the RBA cash rate sits at 4.10%, meaning passive cash holders are losing purchasing power in real terms.
Historically, a horizon of seven or more years allows growth assets like shares and property enough time to absorb drawdowns and benefit from compounding; for horizons under three years, capital preservation assets such as cash and short-term bonds are generally more appropriate.
Home-country bias is the tendency to concentrate investments in domestic equities rather than diversifying globally. For Australian investors, heavy ASX concentration has been costly: the ASX 200 finished second-last among 24 major global stock indices in 2025, and Q1 2026 data shows international ETFs overtook domestic funds as the most purchased ETF category for the first time on record.