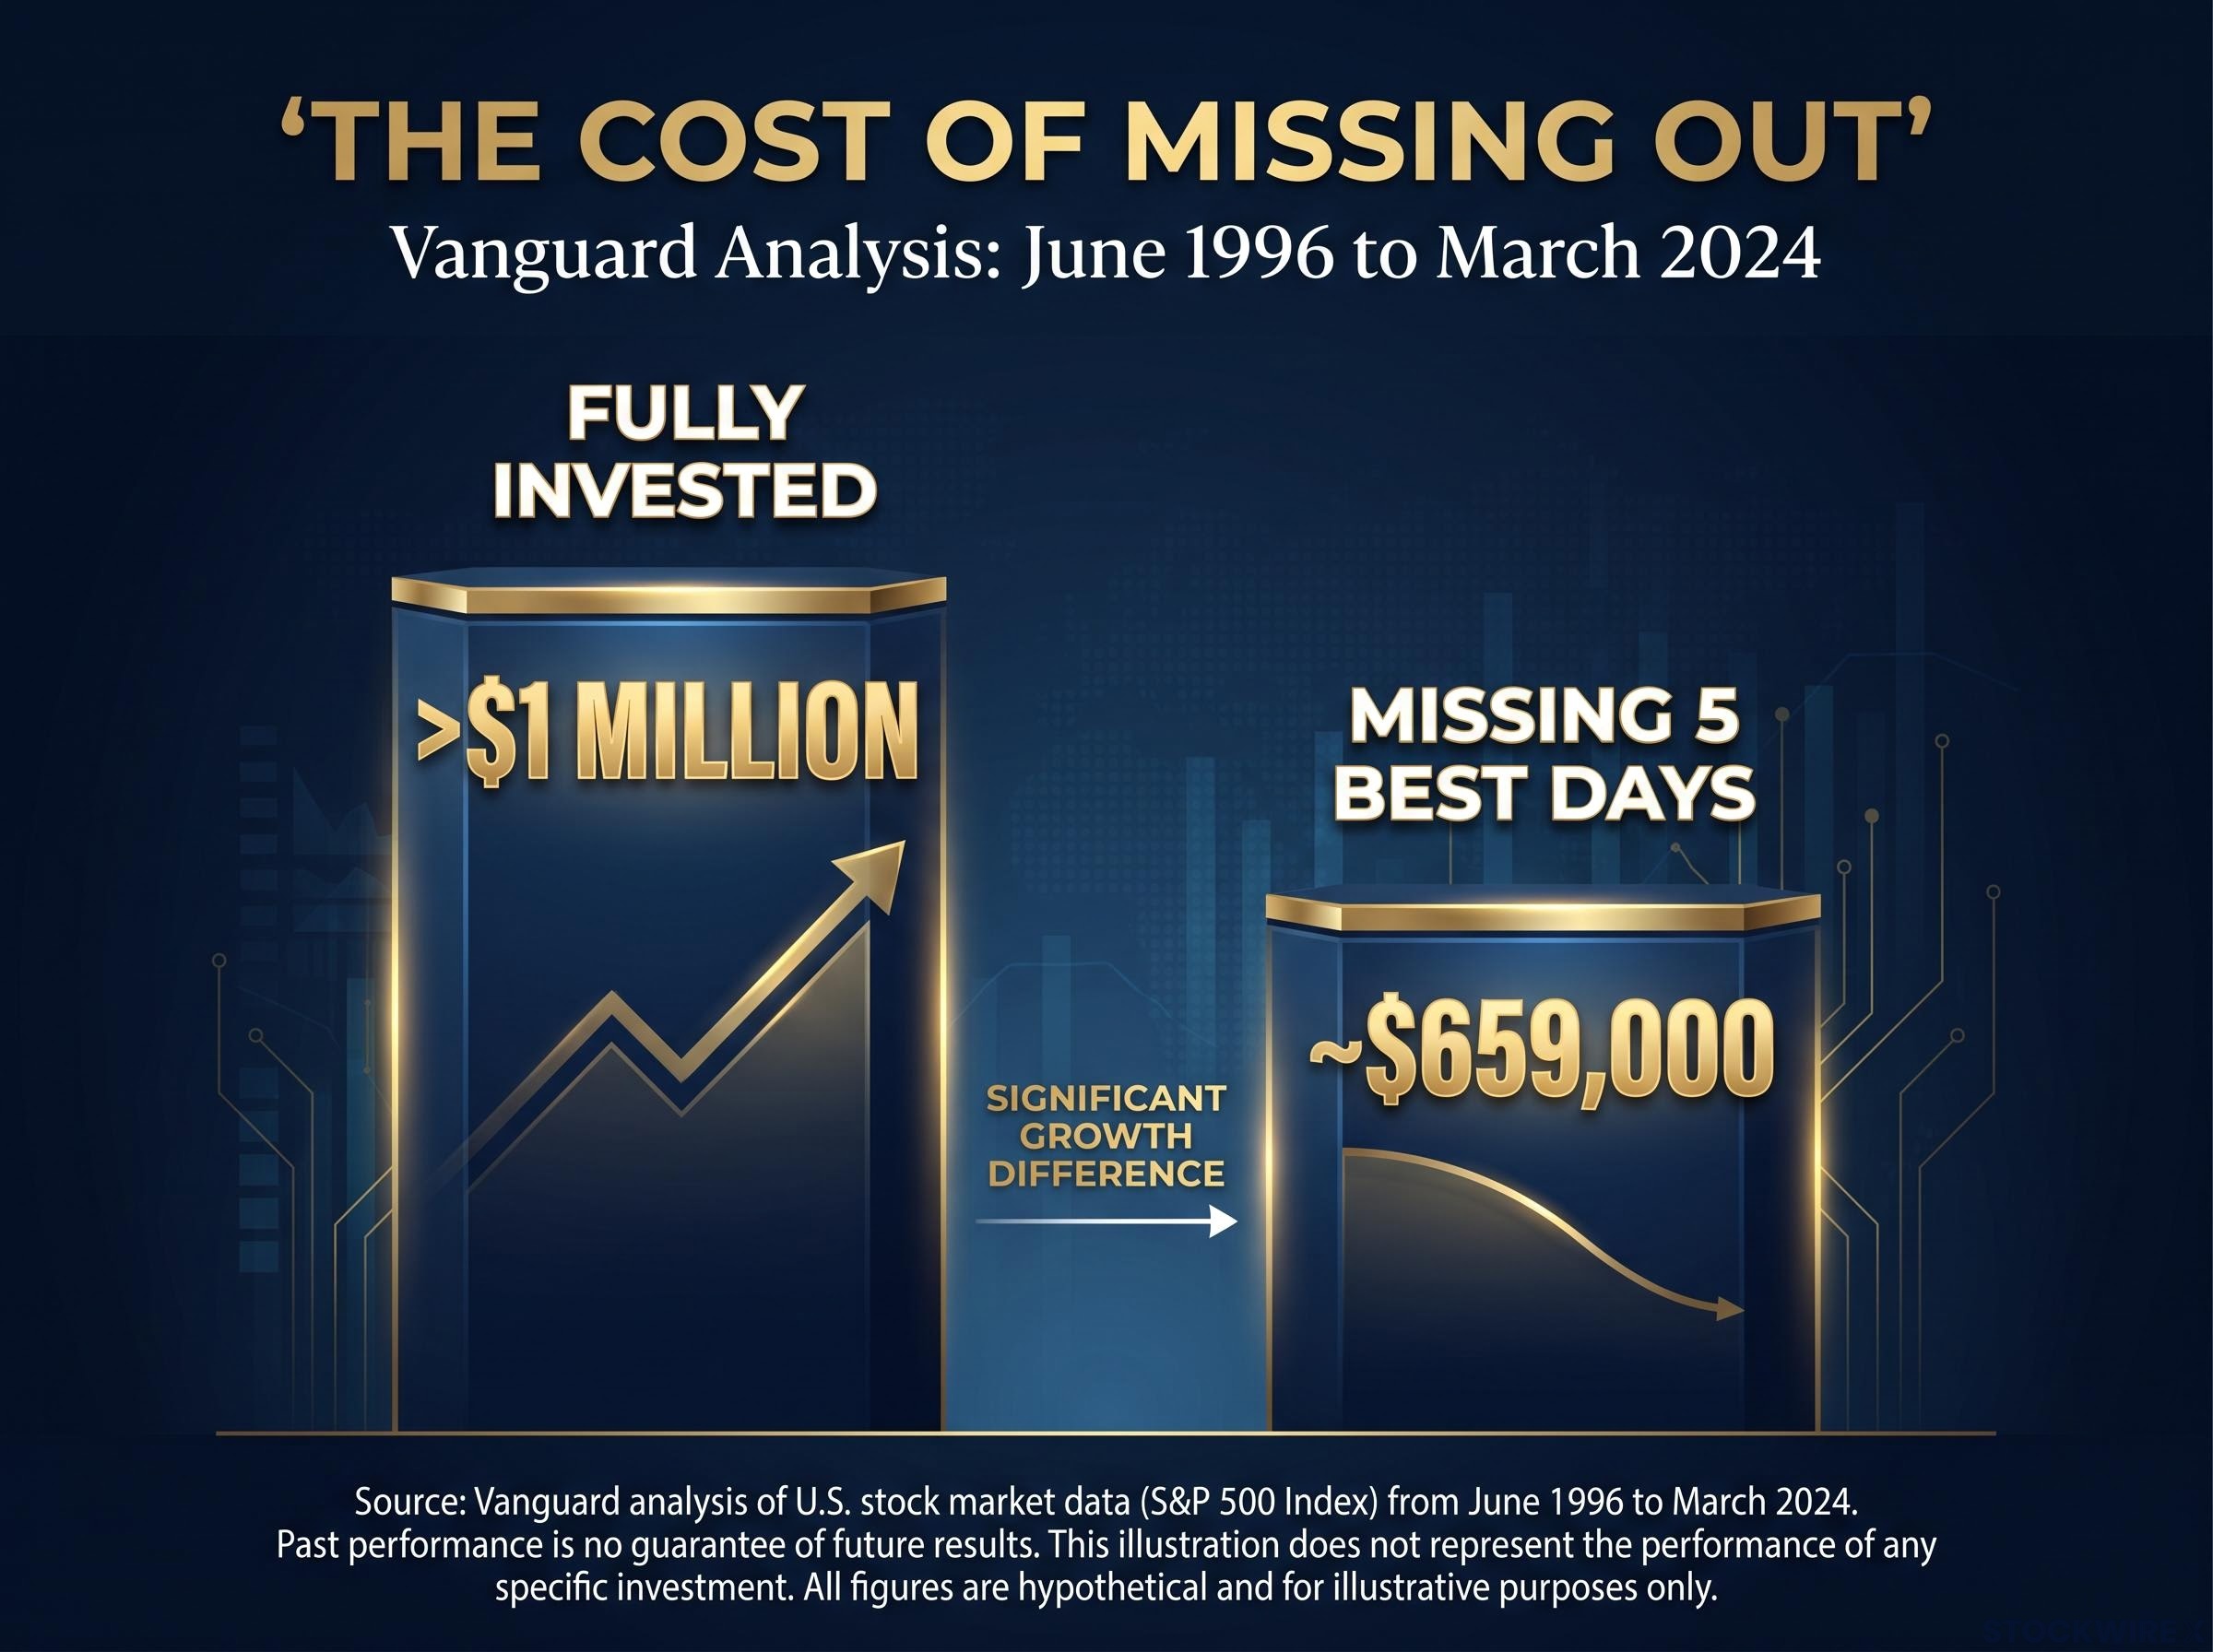
Most people picture wealth-building as a screen full of tickers and a finger hovering over the sell button. The data says the opposite. According to Vanguard analysis, an investor who stayed fully invested from June 1996 to March 2024 turned continuous exposure into over $1 million, but missing just the five best trading days over that window would have cut the result to roughly $659,000.
If you have a career, a family, and a limited number of hours in the day, that number should reframe how you think about your own busyness. The time you cannot spend watching markets is not a handicap. It is a structural advantage that keeps you out of the trades that quietly erode returns.
Long-term investing is not a passive concession you make because you lack the time to do better. It is an active strategic choice with a documented track record. Here is the framework for how busy investors build serious wealth, what the underlying mechanics actually look like in practice, and where the genuine risks sit that most guides skip past.
Why disciplined investors consistently outperform the traders trying to beat them
The gap between what markets return and what active investors actually earn is not a one-off statistic. It shows up across independent data sources, year after year, which is what makes it worth your attention.
Start with DALBAR’s 2024 Quantitative Analysis of Investor Behavior. It found the average equity investor earned 16.54% in 2024, while the S&P 500 returned 25.02%. That is an 8.48 percentage point gap, which DALBAR described as the second-largest of the past decade. In 2023, the same research reported a 5.5 percentage point shortfall for retail fund investors.
Morningstar’s “Mind the Gap” research tells the same story over a longer window. Over the 10 years ending December 2024, US fund and ETF investors earned about 7.0% annualised, versus 8.2% for the funds they were invested in.
That 1.2 percentage point annual gap sounds small until you compound it. Morningstar estimates it meant investors missed roughly 15% of total fund returns, purely through mistimed buying and selling.
| Data Source | Active/Retail Return | Benchmark Return | Gap |
|---|---|---|---|
| DALBAR 2024 (annual) | 16.54% | 25.02% | 8.48 pts |
| Morningstar (10-yr annualised) | 7.0% | 8.2% | 1.2 pts |
| Active funds beating passive (10-yr) | 7% survived and won | Passive average | 93% shortfall |
Even the professionals struggle with this. Morningstar’s US Active/Passive Barometer found that over the decade through December 2024, only 7% of US active funds both survived and beat their average passive rival. Among the cheapest active funds, 28% beat passive peers; among the most expensive, just 17% did.
Missing only the five best trading days between June 1996 and March 2024 dropped an investor’s ending wealth from over $1 million to roughly $659,000, according to Vanguard. The best days tend to cluster near the worst ones, so trying to dodge the drops usually means missing the recoveries too.
The cost of market timing goes beyond the days you miss: a $100,000 investment held continuously for the decade ending 2020 grew to roughly $272,000, but missing just 10 of the best trading days dropped the result to $153,000, a shortfall that erases more than the original investment’s value in compounded gains.
What these figures tell you is direct. The distance between what you could earn and what active trading typically delivers is not a rounding error. It is the difference between a comfortable retirement and a compromised one, which makes your instinct to step back and hold look less like laziness and more like an edge.
When big ASX news breaks, our subscribers know first
What actually builds wealth over time: compounding, dividends, and the mathematics of staying in
You have heard that compounding builds wealth. The abstract idea is familiar. The scale of the actual difference is where most people underestimate it.
Three levers do the work over a full market cycle:
- Market appreciation as quality businesses grow their earnings over years.
- Dividend reinvestment buying more shares that themselves pay dividends.
- Time in the market rather than attempts to time it.
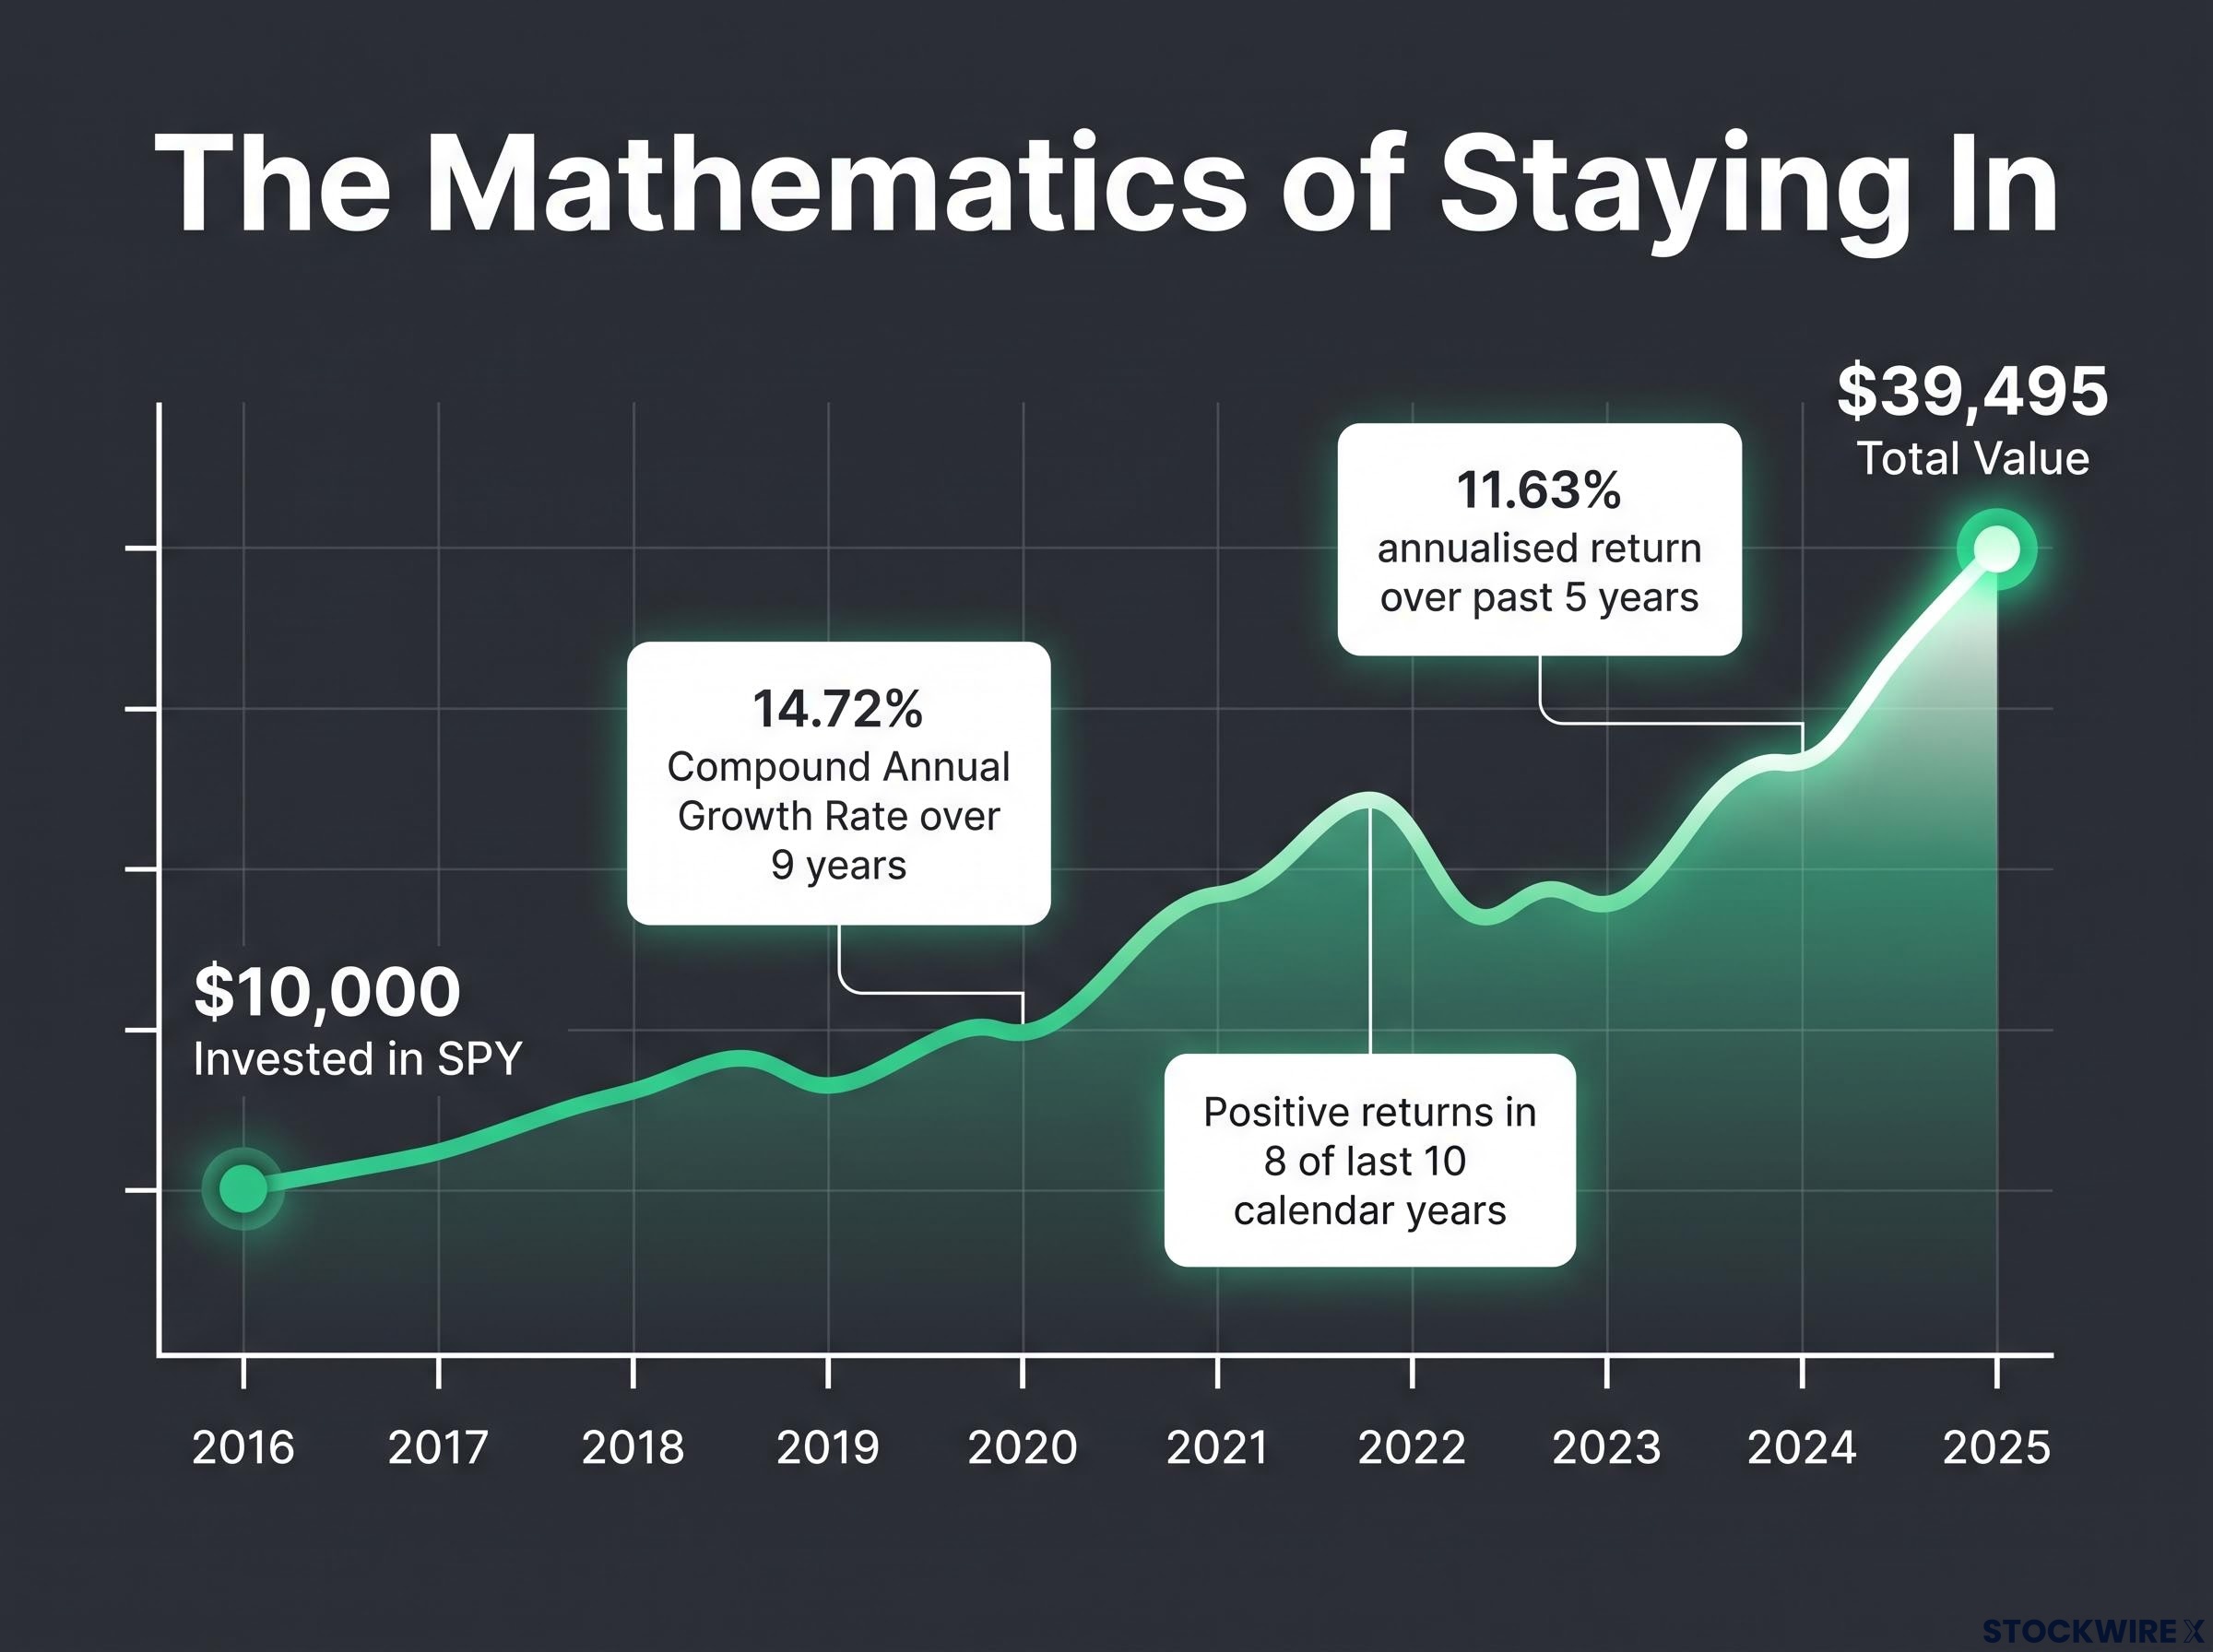
Consider a broad market ETF as a real reference point. According to a 2026 review, $10,000 invested in the SPDR S&P 500 ETF (SPY) in 2016 grew to $39,495 by 2025. That works out to a 14.72% compound annual growth rate over nine years, with positive returns in 8 of the last 10 calendar years and an 11.63% annualised return over the past five.
The Vanguard Total Stock Market ETF (VTI), launched in 2001, has delivered an average annual return of about 8.75%. These are not projections or promises. They are the historical record that a busy investor making regular contributions could have accumulated without making a single trading decision.
For long-run context, SoFi’s 2025 analysis puts the average nominal US stock market return at roughly 10%, with inflation-adjusted returns closer to 6-7%.
Dividends as a compounding engine, not an afterthought
Dividends are not a bonus sitting on top of your returns. They are a structural component of total return, and reinvesting them is what accelerates the compounding maths.
The mechanism is simple. Reinvested dividends buy additional shares, and those additional shares generate their own dividends, which buy still more shares. VTI’s trailing dividend yield of 1.1-1.2% may look modest, but reinvested over decades, that stream quietly enlarges your share count without any effort on your part.
For investors targeting durable payouts, Morningstar highlights established companies with economic moats, meaning a lasting competitive advantage that protects earnings. Its screening framework looks for at least 5% dividend-per-share growth over 10 years and yields of 4% or more.
Names that have appeared in Morningstar’s dividend screens include Procter & Gamble, Realty Income, and McDonald’s, across consumer staples, real estate investment trusts (REITs), and other defensive sectors. These are illustrations of the category, not recommendations. The point for you is the category logic: established payers with growing distributions are where reinvestment compounds most reliably.
Building a dividend portfolio around companies with economic moats and growing payout histories is where reinvestment compounds most reliably, with Hartford Funds data showing dividends contributed roughly 33% of the S&P 500’s total return from 1940 to 2025.
How a structured portfolio framework operates in practice
Long-term investing stops being an abstraction once you can picture the specific behaviours behind it. Discipline is not a mood. It is a system, and systems can be visualised and copied.
The Verified Investing “Million Dollar Long-Term Investor” programme offers a real-world illustration. Co-managed by Gareth Soloway and Lawton Ho, it is built around a standardised $1 million model portfolio aimed squarely at investors with careers and families who cannot watch markets all day. Members receive updates twice a week covering holdings, market conditions, and the rationale behind each decision, with full position transparency.
Four operational behaviours define how a structured portfolio runs:
- Incremental position building: scaling into positions in stages rather than committing all capital at once.
- Partial profit-taking: trimming winners while keeping a core holding intact.
- Defensive positioning: building lower-risk allocations during market weakness instead of panic-selling.
- Scheduled rebalancing: adjusting on a calendar, not on emotion.
Take incremental building. A Minervini-style approach uses three stages: a 25% probe to test the position, a 50% commitment on confirmation, and a 100% full allocation once conditions hold. It manages entry risk without forcing an all-or-nothing bet. Institutional models apply similar discipline: BlackRock’s strategic portfolios cap tactical deviations at a maximum of plus or minus 5% from their benchmark allocations.
On 5 August 2024, a day of significant market volatility, Vanguard’s Investor Pulse data showed 97.5% of its retail investors placed no trades at all. Among the 2.5% who did trade, net buyers of equities outnumbered sellers by more than 4-to-1.
That figure tells you something important. Disciplined investors are not passive by accident. They are passive by design, and it is the structural framework that makes inaction possible in exactly the moment your instinct screams at you to react.
What defensive positioning actually looks like
Defensive positioning is not the same as going to cash. It is a deliberate shift toward less-correlated or lower-volatility assets during periods of market weakness, so your portfolio bends without breaking.
For investors in or near retirement, the bucket approach complements this. You hold 1-2 years of expenses in cash and several more years in short-term bonds, so your equity holdings are never forced to sell at the bottom of a downturn.
The purpose is to manage sequence-of-returns risk, the danger that poor returns early in retirement do lasting damage. For anyone within five years of retiring, that structure is what keeps a bad market from becoming a permanent loss.
The real risks in a long-term portfolio strategy and how to manage them
A guide that only sells its own thesis is not worth trusting. Long-term and passive strategies carry genuine structural risks, and you are better served knowing them now than discovering them at the worst possible moment.
Four risks matter most:
- Sequence-of-returns risk: the first five years of retirement are widely considered the danger zone, where negative returns can permanently impair a portfolio.
- Market concentration: cap-weighted index funds have become increasingly concentrated in a handful of mega-cap technology companies, quietly raising your exposure to a single sector.
- Inflation erosion: AllianceBernstein projects an equilibrium US inflation rate of around 3% ten years forward, which means static 60/40 portfolios may under-protect your purchasing power.
- Behavioural pitfalls: performance chasing, panic selling, and over-trading remain portfolio risks equal to market risks.
Sequence of returns risk is the mechanism behind that danger: two portfolios beginning retirement with identical $1,000,000 balances and identical average returns can finish 30 years apart by nearly $10 million, determined entirely by whether the first five withdrawal years happened to produce negative or positive returns.
That last category is measurable. Morningstar found the investor return gap is widest in volatile niche sector funds and narrowest in broad, diversified allocation funds. The vehicle you choose shapes how much of your own behaviour works against you.
| Fund Type | Investor Return Gap | What It Signals |
|---|---|---|
| Broad allocation funds | ~0.4% | Least behavioural leakage |
| Average fund (all types) | 1.2% | Moderate mistiming cost |
| Volatile sector funds | 2.0-2.6% | Highest behavioural cost |
Knowing these risks does not weaken the case for long-term investing. It sharpens it. Once you can see where the genuine vulnerabilities sit, you can structure around them: diversifying beyond concentrated cap-weighted exposure, adding inflation-sensitive assets, and holding broad funds where your own behaviour costs you least.
Financial projections are subject to market conditions and various risk factors, and past performance does not guarantee future results.
Building a portfolio you can hold through a full market cycle
Everything above converts into a short list of decisions you can act on this week. The investors who match or beat active traders are not smarter. They have simply pre-committed to a structure and removed the moments where emotion makes the call.
Five structural habits do most of the work:
- Pre-commit to an allocation and hold it through scheduled rebalancing rather than emotional reactions.
- Automate contributions so you dollar-cost average without deciding when to buy.
- Reinvest dividends automatically so compounding runs in the background.
- Rebalance on a calendar schedule, not in response to headlines.
- Select broad, low-volatility vehicles, which Morningstar found suffer the smallest investor return gap at roughly 0.4%, versus 2.0-2.6% for volatile sector funds.
These habits are what let a busy investor match or exceed someone spending hours a day trading, without the time cost, the stress, or the behavioural traps. The evidence backs it up: during geopolitical shocks, Vanguard’s data shows disciplined investors were net equity buyers by nearly 4-to-1, rebalancing rather than fleeing.
For readers at the beginning of this journey, our dedicated guide to investing in index funds walks through opening a brokerage account, selecting a low-cost S&P 500 fund, and setting up dollar-cost averaging with a starting amount of $1,000.
A programme like Verified Investing’s model portfolio is one example of how professional structure and transparency can support that discipline for people who want accountability without daily monitoring.
Against a long-run US market return of roughly 10% nominal, patience is not a personality trait. It is a repeatable, learnable strategy with a documented historical basis.
Staying invested through June 1996 to March 2024 produced over $1 million. Missing just the five best days cut it to roughly $659,000. That gap is the entire argument for holding on.
This article is for informational purposes only and should not be considered financial advice. Investors should conduct their own research and consult with financial professionals before making investment decisions.