VGS Leads Vanguard ETF Pack With 14% FY26 Capital Return
10 mins ago
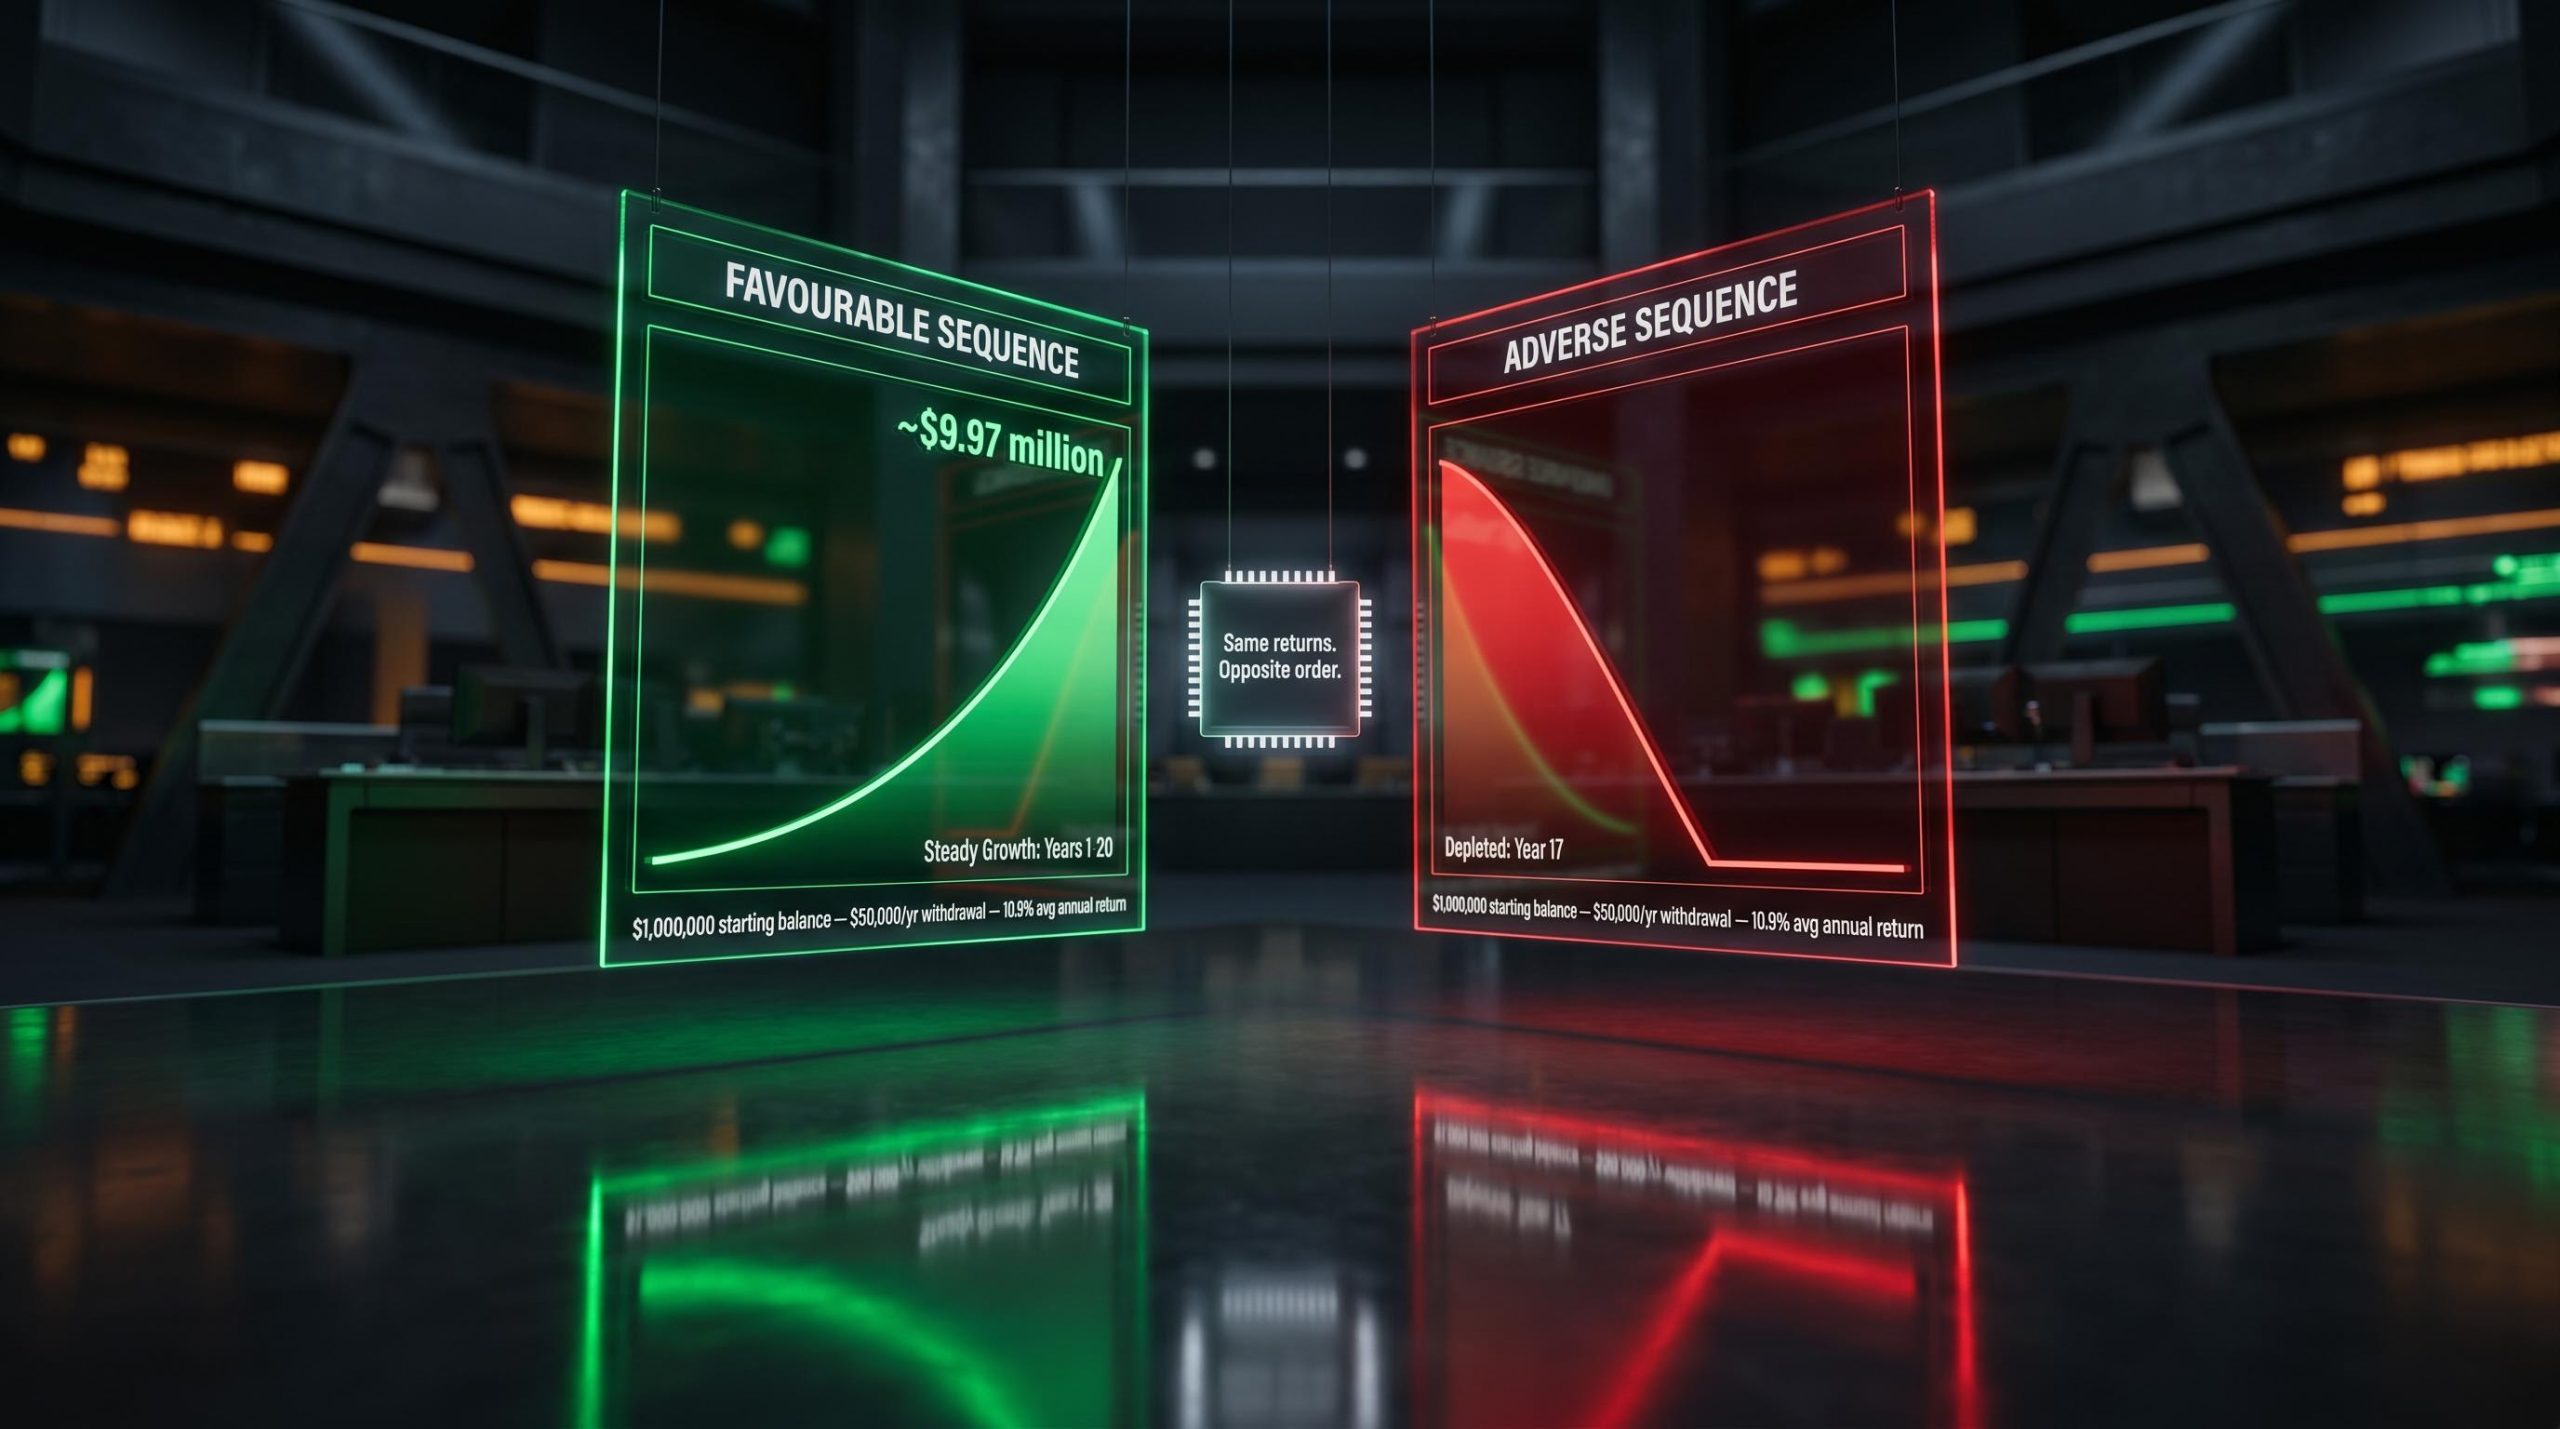
Picture two investors who stop working on the same day. Both have $1,000,000 saved. Both draw $50,000 a year, rising with inflation. Both achieve an identical 10.9% average annual return across 30 years. One ends up with nearly $10 million. The other exhausts their savings in year 17.
That is not a hypothetical designed to make a point. It is the modelled result of two portfolios receiving the exact same set of annual S&P 500 returns, just in reverse order. When a portfolio is being drawn down to fund living expenses, the timing of losses relative to withdrawals, rather than the long-run average return, is what ultimately governs whether the money lasts. If you are approaching a phase where you will fund living expenses from your portfolio, whether at 65 or 45, the average return you have earned over decades of saving is no longer the number that determines whether your money outlasts you.
This guide breaks down exactly why return order overwhelms return average once withdrawals begin, identifies the specific window where your portfolio is most exposed, and walks you through three structural moves you can put in place before that window opens. This is about preparation, not prediction, because the sequence that actually arrives is something no one can know in advance.
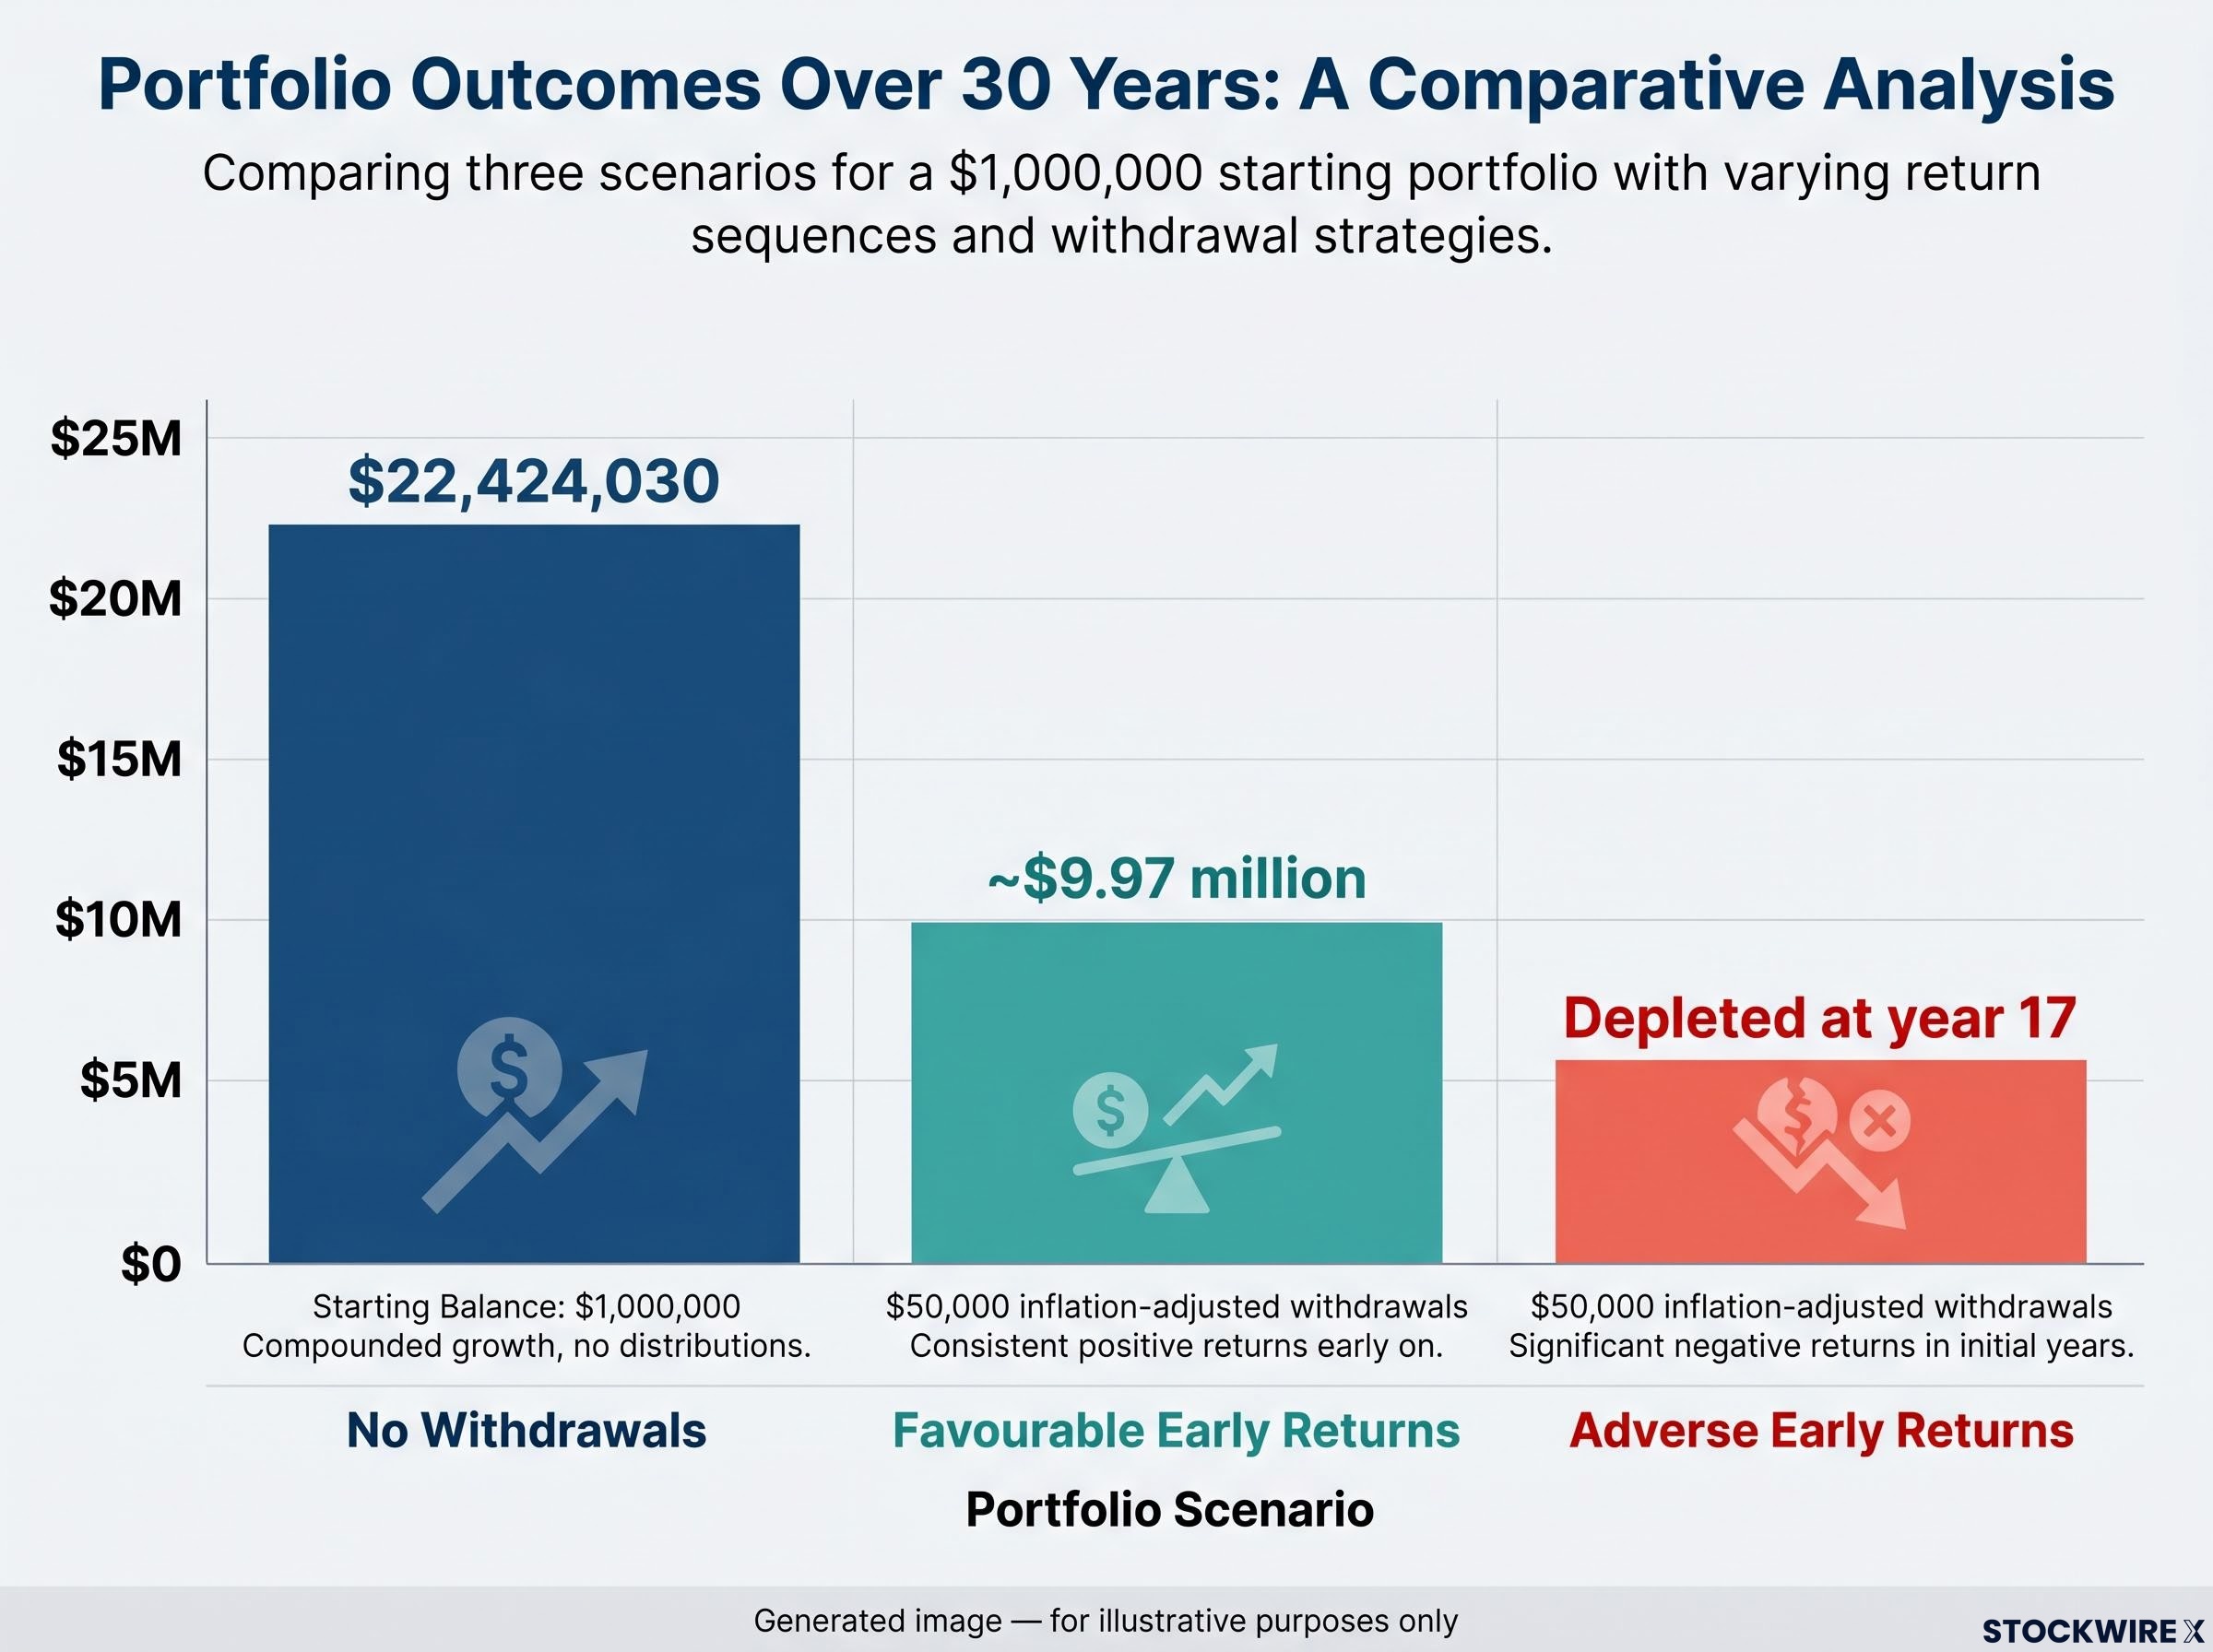
Consider a reassuring baseline: for an investor who is accumulating and never withdrawing, the sequence of returns is entirely irrelevant. Two portfolios, each starting at $1,000,000, that each receive the same 30 annual S&P 500 returns in opposite orders but never make a single withdrawal both arrive at exactly $22,424,030. This is pure arithmetic. When you multiply a fixed set of growth factors together, the sequence in which you multiply them has no effect on the result. A 10.9% annualised average produces the same terminal value regardless of whether the worst years fall at the start, the middle, or the end.
During the accumulation phase, sequence is entirely neutral: a portfolio receiving identical returns in any order and making no withdrawals arrives at the same terminal value, which is precisely why the habit of consistent investment compounds so powerfully before the drawdown window opens.
Now crack that certainty open.
The moment those same two investors begin drawing $50,000 a year, adjusted for inflation, a dramatic split opens between their outcomes, one that makes them barely comparable. The investor who enjoyed strong early gains finishes the 30-year period with approximately $9.97 million still intact. The investor who faced steep losses in the opening years exhausts every penny by year 17, leaving 13 years of planned retirement with no portfolio to support them.
| Investor | Sequence Type | Starting Balance | Annual Withdrawal | 30-Year Outcome |
|---|---|---|---|---|
| Both (no withdrawals) | Any order | $1,000,000 | $0 | $22,424,030 |
| Investor A | Favourable early returns | $1,000,000 | $50,000 (inflation-adjusted) | ~$9.97 million |
| Investor B | Adverse early returns | $1,000,000 | $50,000 (inflation-adjusted) | Depleted at year 17 |
The 10.9% average return that looks reassuring on a retirement calculator is not the number governing whether your portfolio survives. If your own retirement projections are built on average returns alone, they may be built on the wrong input entirely.
During your saving years, a market decline is a paper event. Your share count stays intact, and when the recovery arrives, every share participates. The losses reverse themselves. This is what makes the accumulation phase forgiving.
Withdrawals change the physics completely. In a falling market, raising cash for living expenses means selling shares at reduced prices, and more of them than would be needed in better conditions. Once those shares are liquidated, they are permanently removed from the portfolio. No subsequent recovery can restore what was already converted to cash and spent.
Recovery window costs compound the damage described above: each year of subdued equity values following a crash represents foregone compounding that cannot be recovered, meaning the opportunity cost of the recovery period can ultimately exceed the dollar loss from the initial drawdown itself.
The adverse-sequence modelling makes the destruction visible step by step:
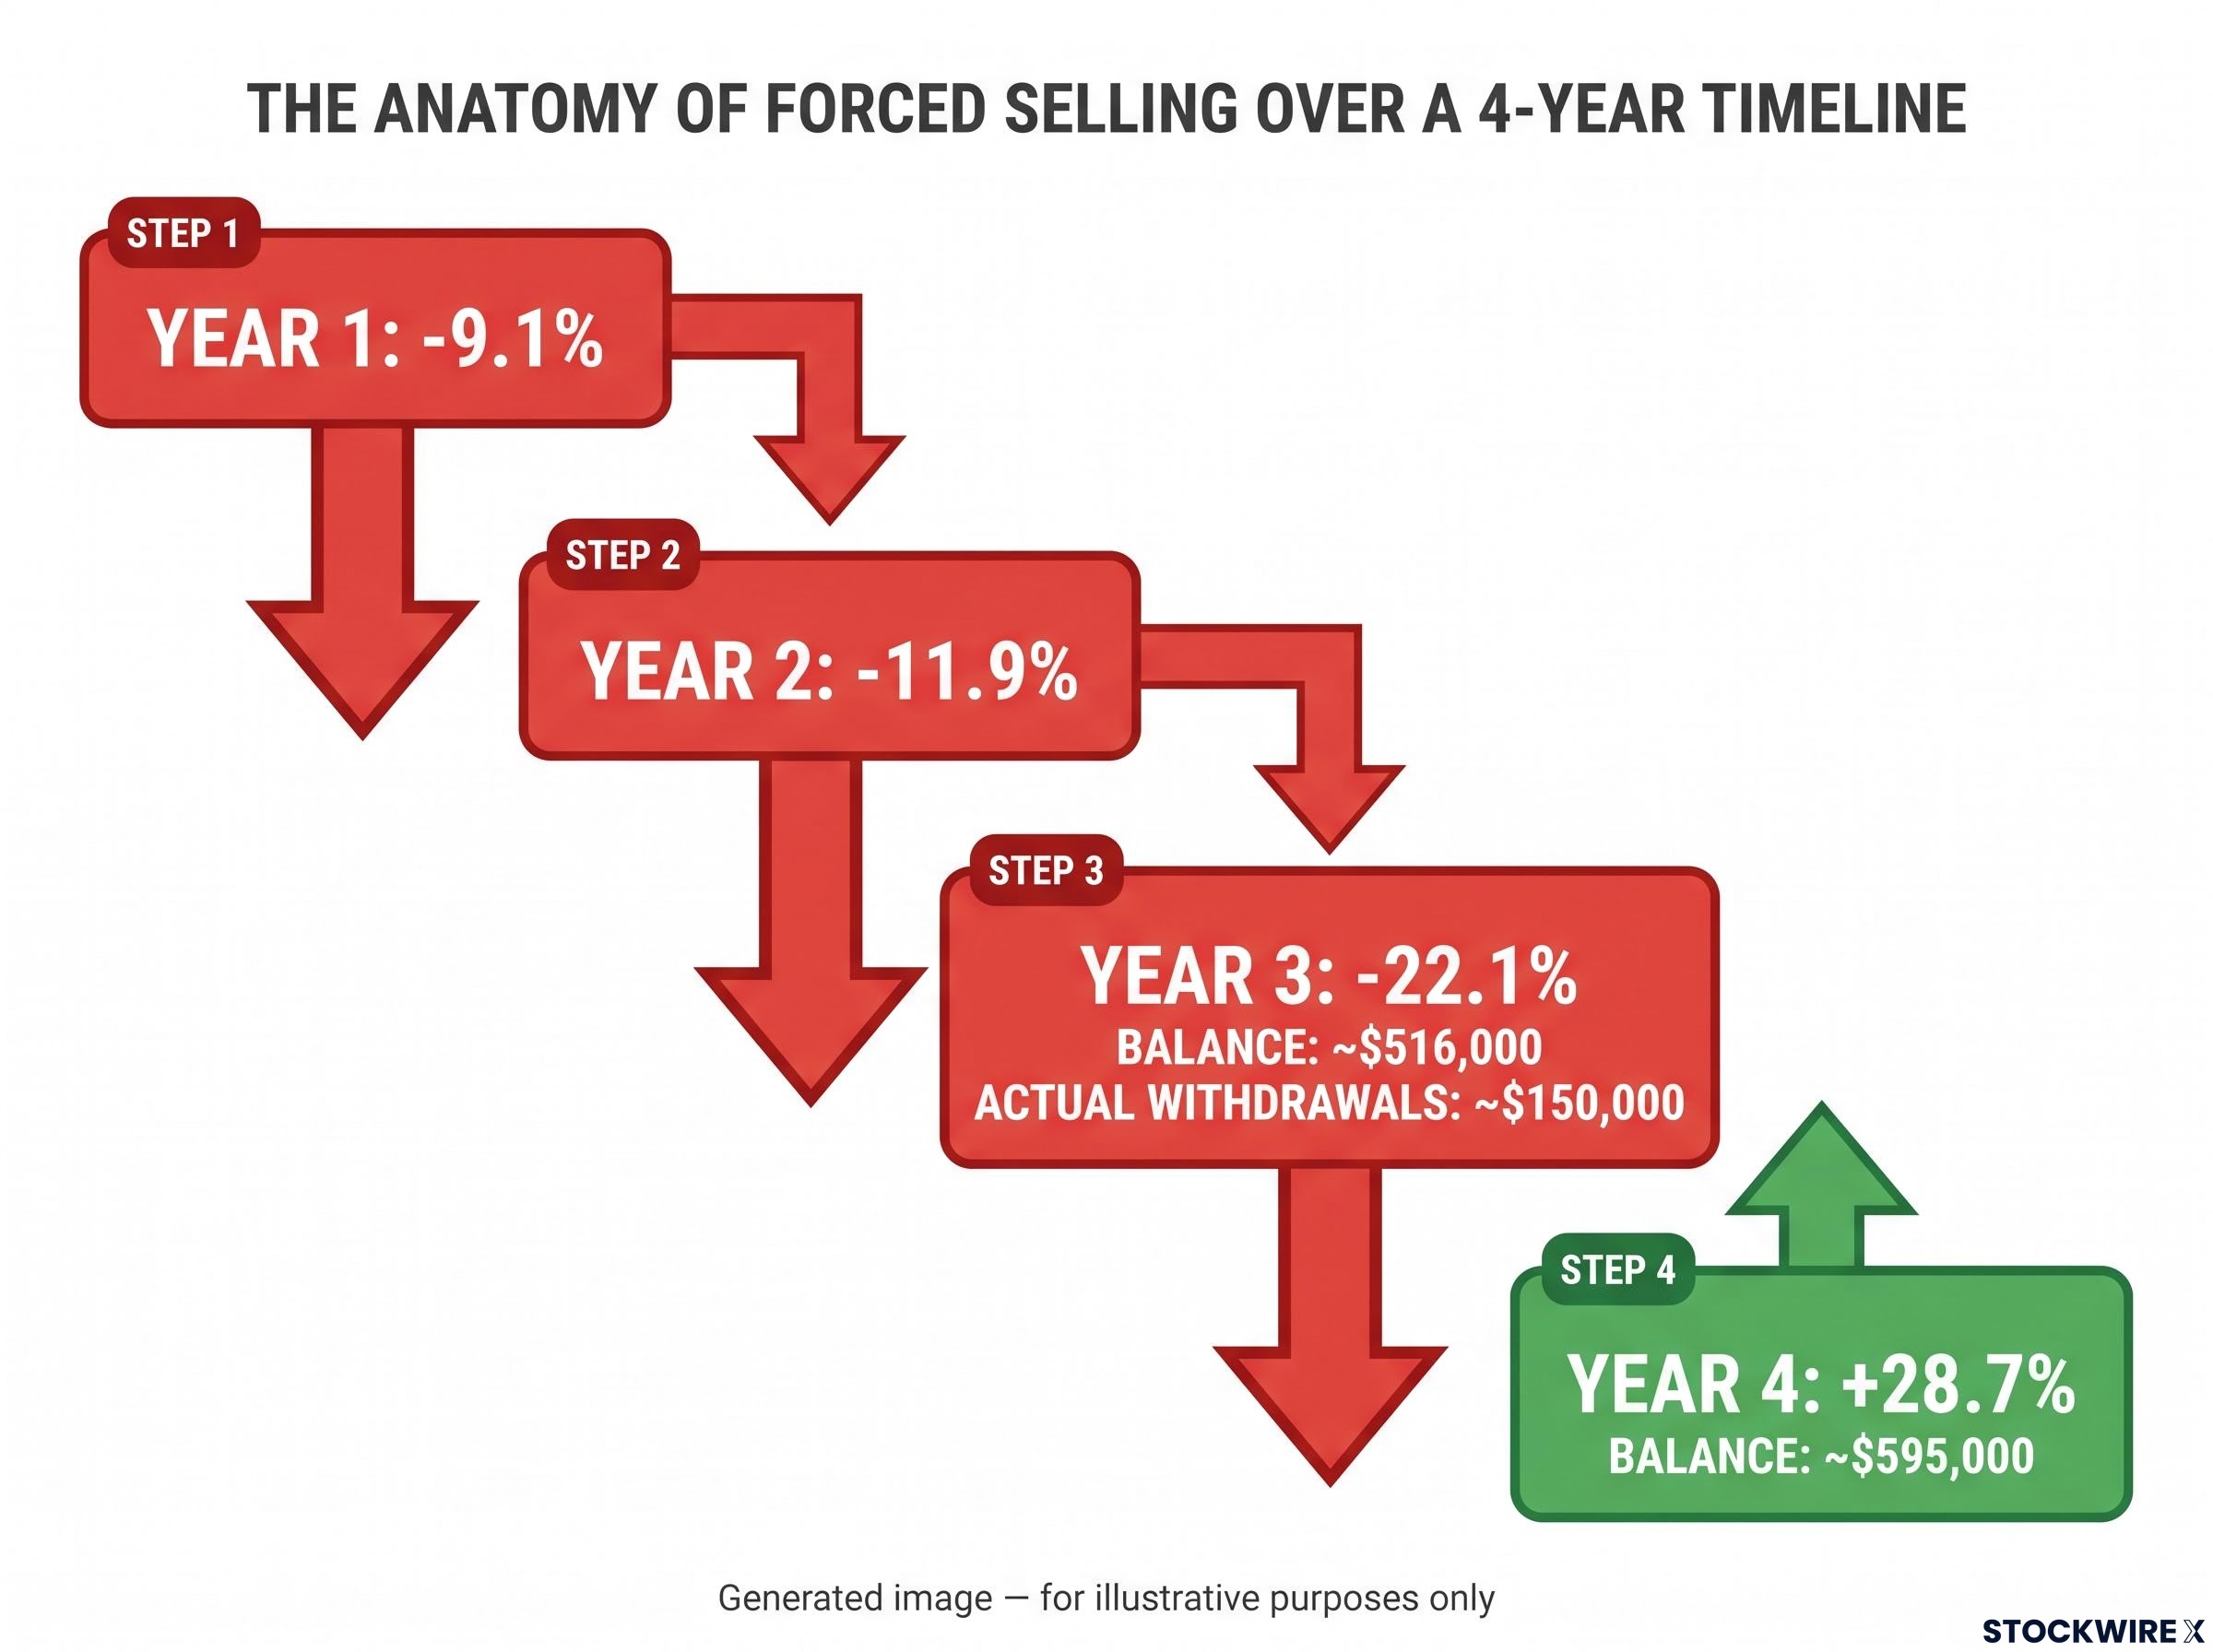
“Withdrawals taken when the portfolio has temporarily decreased in value permanently inhibit the portfolio’s future sustainability.” — Wade Pfau
That single sentence captures why a 28% market recovery is not a 28% portfolio recovery when forced sales have already reduced your share count. This asymmetry is the engine of the entire problem, and every protective strategy in this article works by interrupting this exact mechanism.
Sequence risk is not evenly spread across a 30-year retirement. It is heavily concentrated in the early withdrawal years, when your balance is at its largest (meaning percentage losses translate into the biggest dollar amounts) and the most years of withdrawals still lie ahead.
Simulation data makes the concentration stark. Running 10,000 different orderings of the same 30 historical returns, every one of which carries a 10.9% average annual return, revealed that 4.5% of those sequences (roughly 1 in 22) produced complete portfolio depletion. The luckiest ordering generated a final balance above $15 million, while the least fortunate surviving sequence limped to the finish line with just $1,835. Identical underlying returns, same average, yet outcomes separated by four orders of magnitude depending solely on the sequence.
The first five years proved to be the sorting variable. Sequences where the opening five years averaged approximately negative 1% had a failure rate of 20%, or 1 in 5. Sequences where the opening five years averaged approximately positive 13% had a failure rate of 0%.
| First 5-Year Average Return | Failure Rate | Practical Implication |
|---|---|---|
| ~Negative 1% | 20% (1 in 5) | One in five portfolios depleted entirely despite a strong long-term average |
| ~Positive 13% | 0% | No portfolio failed regardless of what happened in the remaining 25 years |
The difficulty is that living through those early years gives no indication that they carry outsized weight. There is no signal distinguishing a consequential bad stretch from ordinary volatility. The harm builds gradually through forced selling, eroding the share count in ways that do not announce themselves clearly in a monthly statement.
Newfound Research sequence risk analysis draws on the work of Kitces and Pfau to show that new retirees face their greatest vulnerability in the early withdrawal years, precisely when large drawdowns can set off the chain of forced selling that proves most difficult to reverse.
The modelling revealed something harder to sit with. By year 11 of the adverse sequence, every possible arrangement of the remaining returns had been tested and found insufficient to prevent eventual depletion. The fate of the portfolio was mathematically sealed while the balance still showed a six-figure number, with no entry on the account statement signalling that anything had gone permanently wrong.
This is the practical implication that matters most: waiting for your portfolio to look distressed before acting is too late. The structural damage from forced sales is already compounded into the share count, not the balance. By the time the numbers look alarming, the window for effective intervention has closed. That is precisely why advance structural preparation matters more than in-the-moment reaction.
Every strategy worth considering targets the same mechanism: preventing or reducing the sale of risky assets at depressed prices during the fragile window. These are not three separate ideas to choose between. They are three different ways to break the same chain, each suited to a different part of the problem. When tested individually against the adverse sequence, each provides meaningful improvement, but none on its own proves sufficient.
When all three operate together, the adverse sequence that once caused ruin instead produced a final balance of approximately $3.1 million. Across the full 10,000 simulated sequences, the portfolio failure rate fell from 4.5% to roughly 0.1%.
The floor is a reserve of 2-5 years of expenses held in cash and short-term bonds, built before withdrawals begin. Its operating logic is simple: set aside enough liquid, low-risk assets to cover several years of living costs, then draw exclusively from that reserve whenever your investment portfolio sits below its previous peak. Equity holdings remain untouched throughout, retaining their full share count to capture any recovery. Once the portfolio climbs to a new high, the reserve is replenished.
The retirement bucket strategy formalises the floor concept into a complete portfolio architecture, separating liquid near-term spending reserves from medium-term bonds and long-term equities so that no forced equity sale is ever required to fund ordinary living costs.
Schwab recommends keeping approximately one year in cash and another 2-4 years in short-term bonds to avoid tapping equities during a downturn. The trade-off is real: holding cash and short-term bonds means accepting returns below what equities would generate over the long run. Accepting that performance drag is the price of the protection, the cost you absorb in exchange for never being compelled to sell shares at the worst possible time.
Guardrails replace fixed annual withdrawals with rules-based adjustments. The approach involves defining in advance how spending will respond to market conditions: following a loss year, withdrawals are trimmed by a set percentage and inflation increases are paused; following a gain year, spending is gradually restored. A pre-set minimum level, the modelled example used 75% of the original planned amount, means the cuts stay within a manageable range rather than forcing genuine hardship.
The link to the forced-sale problem is direct: each pound or dollar you choose not to withdraw during a market decline is one more unit of investment that remains invested to capture the eventual recovery. The practical limit is equally clear: guardrails only function if a meaningful portion of your spending can actually flex. For retirees whose costs are largely fixed, this lever has limited room to operate.
The window defence uses a rising glidepath. Rather than maintaining a constant allocation throughout retirement, you begin the drawdown phase holding a deliberately lower proportion of equities (roughly 60% in the modelled example), reducing your exposure to large early losses during the fragile window. Once that period of heightened sequence risk has passed, typically after 5-10 years, equity exposure is gradually increased back toward a higher long-run target.
A rising glidepath as a structural design choice sits in direct opposition to the intuitive instinct to hold more equities as the portfolio grows, and it also contradicts the common age-based allocation heuristic that has guided millions of retirement investors toward fixed equity percentages that make no provision for sequence risk.
The timing requirement is non-negotiable. This lever must be implemented before the withdrawal window opens, not during or after a market decline. De-risking after a crash locks in losses rather than preventing them. Proactive implementation is the only version that works.
| Strategy | How It Works | Individual Effect | Combined Effect | Key Trade-off |
|---|---|---|---|---|
| Floor | Cash/bond reserve funds withdrawals during downturns | Year 17 → Year 19 | ~$3.1M final balance; failure rate drops from 4.5% to ~0.1% | Cash drag on long-term returns |
| Guardrails | Rules-based spending cuts after negative years | Year 17 → Year 27 | Requires genuinely flexible spending | |
| Window Defence | ~60% equity in early years, rising thereafter | Year 17 → Year 20 | Must be implemented before withdrawals begin |
When tested in isolation, each lever delivers only partial protection. When deployed together, the benefit is not simply the sum of the three individual effects; each lever reduces the pressure on the other two, so they reinforce one another. That mutual reinforcement is why combining them cuts failure risk from roughly 1 in 22 sequences to roughly 1 in 1,000.
The three levers work best when designed as an integrated package rather than three independent choices made in isolation. A larger floor reduces how frequently guardrail cuts are needed. Entering the withdrawal phase with lower equity volatility means both the floor and the guardrails face less strain. Sizing all three together produces more robust protection than maximising any single lever while neglecting the others.
The implementation sequence works best phased over 12-24 months before withdrawals begin, so you avoid converting assets at a single point that might itself be poorly timed:
Sequence risk is not confined to people who retire at a conventional age. It activates at the moment portfolio withdrawals begin, whether that is due to planned retirement, early financial independence, or any other period of drawing on investments without employment income replacing what is spent. The underlying arithmetic applies equally regardless of when or why the drawdown phase starts.
The cost of protection when it turns out to be unnecessary: favourable-sequence investors who applied all three levers finished with approximately $7.22 million versus approximately $9.97 million without protections, a cost of roughly $2.75 million in foregone upside. In a world where the poor sequence never materialised, that gap is the price of an insurance policy that was never called upon. Whether paying that price makes sense depends on your own capacity for spending flexibility and your tolerance for the risk of depletion.
This is a problem that cannot be designed away entirely. No structural approach forecasts which sequence of returns will arrive, and building buffers does not remove market volatility from the picture. What the three-lever system does is change where the impact lands when a difficult sequence occurs: rather than forcing the portfolio to absorb every shock through compulsory share sales, pre-positioned structural buffers take the strain during the critical early years, allowing the investment portfolio time to recover.
What the framework changes:
What it does not change:
A 4.5% probability of complete portfolio depletion across simulated sequences is not a negligible fringe scenario. Encountering those odds across a career’s worth of saving makes structural preparation a decision with material consequences. Cutting that figure to around 0.1% through advance design is not a claim about predicting poor markets; it is about ensuring that poor markets cannot trigger the chain of forced sales that converts temporary drawdowns into an irreversible shortfall.
Pfau’s work on sequence of returns risk highlights that the order in which returns land, rather than their long-run average, accounts for most of the variation in retirement outcomes. The preparation described in this article needs to be in place before the fragile window opens, because none of the three levers can be retrofitted during a crisis without worsening the very problem they exist to prevent.
This article is for informational purposes only and should not be considered financial advice. Investors should conduct their own research and consult with financial professionals before making investment decisions. Past performance does not guarantee future results. Financial projections are subject to market conditions and various risk factors.
Sequence of returns risk is the danger that poor market returns arriving early in the withdrawal phase permanently damage a portfolio, because selling shares at depressed prices to fund living expenses removes those shares from any subsequent recovery. The long-run average return is irrelevant if early losses force enough compulsory sales to make depletion inevitable.
During accumulation, multiplying a fixed set of growth factors in any order produces the same terminal value, so sequence is neutral. Once withdrawals begin, early losses force you to sell more shares at lower prices to raise cash, permanently reducing the share count that benefits from any recovery, meaning two portfolios with an identical 10.9% average can produce outcomes separated by millions of dollars.
The modelled floor strategy recommends holding 2-5 years of core expenses in cash and short-term bonds before withdrawals begin, with Schwab's guidance suggesting roughly one year in cash and another 2-4 years in short-term bonds. This reserve funds living costs during downturns so equity holdings remain untouched and retain their full share count for any recovery.
A rising glidepath starts the drawdown phase with a deliberately lower equity allocation (around 60% in the modelled example) to limit exposure to large early losses, then gradually increases equity exposure after the fragile 5-10 year window has passed. It must be implemented before withdrawals begin because de-risking after a crash locks in losses rather than preventing them.
Across 10,000 simulated return sequences, deploying all three levers together reduced the portfolio failure rate from 4.5% (roughly 1 in 22 sequences) to approximately 0.1% (roughly 1 in 1,000), and the adverse sequence that previously caused full depletion by year 17 instead produced a final balance of approximately $3.1 million.