Here is a number that sounds like a solution to every income investor’s problem: a $100,000 portfolio split across four ultra-high-yield single-stock covered call ETFs could throw off close to $10,000 a month. That is not a typo, and the distributions are genuinely paid.
Now the part the yield table leaves out. Within twelve months, that same portfolio could lose the majority of its underlying value, and the monthly cheque would shrink right alongside it. The headline income and the cost of earning it are two very different stories.
Covered call ETFs are now everywhere for ordinary U.S. retail investors, and the advertised yields span an enormous range: from index-based products paying roughly 12% a year to single-stock funds flashing yields above 200%. That spread is not a menu of better and worse deals. It is a spectrum of how much capital you are quietly agreeing to spend.
This is a framework for reading a covered call ETF’s income figure in context. After this, you will know what the number actually represents, which three questions reveal whether the income is sustainable, and where your own goals place you on the spectrum between steady and spectacular.
What $100,000 actually generates across the covered call ETF spectrum
Start with the money, because the gap between the two scenarios makes the argument before any explanation is needed.
The index-based baseline
Split $100,000 evenly across three index-based covered call ETFs at $25,000 each: SPYI (the NEOS S&P 500 High Income ETF), QQQI (the NEOS Nasdaq 100 High Income ETF), and BTCI. That allocation produces an estimated combined monthly income of roughly $1,270.
These funds write options against broad market indexes rather than a single stock, which is why their distributions stay in a relatively stable, predictable range. As of early September 2026, SPYI reported a trailing twelve-month yield of 11.76% and a dividend yield of 12.16%, while QQQI carried a twelve-month trailing yield of approximately 14.16%.
The income gap between indexes is structural rather than managerial: Nasdaq 100 covered call products have generated roughly 22 percentage points more lifetime distribution growth than S&P 500 equivalents run by the same manager, driven by higher implied volatility and concentration in premium-rich mega-cap technology names.
That is meaningful income. It sits well above what a plain dividend index pays, and it arrives every month.
The maximum-yield scenario
Now run the same $25,000-per-fund model through the highest-yielding single-stock products from providers like GraniteShares and YieldMax. The projected monthly income approaches $10,000 on the identical $100,000 base.
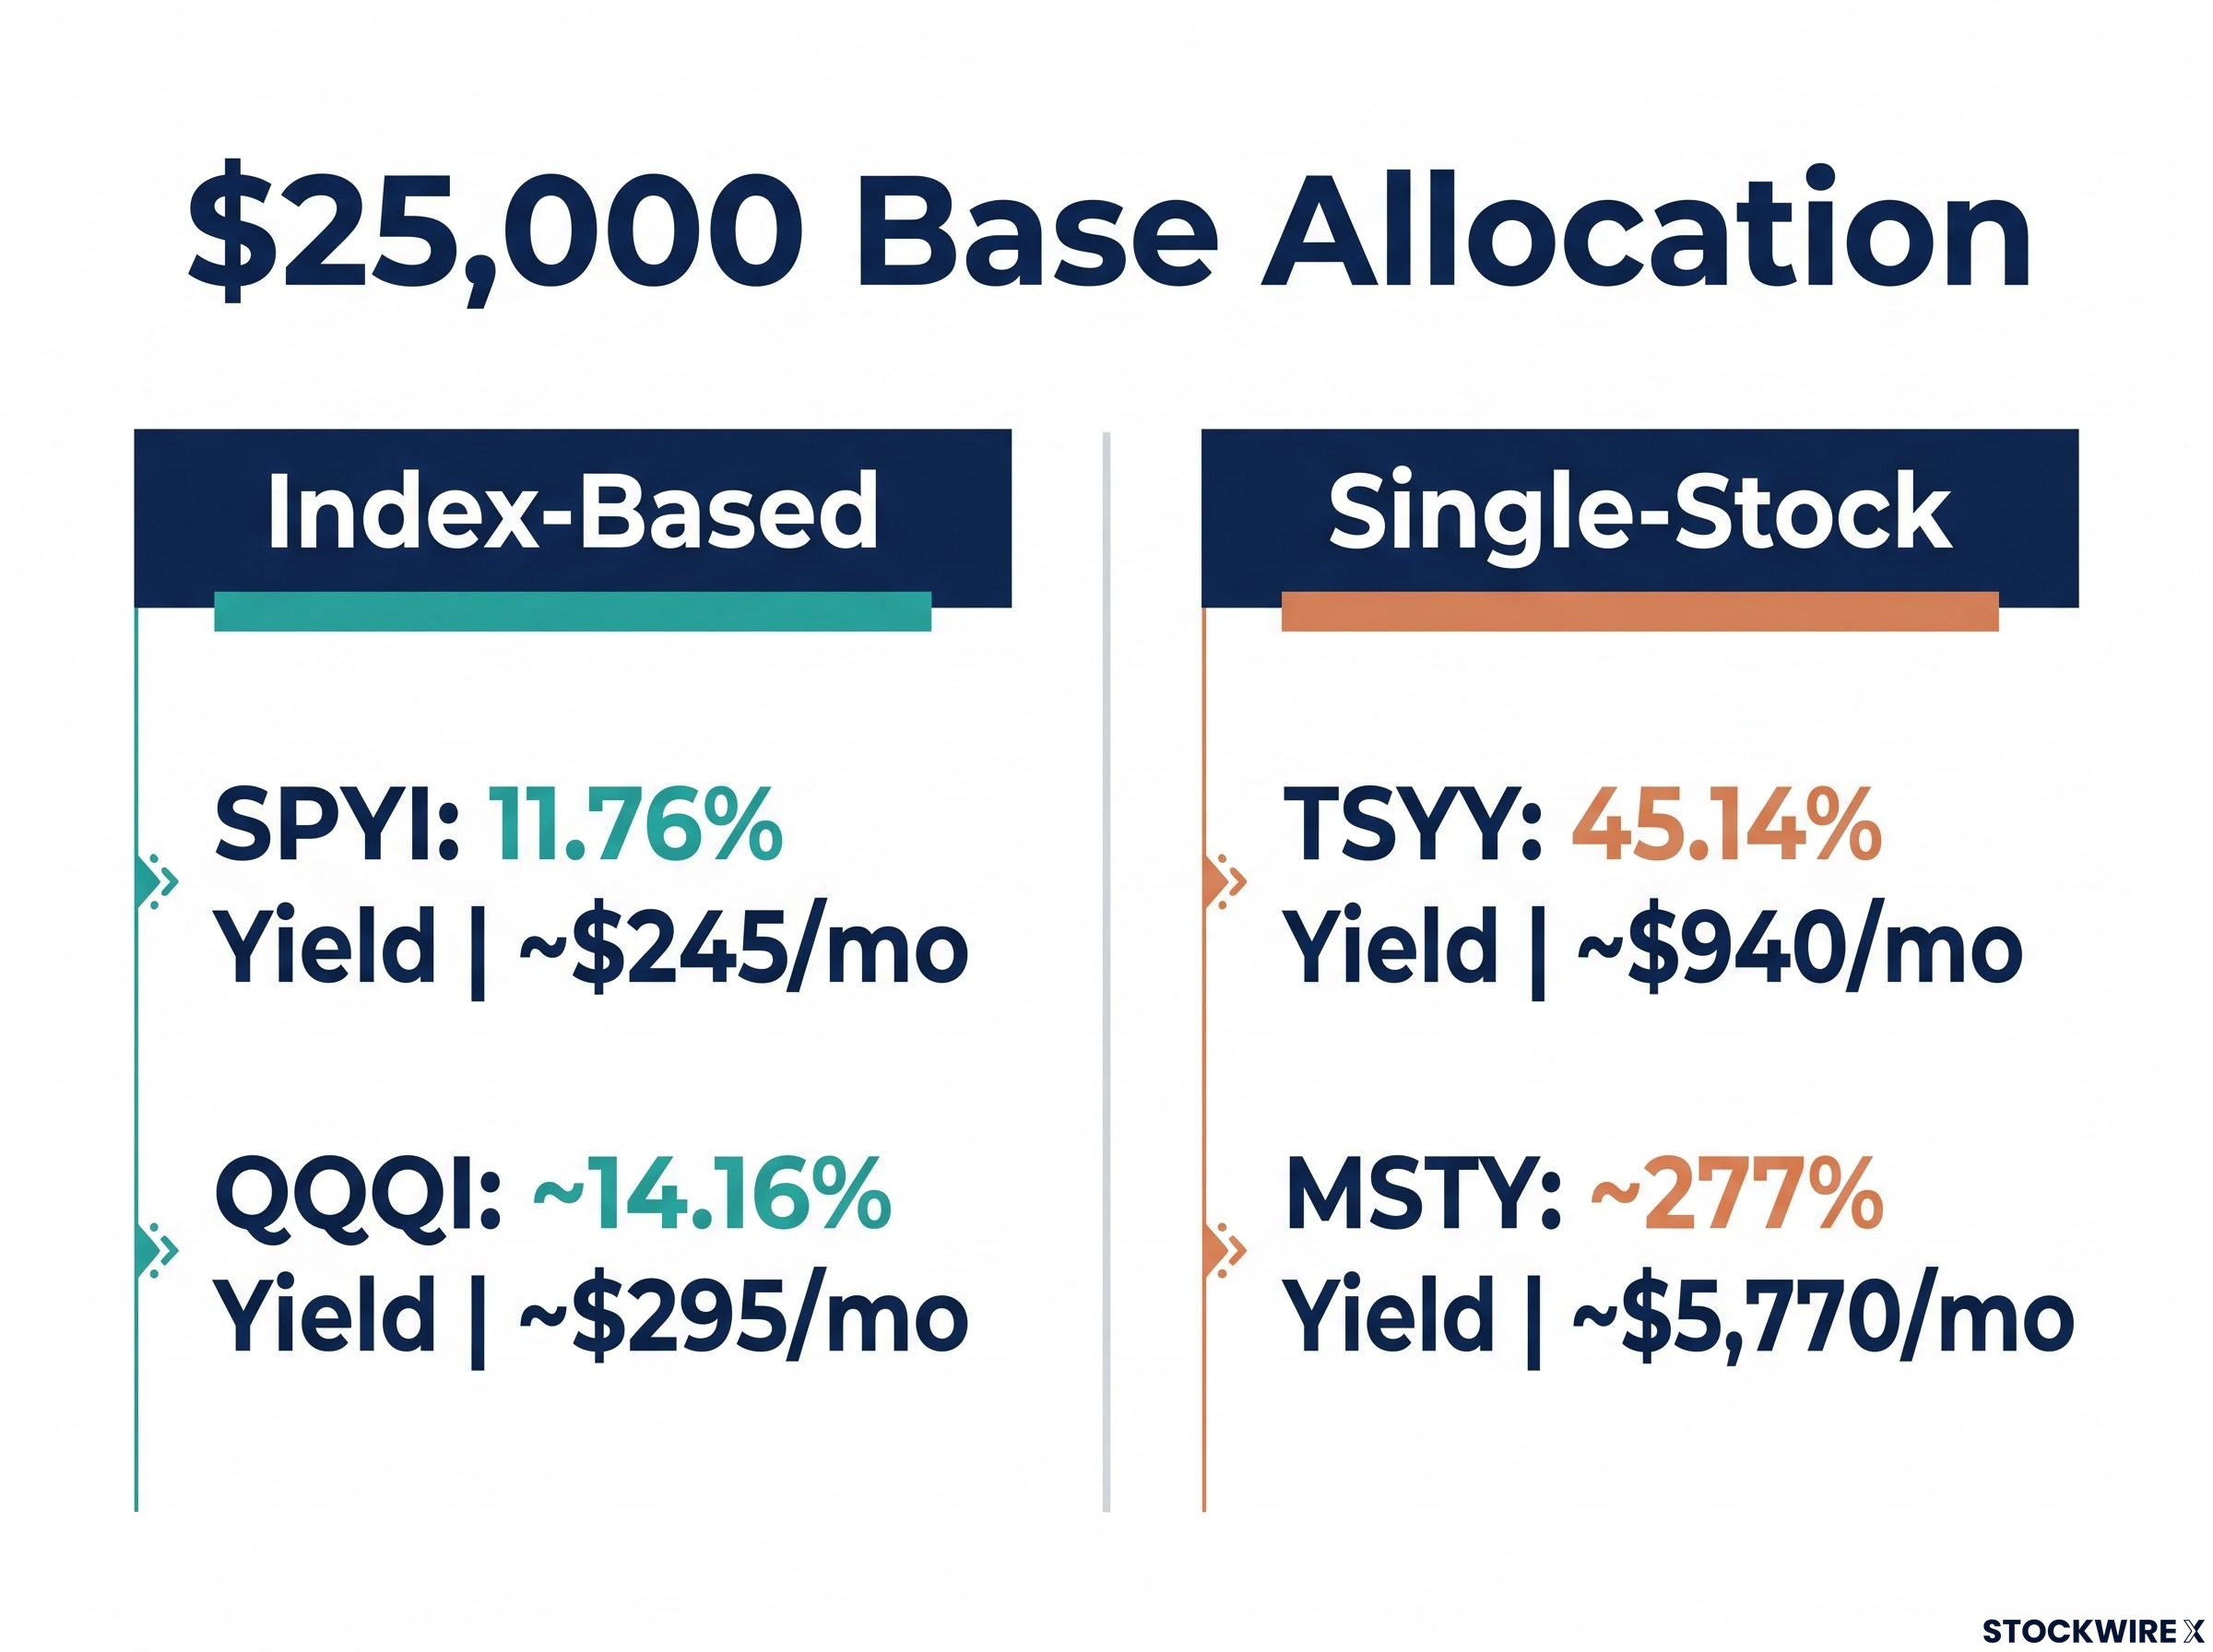
The GraniteShares YieldBOOST suite (TSYY, NVYY, TQQY, XBTY) posted annualised distribution rates of 25% to 45% as of 4 September 2026, with TSYY at 45.14% and NVYY at 38.96%. YieldMax’s MSTY was analysed at an annualised yield of 277.12% near a $6.94 share price.
| Fund | Annualised Yield (approx.) | Est. Monthly Income on $25,000 | Product Category |
|---|---|---|---|
| SPYI | 11.76% | ~$245 | Index-based |
| QQQI | ~14.16% | ~$295 | Index-based |
| TSYY | 45.14% | ~$940 | Single-stock |
| NVYY | 38.96% | ~$812 | Single-stock |
| MSTY | ~277% | ~$5,770 | Single-stock |
That near-$10,000 figure is a snapshot, a point-in-time calculation on a NAV (net asset value, the per-share value of the fund’s holdings) that is actively falling.
The contrast in plain terms: $1,270 per month from index-based products versus close to $10,000 from maximum-yield single-stock ETFs on the same $100,000 starting balance.
The gap between $1,270 and $10,000 is not a measure of one product being eight times better. It is a measure of how much capital destruction risk you are implicitly accepting for that headline income.
When big ASX news breaks, our subscribers know first
Why the mechanics of options writing determine everything about income sustainability
Here is the single figure that separates a real income stream from a disguised withdrawal of your own money: the 30-day SEC yield. Once you understand what it measures, a 277% yield stops looking like an opportunity and starts looking like a structural impossibility.
A covered call ETF works in a straightforward sequence:
- The fund owns an asset, either a broad index basket or a single stock.
- It sells a call option against that asset, giving another party the right to buy it at a set price.
- It collects a premium (a cash payment) for selling that option.
- It distributes that premium to shareholders as income.
- On the ex-dividend date, the fund’s NAV drops by the exact amount of the distribution.
That final step is where the trouble starts. When the underlying asset falls, the premium collected is nowhere near enough to offset the loss, so NAV erodes. The fund keeps paying, but it is paying out of a shrinking base.
The diagnostic that exposes this is Return of Capital (ROC), which is when a fund’s distribution is simply handing you back your own invested principal rather than paying you genuine earnings. Over 95% of NVYY’s distributions were classified as ROC. A June 2025 YMAX distribution carried a 96.28% ROC component, which analysts described as a slow-motion withdrawal from principal rather than income.
The cleaner measure of what a fund actually earns is the 30-day SEC yield, a standardised figure that strips out return of capital.
The gap between total return vs yield is a recurring blind spot in income investing: a distribution that resets the share price downward by the exact payout amount creates no net wealth at the moment it is received, which is why tracking price plus income together is the only honest measure of what a fund actually delivers.
The tell: TSYY’s 30-day SEC yield was just 0.83%, against an annualised distribution rate of 45.14%.
QQQI’s 30-day SEC yield sat near zero at -0.05%, reflecting the mechanics of the options overlay rather than genuine cash generation. Even MSTY, on one accounting, showed over 98.04% of distributions classified as capital gains and only 1.96% as true income.
When a fund’s SEC yield is near zero but its distribution rate is 45%, it is not generating 45% in income. It is liquidating and recycling its own assets to manufacture the appearance of income, and you need to grasp that distinction before you allocate a single dollar.
To evaluate any covered call ETF, ask three things:
- What percentage of recent distributions is classified as Return of Capital?
- What is the 30-day SEC yield, the measure of income actually earned?
- What has total return, price plus distributions, looked like over one to three years?
What happens to the principal: the NAV destruction evidence
The mechanics predict capital erosion. The case studies confirm it, and the pattern is clearest when you walk it from the most extreme example down.
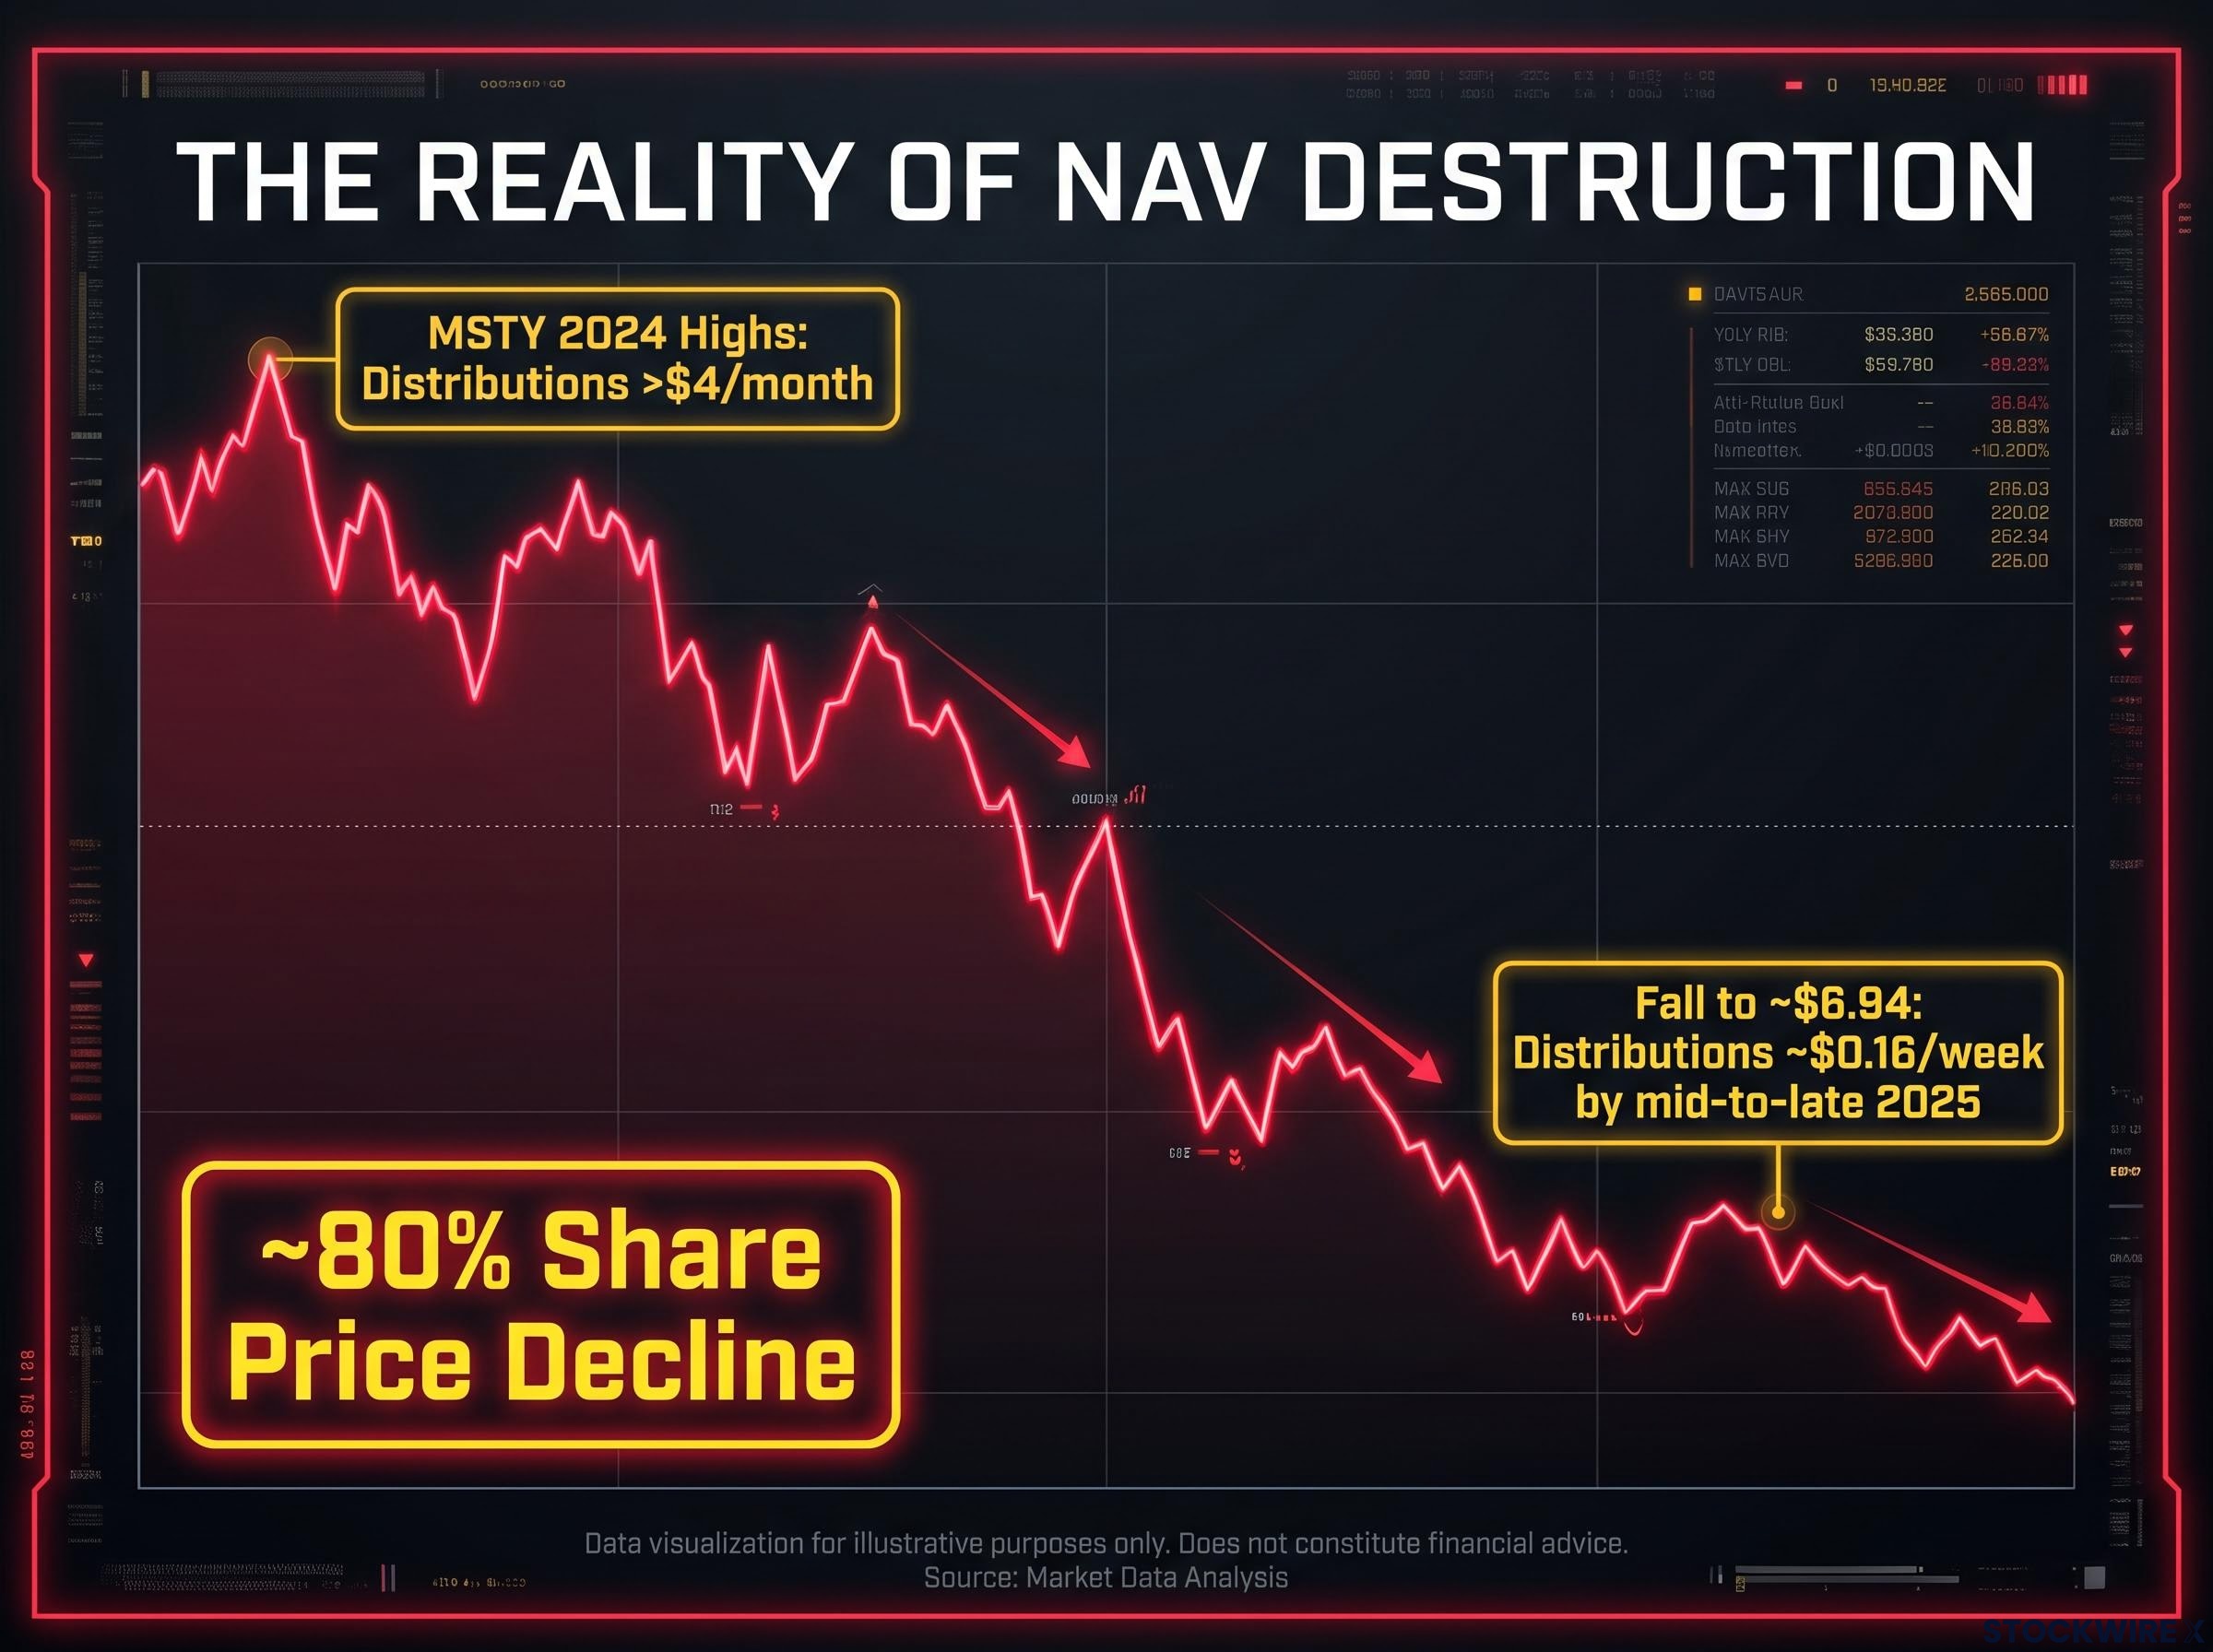
MSTY is the starkest. Its share price fell roughly 80% from 2024 highs to about $6.94. The income collapsed in lockstep: distributions that exceeded $4 per share monthly at launch shrank to roughly $0.16 per week by mid-to-late 2025. That is the point most yield tables miss. When NAV falls, the absolute dollar income falls with it, even if the headline percentage holds steady.
YMAX shows the same disease at a slower pace. Its NAV dropped from $20.22 to $11.02, a decline of about 45% by April 2025, with a maximum drawdown of 25.55% and ongoing weekly NAV declines of roughly $0.105. Distributions have fallen 52.9% since October 2025.
The provider itself has acknowledged the structural flaw. On 8 December 2025, YieldMax announced strategic updates to its ULTY fund, aiming to better balance income with capital preservation.
NAV erosion from return of capital is not unique to the most extreme single-stock products; concentrated ETFs in the 18-25% yield range show the same pattern at a slower pace, with ROC components quietly reducing the capital base that generates future distributions.
In YieldMax’s own framing: repetitive large distributions may significantly erode a fund’s NAV and trading price.
Contrast that with the index-based track record. SPYI delivered a one-year total return between 17.49% and 17.98%, modestly behind the S&P 500’s 20.11% but with capital broadly intact. QQQI returned between 18.86% and 25.99% on a NAV basis against the Nasdaq-100’s 34.38%.
| Fund | Approx. NAV Decline | Income Impact |
|---|---|---|
| MSTY | ~80% | Monthly distributions from over $4 to ~$0.16/week |
| YMAX | ~45% | Distributions down 52.9% since October 2025 |
| SPYI | Broadly preserved | 1-year total return ~17.5-18% |
The income math after NAV erosion
Now put yourself back in that $100,000 starting position, all of it chasing the 277% yield. After an 80% NAV collapse, you are no longer working from $100,000. You are working from roughly $20,000.
A yield applied to a $20,000 base produces perhaps $2,000 per month rather than the $10,000 you started with. The original income goal is now mathematically out of reach without pouring in fresh capital.
The index-based investor sits in the opposite position. With SPYI’s one-year total return near 17.5%, the capital base held or grew modestly, which means the absolute dollar income stayed stable rather than shrinking. Same starting balance, opposite trajectory.
Building a framework for evaluating covered call ETF income strategies
Knowing what has gone wrong is only useful if it hands you a repeatable test. It does, and the test is three questions long.
- Check the ROC percentage. Pull the most recent distribution breakdown. If Return of Capital dominates, as with NVYY’s 95%-plus or YMAX’s 96.28%, the fund is largely refunding your own money.
- Look up the 30-day SEC yield. This is the income the fund genuinely earns. TSYY’s 0.83% against a 45.14% distribution rate is the warning sign in numeric form.
- Examine one to three year total return. Price appreciation plus distributions, measured against the underlying index or asset, tells you whether wealth was preserved or spent.
A fund that fails all three, high ROC, near-zero SEC yield, negative total return, is not an income vehicle. It is a structured capital return product wearing income language, and you should treat it as one.
The spectrum then sorts itself into two honest categories:
- Index-based covered call ETFs (the SPYI and QQQI range): suited to investors who want meaningful income above a dividend index without sacrificing long-term capital growth.
- Single-stock high-yield ETFs: speculative instruments where you are effectively making a short-term bet on volatility, not building a durable income stream.
Tax treatment reinforces the divide. Index-based option gains may fall under the 60/40 rule, taxed as 60% long-term and 40% short-term capital gains. ROC distributions are not taxed as current income, but they reduce your cost basis, which sets up a heavier capital gains bill when you eventually sell.
A fund paying 277% annualised cannot sustain that income without destroying the capital base that generates it. The yield and the durability are working against each other.
This framework outlasts any single fund. As new covered call ETFs keep launching in the U.S. market, the same three questions apply regardless of the name on the ticker.
What the income math tells you about where to position on the spectrum
So the choice is not between a good product and a bad one. It is between two products that do genuinely different jobs.
The $1,270-per-month index allocation is an income-with-growth vehicle. The near-$10,000 single-stock allocation is a cash-now, capital-decline vehicle. Neither is universally wrong. The only question that matters is what you actually need from the money.
Reinvestment capacity is the variable the spectrum framing does not make explicit: an investor who compounds distributions back into the fund needs entirely different metrics than one spending them as cash, and the same fund can be rational for one profile while being structurally unsuitable for the other.
- The sustainable income seeker: prioritises capital preservation, accepts a 12% to 14% yield, and wants the same balance still producing a similar cheque years from now.
- The maximum cash-flow speculator: needs the largest possible near-term payout, accepts that principal will decline, holds for the short term, and expects the yield to shrink over time.
A short-term, high-cash-flow play using single-stock products can be perfectly rational for the second profile. Someone who needs maximum cash now, understands the principal will fall, and is not counting on a stable or growing stream is making a clear-eyed trade, not a mistake.
Choosing the index-based route at 12% means accepting a smaller monthly cheque in exchange for the realistic expectation that the same capital will still be paying you five years out. That trade-off is precisely what makes the income sustainable rather than spectacular. SPYI’s one-year total return near 17.5% is the practical picture of what that looks like, set against MSTY’s roughly 80% capital decline and collapsing distributions.
Return, then, to the tension you started with. The $10,000 per month is real, but it is not income in the traditional sense. Understanding that one distinction is the difference between a portfolio that funds your goals and one that quietly liquidates your wealth to pay you back with your own money.
This article is for informational purposes only and should not be considered financial advice. Investors should conduct their own research and consult with financial professionals before making investment decisions. Past performance does not guarantee future results. Financial projections are subject to market conditions and various risk factors.