Price does not always move forward. Sometimes it turns around and goes back to claim territory it skipped over entirely, leaving a visible void on the chart where no trading ever happened.
Traders who understand why this happens have a systematic edge over those who treat it as noise.
These voids are called gaps, and they show up on nearly every chart you pull up. Most retail traders either ignore them or shrug them off as random anomalies. That is a mistake.
Gap-filling technical analysis converts these overlooked zones into something useful: directional price targets and entry triggers that work for both long and short setups on the same asset.
This piece walks through how the methodology works at a mechanical level, then shows it in practice through three real setups on SanDisk, Marvell Technology, and SoundHound AI drawn from analysis in August 2026. After reading, you will be able to look at any gap on a chart and ask the right questions about whether it is worth trading.
What price gaps actually are, and why markets tend to revisit them
Pull up any daily chart and look for a spot where the price jumps from one level to another without touching the space in between. That empty space is a gap: a price range where no transactions occurred during normal trading hours, leaving an unvalidated zone on the chart.
Direction matters here. An upward gap (often shown green) signals a bullish target, a sign that price may climb to fill the overhead space it left behind. A downward gap (shown red) signals a bearish target, and the bottom boundary of that red zone becomes the key resistance level you watch.
What makes the methodology versatile is that you can apply it to the same stock in both directions at once. One asset can offer a short setup at an overhead gap and a long setup at a gap below, depending on how price moves. It is a framework, not a single-direction bias.
The three structural reasons gaps tend to fill
Gap-filling is not a superstition. It is a behaviour rooted in how markets are built, and three drivers work together to explain it.
- Mean reversion and overreaction correction: Gaps often form when news triggers an irrational burst of buying or selling. When the gap fills, price has returned to its pre-gap level as that initial overreaction fades and conditions normalise.
- Liquidity and order-flow rebalancing: Untraded zones have no transaction history behind them. Liquidity providers rebalance their inventory and order flow naturally retests these areas to establish proper consensus on price.
- Psychological support and resistance: Many traders view large gaps as unnatural and expect them to reverse. That expectation becomes self-fulfilling, turning old gap boundaries into meaningful support and resistance.
Read together, these three drivers tell you something important. Gaps fill because of market structure, not chart magic, which is exactly why the technique is worth learning even though not every gap fills.
Empirical research on price gaps across stock and commodity markets has tested whether these voids represent genuine anomalies or noise, finding that gap behaviour is consistent with liquidity rebalancing and mean-reversion dynamics rather than random price movement, which gives the structural explanation above a solid evidence base.
When big ASX news breaks, our subscribers know first
Three case studies showing gap-filling setups in practice
The clearest way to understand the methodology is to watch it work on real charts. What follows are three historical illustrations from analysis conducted around August 2026. They are educational examples, not live trade calls, and the price levels reflect that analysis period rather than current market prices.
SanDisk (SNDK): using a downward gap as a short-selling resistance target
SanDisk produced a bearish downward gap of roughly 6%, unrelated to any earnings announcement, and the stock then continued to slide by over 20%. That downward gap is the setup.
Under this reading, the primary gap resistance level sits at $17.86. If the stock recovered to that level, it would represent a bounce of roughly 26% from recent lows, a move into resistance that a short seller could target. A secondary resistance level was identified near $118.19, about 7% above the primary entry zone.
Short selling entry signals that use gap structure as a trigger, including gap-and-go continuation shorts confirmed by above-average volume and fade-the-gap shorts entered as failed breakouts roll over, are the operational layer that sits underneath the gap-resistance levels this article identifies.
The logic here is directional: the red gap acts as a ceiling, and the short thesis rests on price stalling as it approaches that untraded overhead zone.
Marvell Technology (MRVL): a dual-direction setup with short resistance and long support
Marvell Technology shows why the framework is flexible. The stock had an earnings-related sell-off of about 17% the prior week, and the bottom of that red gap zone at $241.45 became the key resistance to watch.
Reaching that resistance from recent lows would require a recovery of more than 20%, and the larger the required move, the higher the odds of a pullback as price runs into the gap. That made it a short setup considered suitable for day trading execution.
The long side lives lower down. If price collapsed through the resistance level, a secondary support gap near $193.78 to $194 would come into play, requiring a further decline of roughly 12%. Same stock, two setups, opposite directions.
SoundHound AI (SOUN): targeting an upward gap as long entry support
SoundHound AI flips the direction entirely. The stock rallied roughly 27% following an earnings-related gap that began around 5 August 2026, then pulled back by more than 18% from that post-earnings peak.
Here the upward gap acts as support rather than resistance. The long entry was anticipated if price retraced to gap support at $21.50, with the expectation of a bounce off that level. Both the $21.50 target and the roughly $3 billion market cap context reflect the August 2026 analysis period.
The smaller market cap matters. Trading gaps in lower-cap stocks carries greater risk, a point that becomes central when we get to risk management.
| Stock | Gap Type | Key Level | Direction | Setup Note |
|---|---|---|---|---|
| SanDisk (SNDK) | Downward (6%) | $17.86 resistance | Short | Non-earnings gap; 20%+ continued decline |
| Marvell (MRVL) | Downward (17%) | $241.45 resistance; $193.78-$194 support | Short and long | Earnings gap; day-trading setup |
| SoundHound (SOUN) | Upward (27% rally) | $21.50 support | Long | Post-earnings gap; smaller-cap risk |
Educational illustration only All three setups reflect August 2026 analysis and are used here to demonstrate the methodology. They are not current trade recommendations, and the price levels cited do not represent present-day trading prices.
Reading across all three, one pattern should be forming in your mind: gap levels behave like magnetic zones where price either reverses or accelerates. Knowing which outcome is more likely is where probability comes in.
When gap-filling works and when it does not: probability and context
Here is the uncomfortable part. Not every gap fills, and traders who assume they all do get punished for it. The difference between a reliable setup and a losing one comes down to the type of gap and the market conditions around it.
Common gaps are the reliable ones. These occur inside the prior day’s trading range, in sideways or choppy markets, without a strong fundamental catalyst behind them. Historically, common gaps of this kind fill 70-80% of the time, and small gaps of 2-5% without a powerful driver are treated as high-probability mean-reversion candidates.
Gap fill rates vary dramatically by size category: sub-0.25% moves on SPY fill at 80-85% across 2,400 sessions, while moderate gaps in a low-volatility regime collapse to roughly 33%, which is exactly why treating a single aggregate fill percentage as a trading rule produces more losing setups than winning ones.
Early price action sharpens the read. If the first 15-minute candle after the open moves toward the fill and shows a reversal pattern, the odds jump.
93.1% same-day fill rate Analysis of Nasdaq-100 (NQ) futures data from 2015-2025 found that combining small gaps with first-15-minute candle confirmation produced a 93.1% same-day fill rate across hundreds of cases.
That number tells you the methodology has genuine statistical backing under the right conditions. It also tells you the conditions are doing the heavy lifting, not the gap alone.
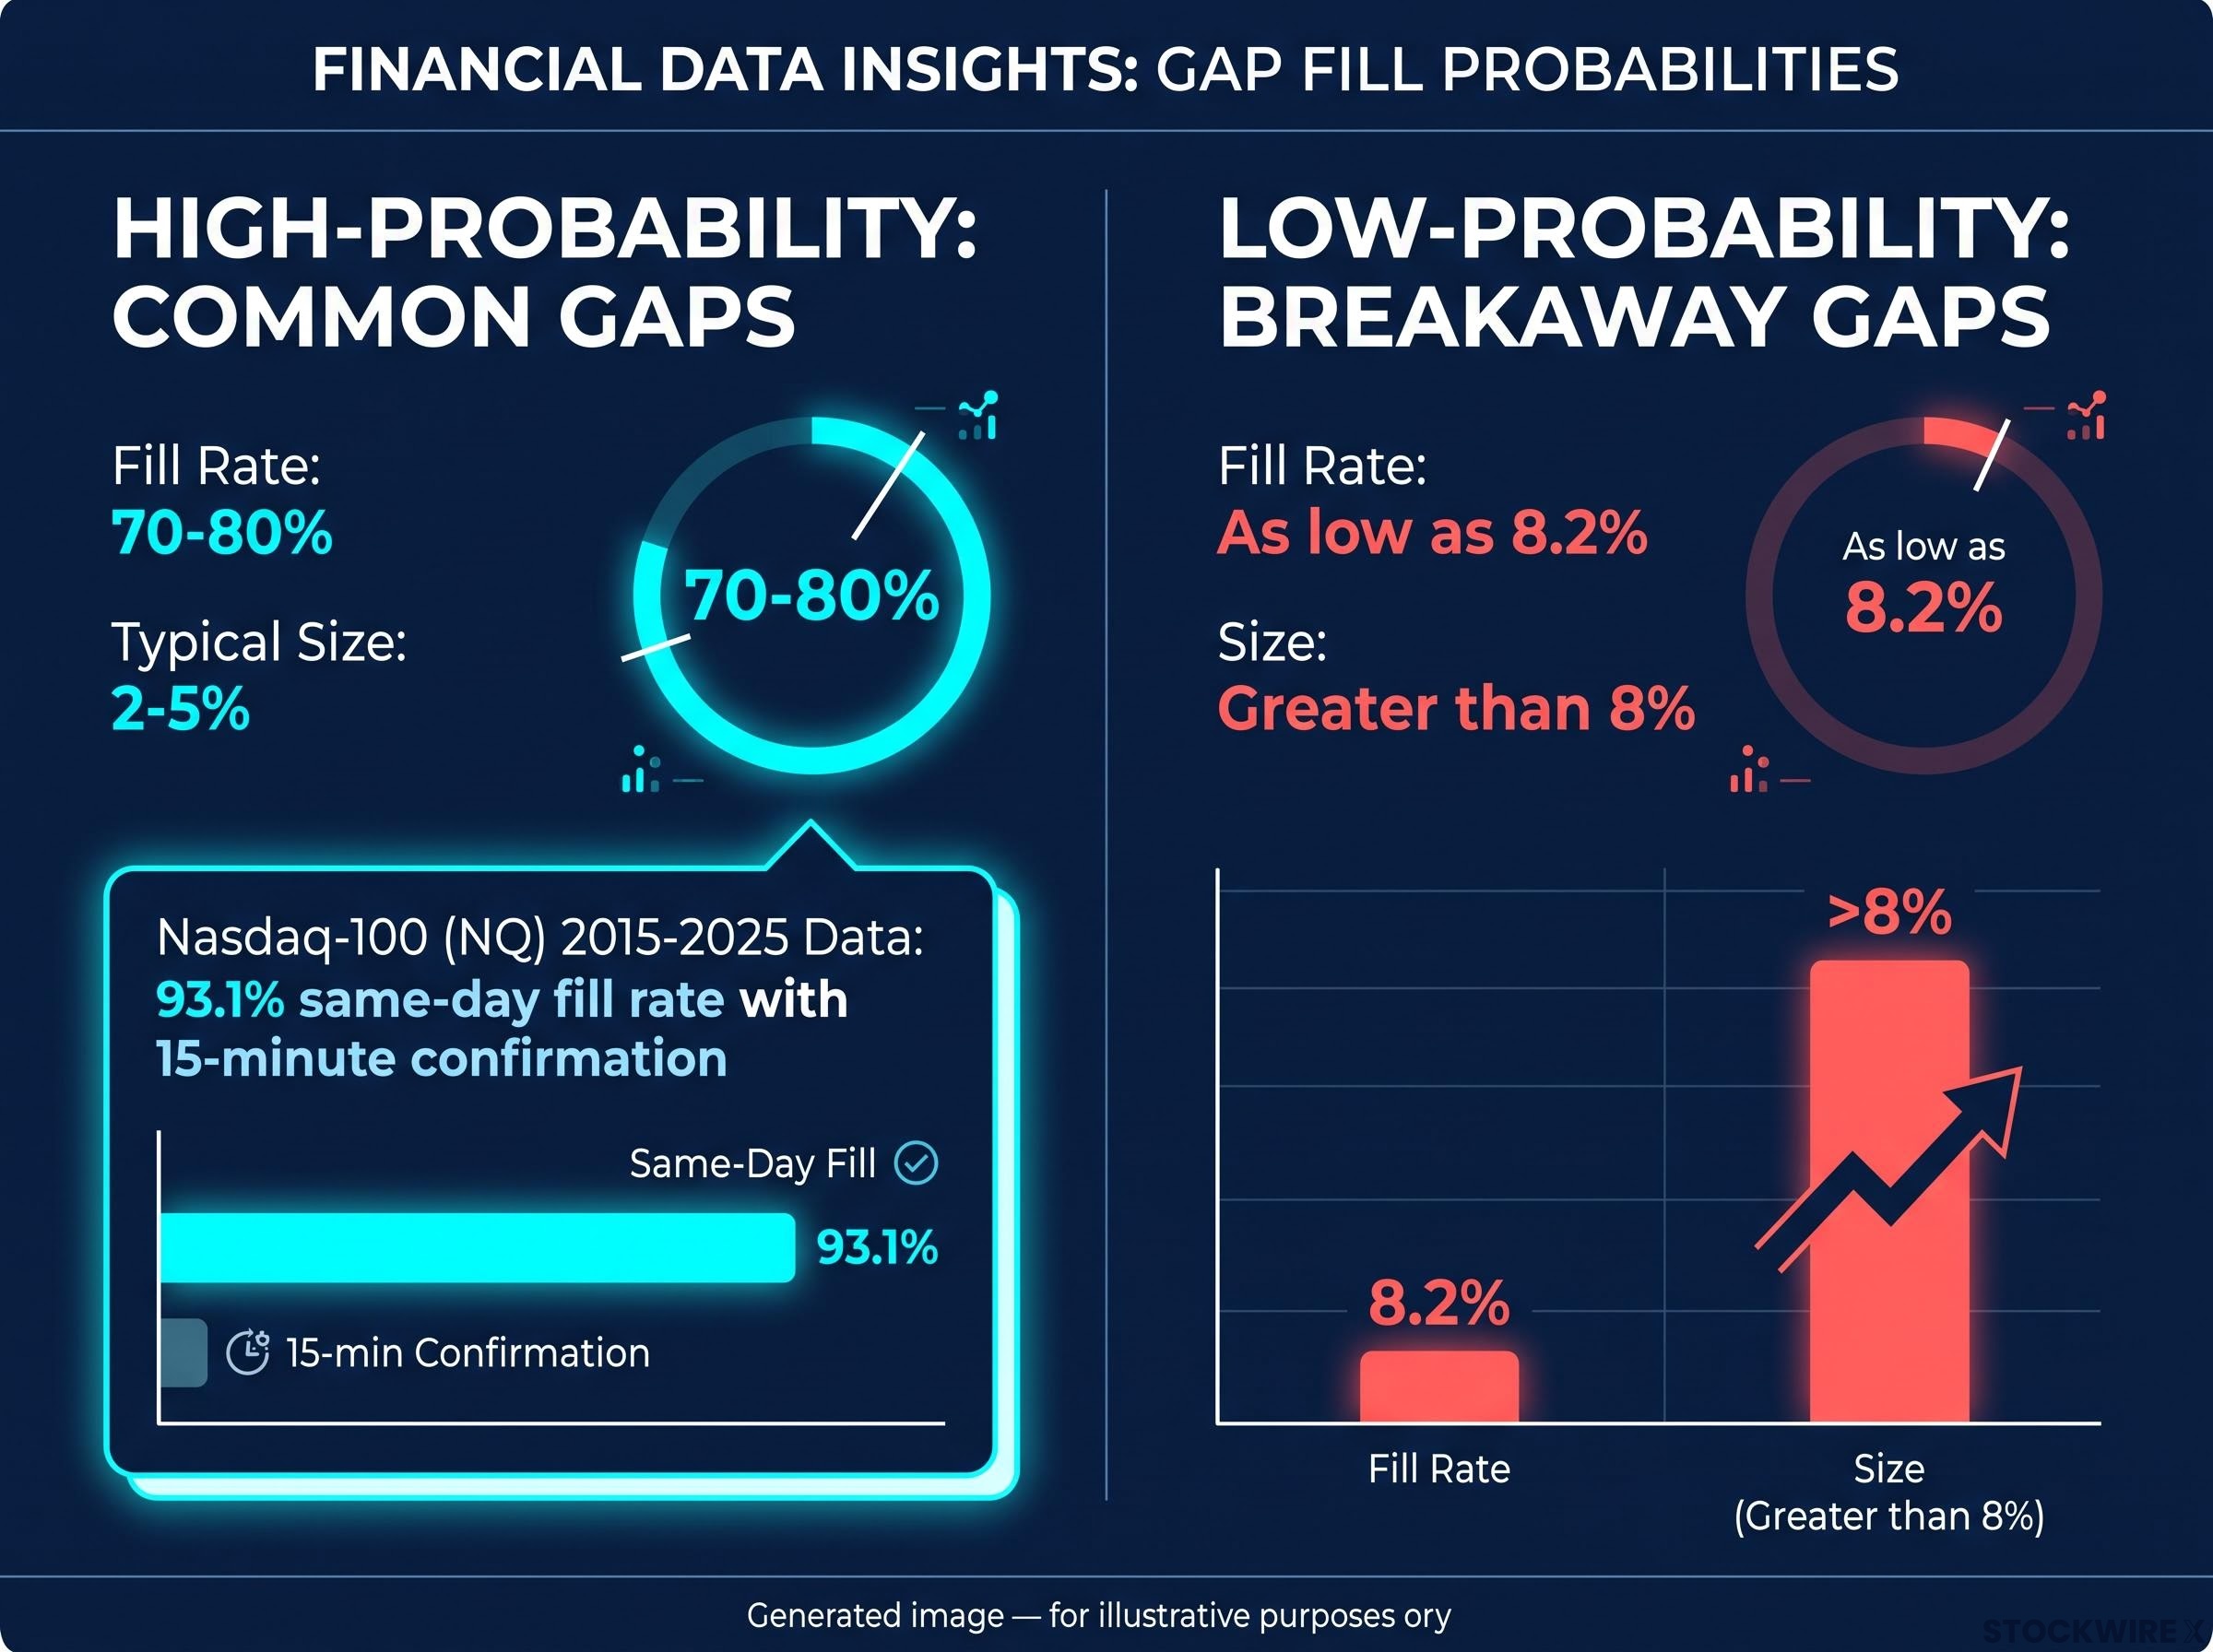
Breakaway and exhaustion gaps are the trap. These are large, catalyst-driven moves, gaps greater than 8% fuelled by earnings beats, mergers, or structural breaks, and their fill rates fall as low as 8.2%. They tend to extend the trend rather than reverse it, producing what traders call gap-and-go days. In strong trending markets, gaps stick; in choppy markets, they fill.
Before entering any gap-fill trade, run through this checklist:
- Gap size: Small gaps of 2-5% favour a fill; gaps above 8% often do not.
- Market regime: Sideways or choppy conditions favour fills; strong trends favour continuation.
- Catalyst strength: A weak or absent catalyst supports mean reversion; a powerful one argues against it.
- Early price action: A first 15-minute candle moving toward the fill confirms the setup.
Tactically, for gap-ups greater than 5%, some traders fade the move by taking a short position targeting the prior close. For gap-downs greater than 2%, they buy the dip if the negative catalyst looks weak. The point is selectivity: apply the technique to every gap you see and you will lose money, apply it only where the conditions line up and the statistics start working for you.
Risk management for gap-fill trades: what can go wrong and how to contain it
The failure modes of gap-fill trading are specific, and they are worth naming because they are not the generic risks you hear about everywhere.
- Gap risk: The market opens far beyond your pre-set stop-loss, skipping it entirely and filling you at a much worse price. This produces losses larger than you planned and sudden margin pressure in leveraged accounts.
- False fills: Price begins closing the gap, drawing you in, then reverses sharply. The move looked like a fill and turned into a loss.
- Small-cap liquidity traps and short squeezes: In lower-cap, high-beta names, a gap does not guarantee enough volume for clean entries and exits, and event-driven gaps in high-short-interest stocks can turn into vicious squeezes.
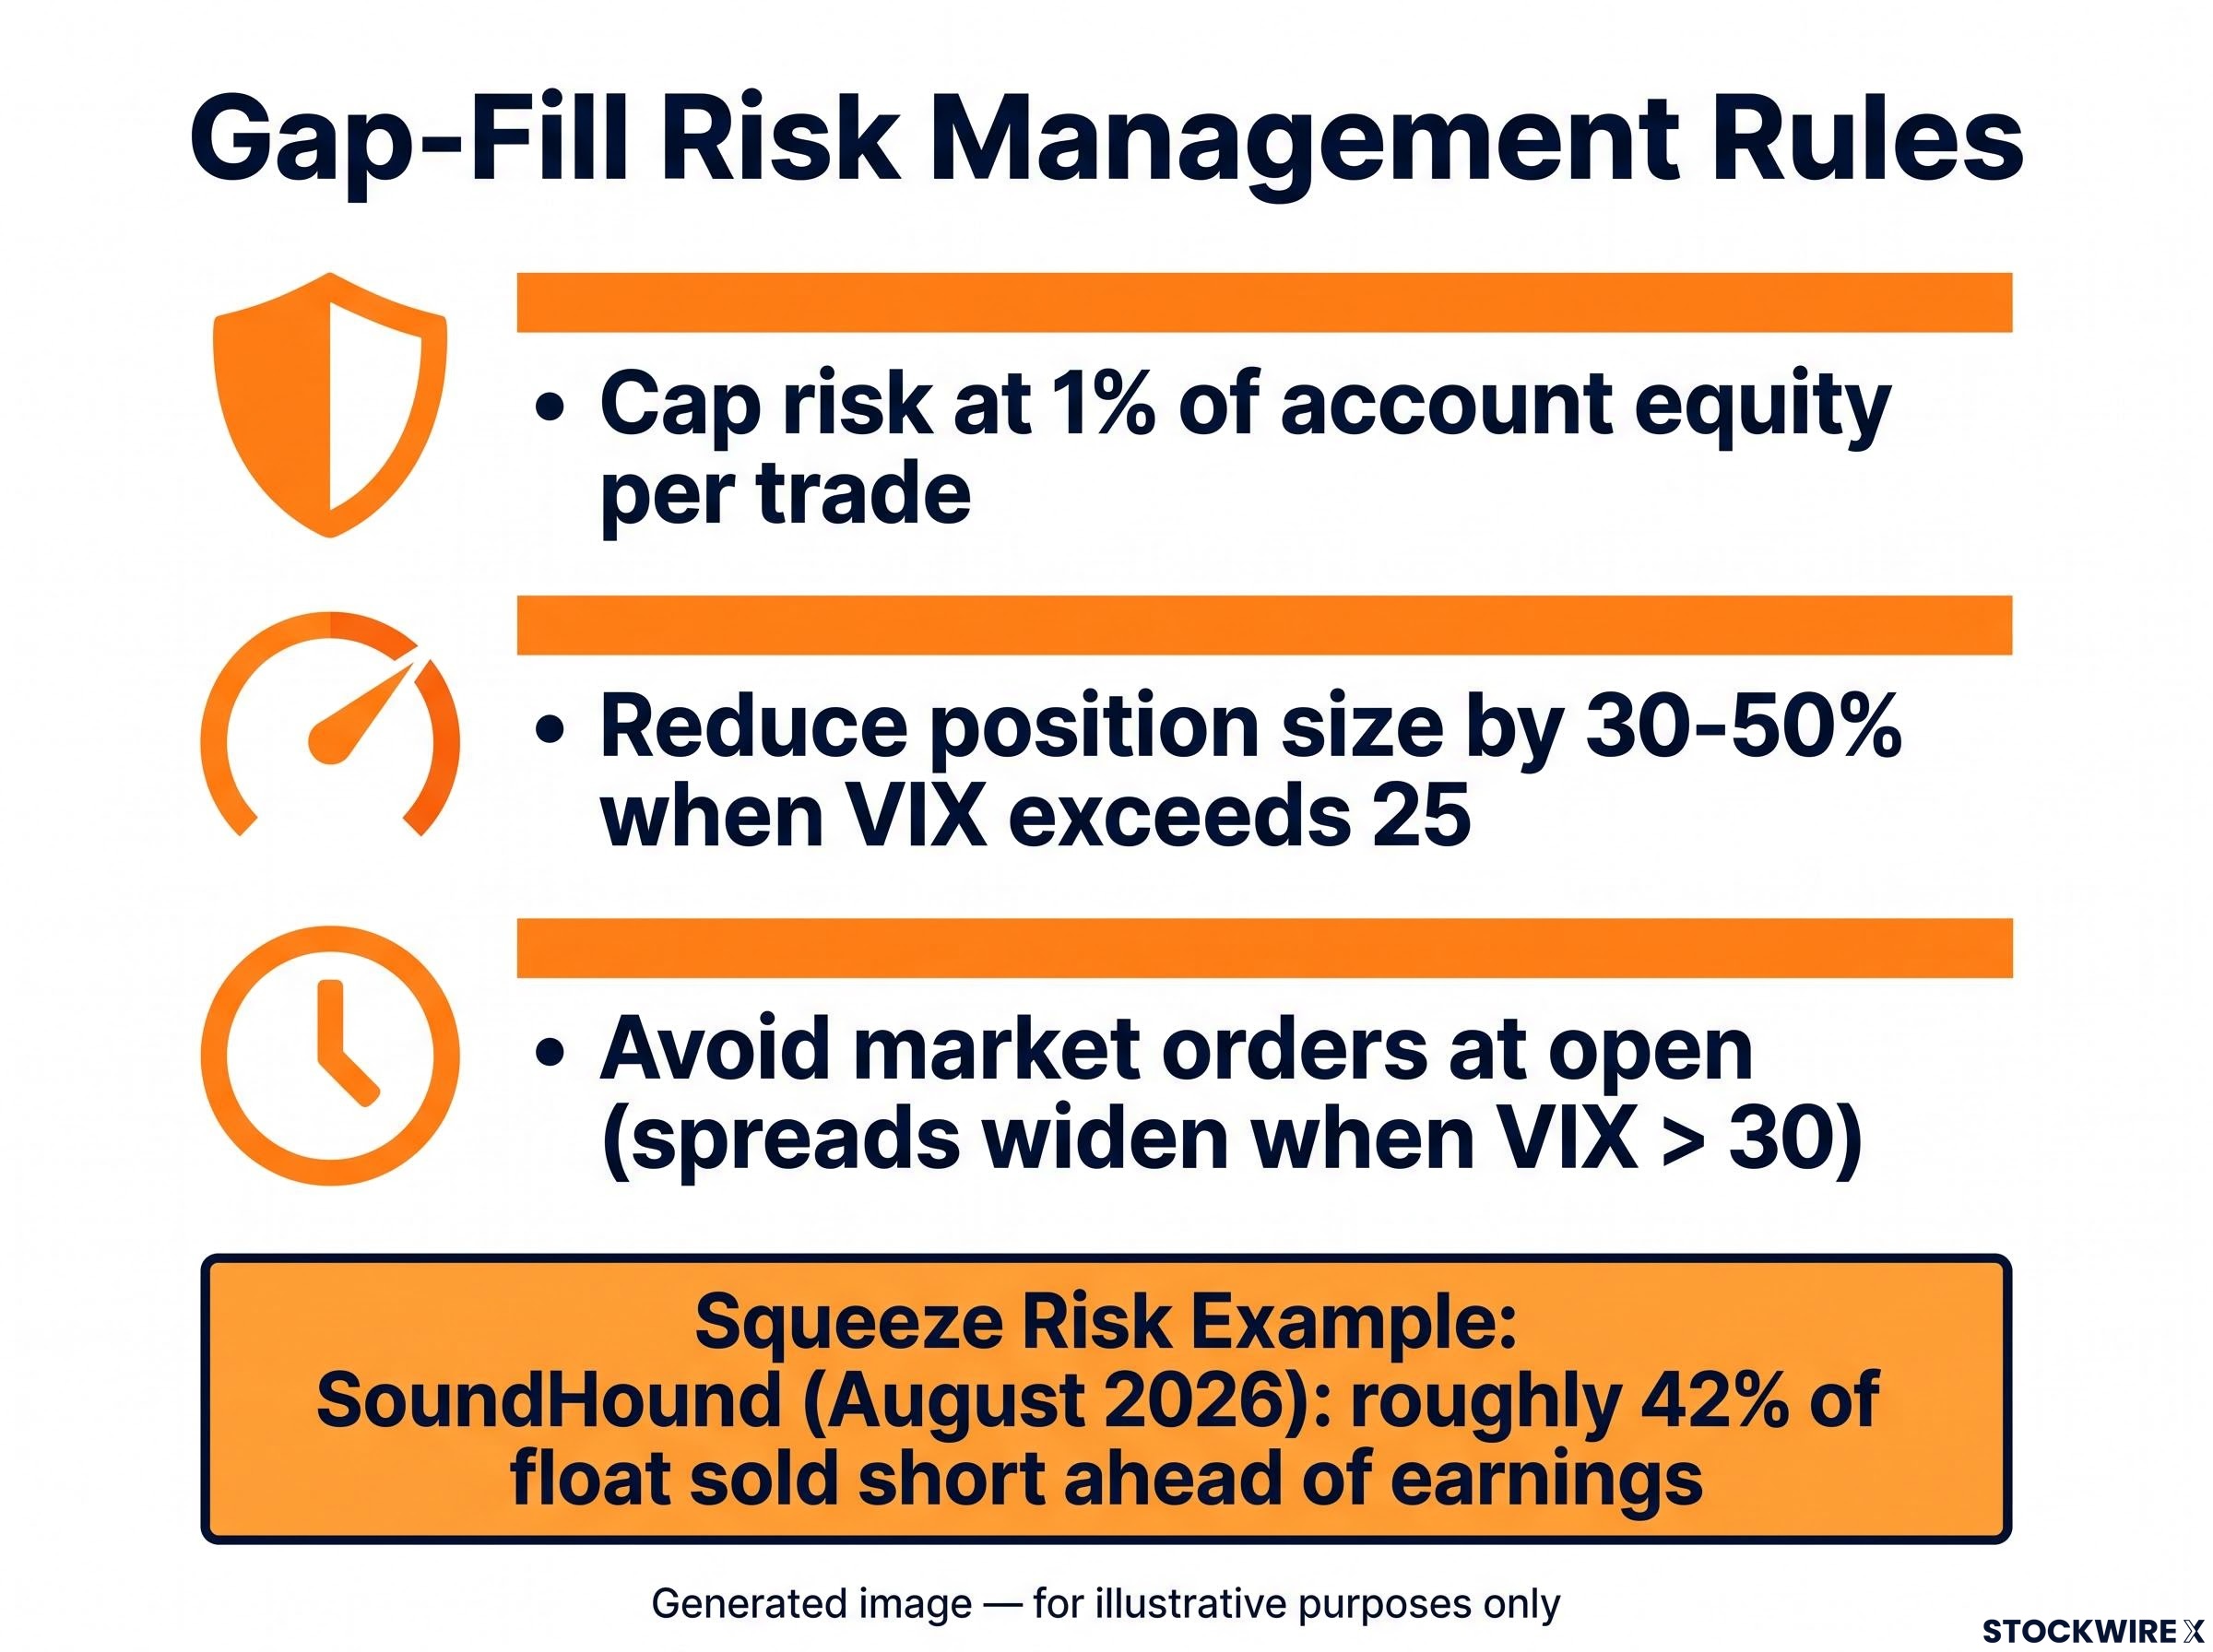
The SoundHound example from earlier makes the squeeze risk concrete. Roughly 42% of the float was sold short ahead of the August 2026 earnings release. Fading that upward gap as a short would have exposed you to forced covering that drove price well beyond any sensible stop, precisely the scenario where gap risk and squeeze risk compound.
Fixed-dollar-risk position sizing resolves the practical gap between knowing a resistance level and knowing how many shares to trade: once the stop is placed at the gap boundary, the formula divides dollar risk by the distance between entry and stop, removing all discretion from the sizing step.
The three rules that make gap-fill trading sustainable
These are operational standards, not optional refinements. Follow them in order.
- Cap risk at 1% of account equity per trade. This ensures that the occasional large, unfilled gap that moves against you does not wipe out the accumulated gains from your smaller wins.
- Reduce position size by 30-50% when the VIX exceeds 25. Gap-fill statistics become unreliable in high-volatility regimes, so smaller positions keep the outliers survivable.
- Avoid market orders in the opening minutes. Pre-plan your exits around known volatility events like earnings, because spread widening during VIX spikes above 30 severely hampers execution and compounds gap risk.
Taken together, the 1% cap and the VIX-based sizing rule do one job: they keep you in the game through the statistical outliers, the large unfilled gaps that go against you, long enough to benefit from the high fill rates that show up in normal conditions.
This article is for informational purposes only and should not be considered financial advice. Investors should conduct their own research and consult with financial professionals before making investment decisions.
Without these guardrails, a single catastrophic loss erases multiple winning trades. With them, the methodology becomes a repeatable practice rather than a lottery.
Applying gap-filling analysis with the discipline the methodology demands
The through-line of everything above is simple. Gap-filling works because of market structure, liquidity rebalancing, mean reversion, and psychological resistance, not because charts hold any mystical power. That structural grounding is exactly what justifies using the technique selectively rather than everywhere.
The trader who applies it well scans for common gaps in appropriate conditions, waits for early price action to confirm, sizes positions conservatively, and steers clear of event-driven gaps in high-short-interest small caps. The trader who misapplies it fades every gap regardless of size, catalyst, or market regime, and pays for it.
Trading expectancy, calculated as win rate multiplied by average win minus loss rate multiplied by average loss, is the metric that tells you whether a gap-fill strategy has a genuine mathematical edge across a meaningful sample rather than a run of fortunate fills in a cooperative market regime.
The variable that separates a high-probability setup from a low-probability one is context, not luck. A common gap in a sideways market fills 70-80% of the time; a breakaway gap on a strong catalyst fills as little as 8.2% of the time.
You now have the context-reading skills to tell those apart, and the three case studies show how the same lens produces a short, a long, or both depending on the gap.
Pull up a chart you are already watching. Find any visible gaps, and ask whether they meet the high-probability criteria this article laid out. That question, asked consistently, is the whole discipline.