How to Apply the Dividend Discount Model to ASX Bank Shares
28 mins ago

The S&P 500 crossed above 7,400 in mid-May 2026, reaching all-time highs roughly ten weeks into an active US military conflict with Iran. No final resolution is in sight. For investors who sold during the March drawdown, that number stings.
The Iran conflict triggered an 8-10% drawdown from late-February highs, pushing markets toward correction territory and shaking confidence that had only recently rebuilt following the 2025 pullback. The fear was intuitive: a shooting war, Strait of Hormuz disruptions, oil above $100, and a ceasefire that arrived fragile and remains fragile. Yet the market disagreed with the fear trade, and it did so quickly.
This analysis examines why the March selloff fits a well-documented historical pattern of geopolitical conflict and equity market behaviour, what the oil price signal actually means for US equities, why the political calendar creates structural pressure toward resolution, and what all of this means for investors deciding whether to stay invested or step aside.
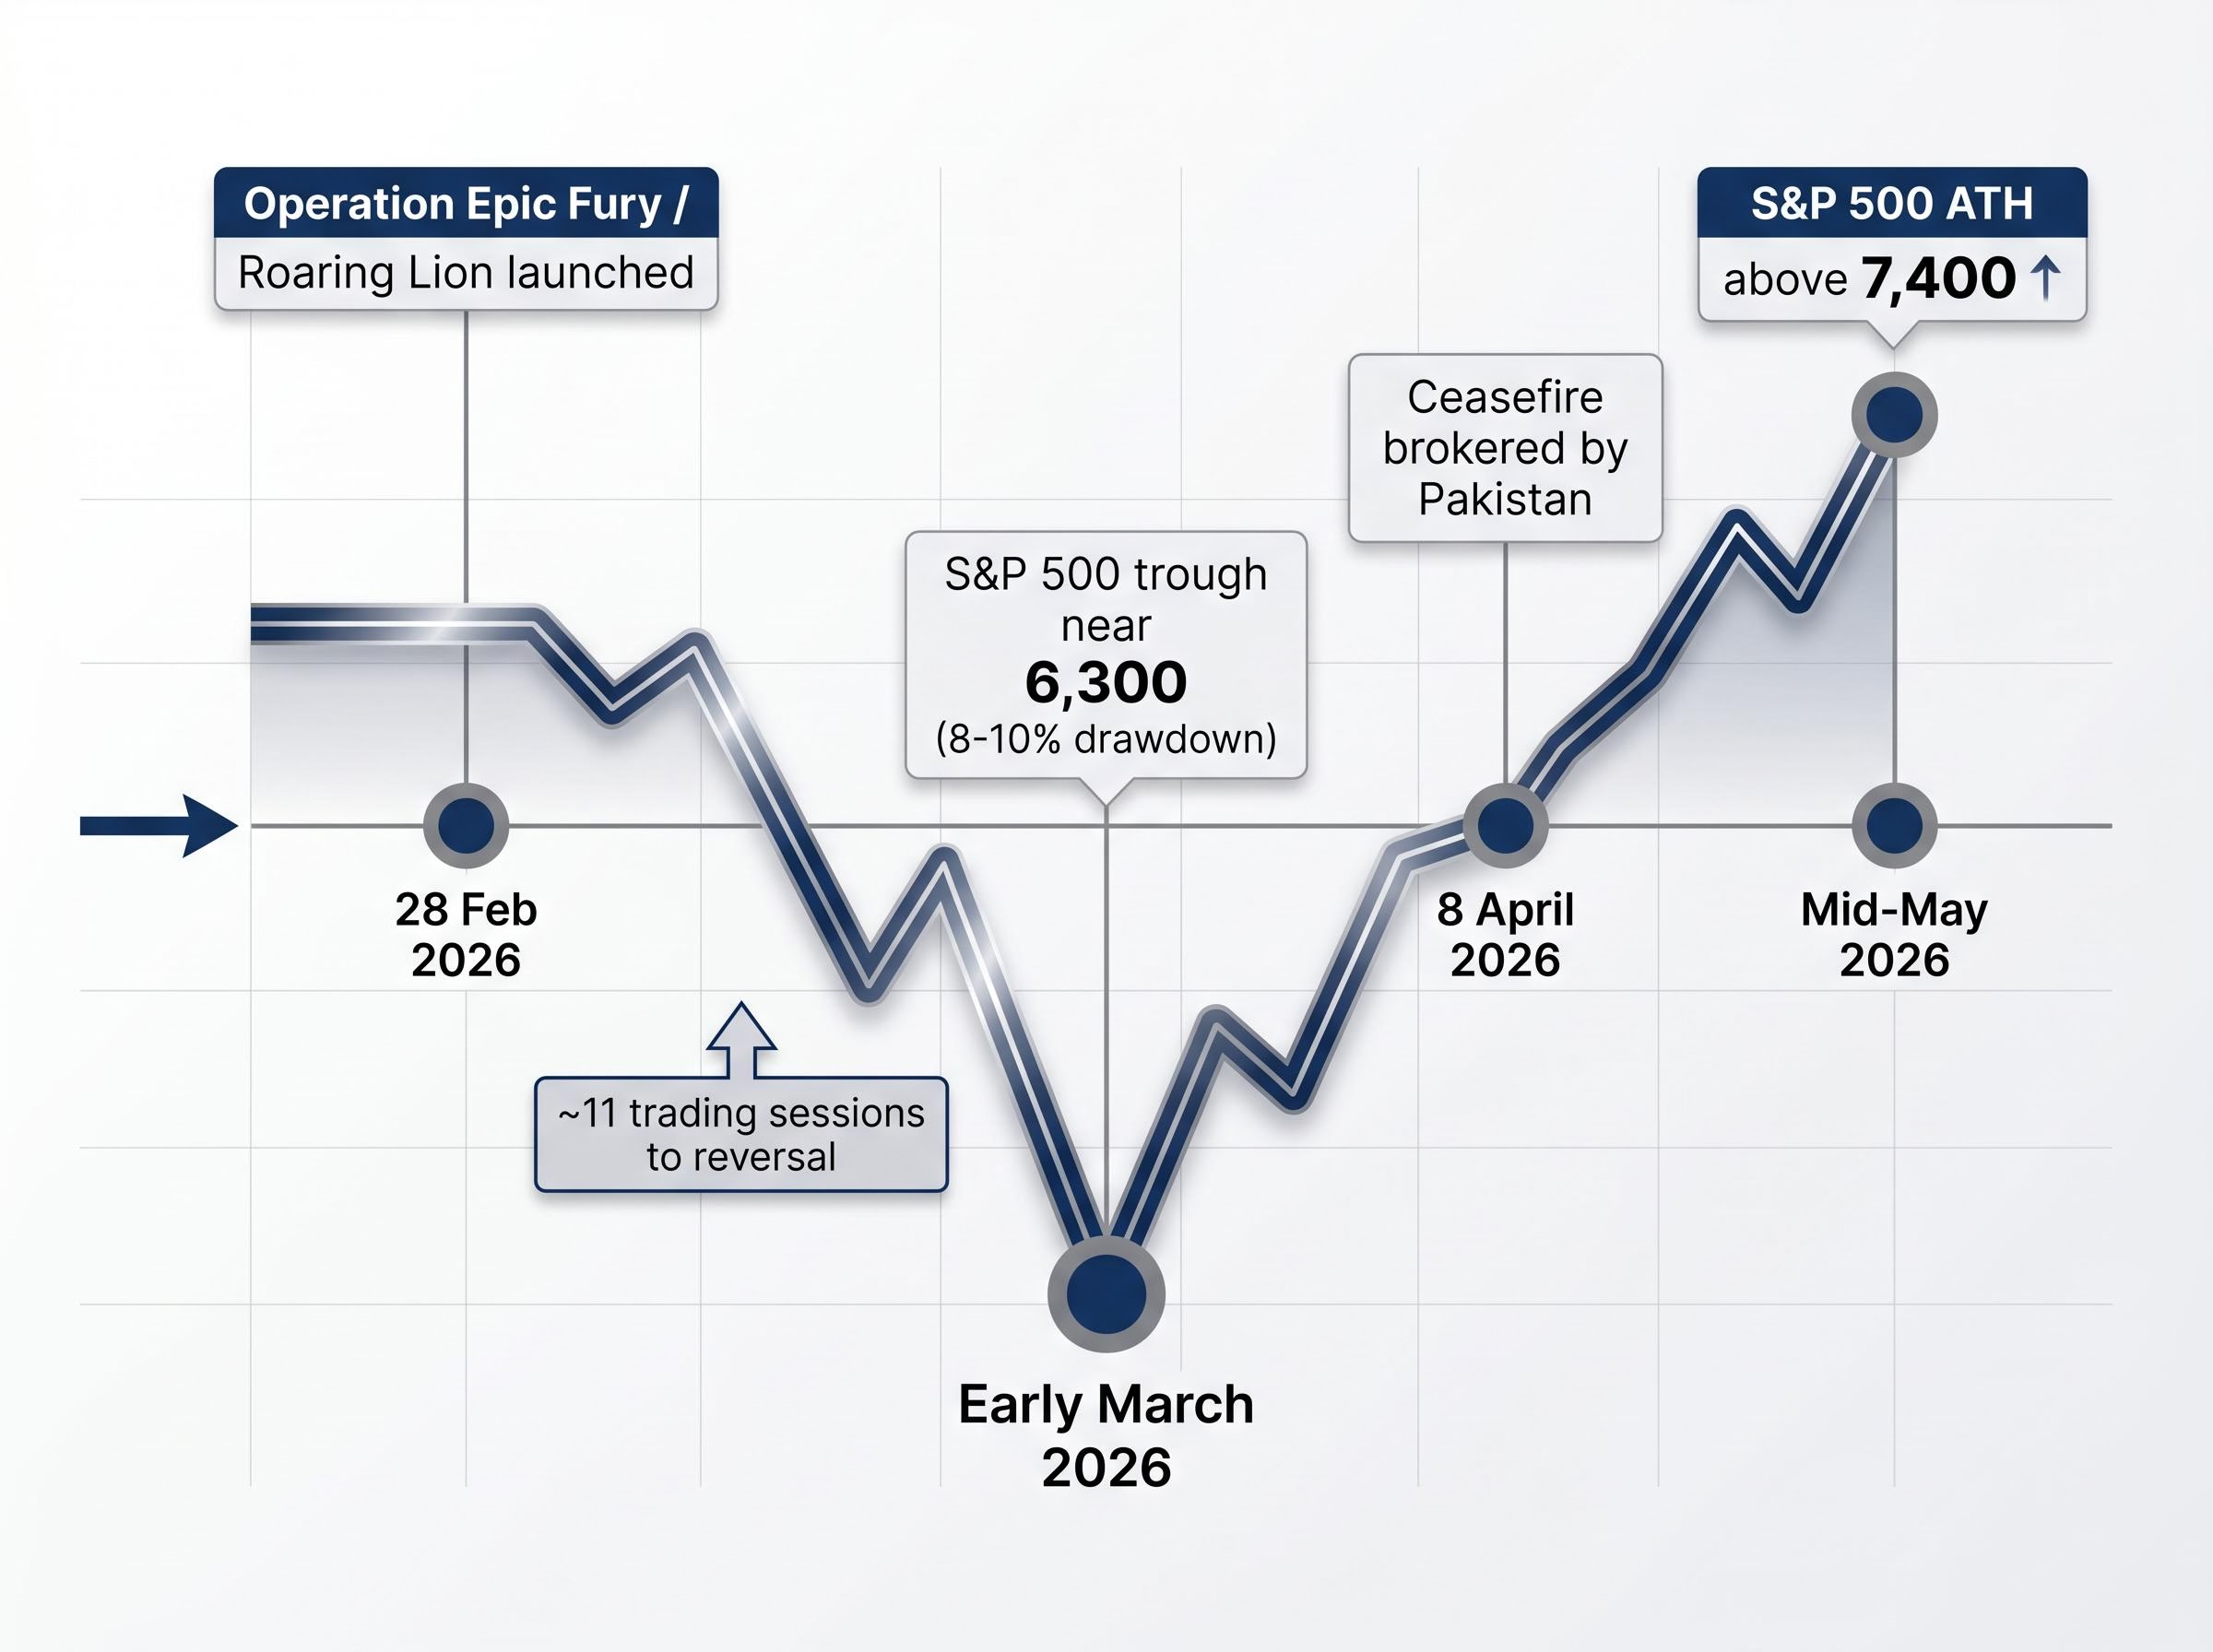
The sequence matters. Operation Epic Fury / Roaring Lion launched on 28 February 2026 with coordinated US and Israeli strikes on Iranian nuclear and military facilities, regime infrastructure, and targets that ultimately included Supreme Leader Ali Khamenei. Within days, the S&P 500 had fallen approximately 8-10% from its pre-war highs, with the trough landing near 6,300 in early March.
The reversal was sharp. Within roughly 11 trading sessions of the trough, the S&P 500 had begun a sustained move higher. By mid-May, with diplomatic talks still ongoing in Islamabad and no final resolution reached, equities sat at record levels.
JPMorgan market takeaways (24 April 2026): “Why Are Stocks at Record Highs With No Iran Resolution?”
That question captures the central puzzle. An active, unresolved conflict with a fragile ceasefire, ongoing Strait of Hormuz disruptions, and oil well above pre-war levels, yet the market moved decisively in one direction. Fisher Investments characterised the March decline as sentiment-driven rather than fundamentals-driven, making it a recognisable type of event rather than a structural market break. The distinction between those two categories is what separates investors who locked in losses from those who rode the recovery.
The 2026 Iran conflict is not the first time US equities have sold off sharply on a geopolitical shock and recovered before the conflict ended. The pattern is documented across decades and conflict types.
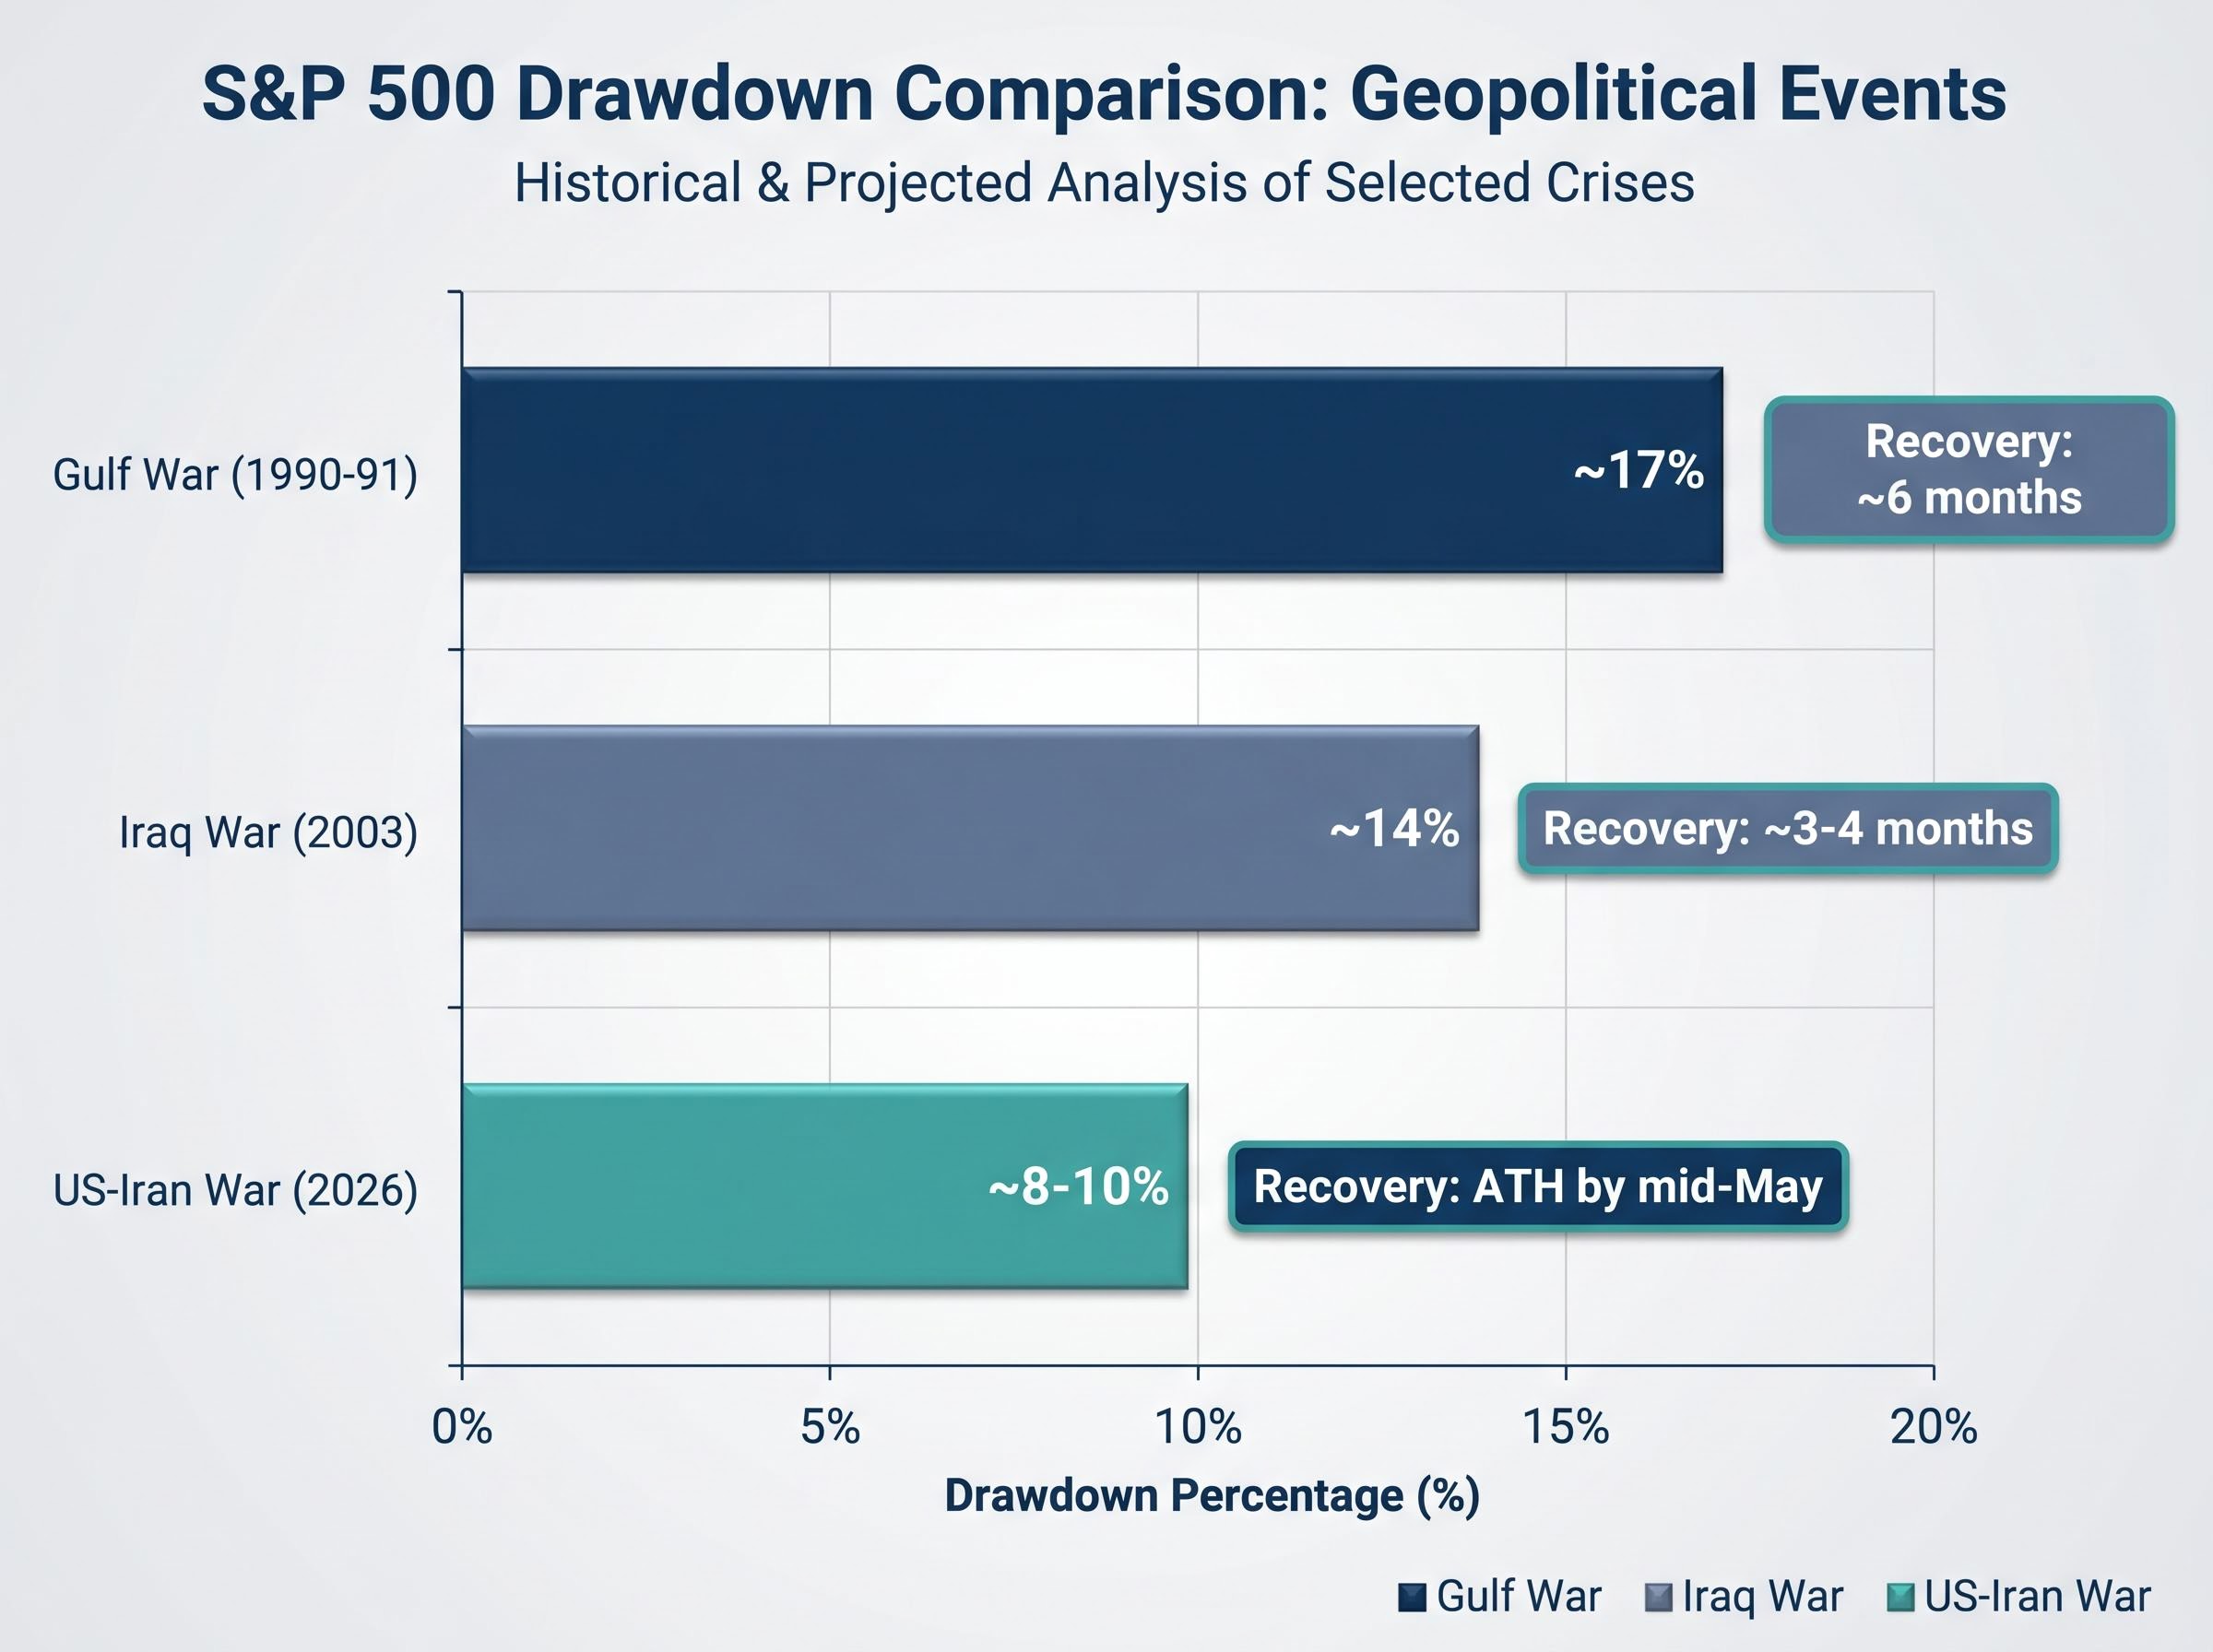
Long-horizon studies from Vanguard, Fidelity, and J.P. Morgan Asset Management have consistently found that geopolitical shocks produce initial sharp drawdowns followed by recovery, typically within 6-12 months, provided the shock does not trigger a broader economic recession. The Gulf War (1990-91) and the Iraq War (2003) are among the most frequently cited precedents: both generated temporary equity drawdowns, and both saw full recoveries within that window.
BlackRock Investment Institute has reiterated a consistent position: major geopolitical events tend to have short-lived effects on broad equity indexes unless they materially alter economic fundamentals.
| Geopolitical Event | Year | Approx. S&P 500 Drawdown | Approx. Recovery Timeframe |
|---|---|---|---|
| Gulf War | 1990-91 | ~17% | ~6 months |
| Iraq War | 2003 | ~14% | ~3-4 months |
| US-Iran War | 2026 | ~8-10% | ~11 trading sessions to reversal; ATH by mid-May |
The pattern is not a guarantee. But its consistency across different conflict types, different decades, and different economic backdrops gives investors a rational basis for distinguishing between fear-driven volatility and genuine structural threats to equity markets.
For investors wanting the full quantitative case behind this pattern, our dedicated guide to stock market behaviour during conflict examines 60 years of S&P 500 data across a documented three-phase recovery model and identifies the specific conditions, particularly sustained oil-shock duration and recession probability, that have historically extended drawdowns beyond the typical 6-12 month window.
The counterargument writes itself. Khamenei was killed. The Strait of Hormuz was disrupted. More than 12 million barrels per day of oil supply were affected. This is more severe than many historical precedents.
The Fisher Investments framework addresses this directly: the severity of the conflict events is not the primary variable. The primary variable is whether the shock triggers a recession. If corporate earnings and underlying economic growth remain intact, the drawdown is a sentiment event, not a structural one, regardless of how severe the headlines become.
The S&P 500’s actual behaviour has already answered this question empirically. All-time highs by mid-May, with the conflict still unresolved, suggest the market has assessed the fundamental damage as contained.
Oil is the most visible mechanism by which a Middle East conflict reaches the real economy, and the concern is not imaginary. Strait of Hormuz disruptions affecting 12+ million barrels per day represent one of the largest supply shocks on record. As of mid-May 2026, WTI crude was trading at approximately $95-105 per barrel and Brent crude at approximately $101-107 per barrel.
According to the IEA Oil Market Report (May 2026), the supply disruption from the Iran conflict has created sustained upward pressure on global oil prices since 28 February 2026.
Elevated oil is an inflationary headwind. It raises input costs, compresses margins for energy-intensive businesses, and squeezes consumer spending. None of this is trivial. The relevant question, however, is whether elevated oil acts as a market-ending catalyst. The historical record suggests it does not, provided broader economic fundamentals remain intact.
Oil prices have historically normalised through three mechanisms:
Fisher Investments’ analysis places oil price normalisation within the same 6-12 month recovery window observed for equity drawdowns following conflict onset. For US investors, elevated oil is a concrete, visible concern that makes the fear trade feel rational. Understanding how oil dynamics have historically resolved reduces the temptation to treat a commodity spike as a signal that equity markets are structurally impaired.
S&P 500 returns after oil crosses $100 have varied widely across prior episodes, from a severe decline in 2008 to modest positive returns in 2011, a dispersion that reinforces why oil price level alone is an unreliable predictor of equity market direction and why the recession transmission question is the more consequential variable to monitor.
The market may be pricing something most retail investors have not yet fully incorporated: the US midterm election cycle creates structural pressure toward conflict resolution.
Fisher Investments’ analysis argues that the Trump administration has strong political incentives to pursue rapid resolution of the Iran conflict ahead of the 2026 midterm elections. Prolonged military engagement, elevated oil prices, and voter fatigue from conflict headlines represent a political liability that the administration has every incentive to contain before November.
The resolution incentive is not a prediction that the conflict will end cleanly. It is an observation that identifiable political forces are working against a prolonged, open-ended military engagement.
Post-midterm equity performance has been positive in every one of the 19 US midterm cycles recorded since 1950, a record that spans multiple recessions and financial crises, with the mechanism being uncertainty resolution rather than partisan outcomes, as settled election results allow sidelined capital to redeploy regardless of which party gains seats.
Fisher Investments’ research documents a historical tendency for equities to perform well in the period surrounding and following US midterm elections, a pattern sometimes referred to as the midterm miracle. The mechanism is straightforward: midterms typically produce divided government, which reduces the likelihood of significant new legislation, which in turn reduces the policy uncertainty that markets dislike.
The Iran conflict has added a layer to this dynamic. The war-driven sentiment reset has recreated a wall of worry, a condition Fisher Investments views as supportive rather than threatening. Cautious investor positioning, combined with strong underlying fundamentals, is the type of divergence that has historically preceded the next leg of a bull market rather than a market top.
Before the Iran conflict, investor sentiment had warmed considerably following the 2025 correction. The war reversed that trajectory, resetting sentiment to a more cautious baseline. Standard measures of investor psychology, including the AAII Investor Sentiment Survey, the CNN Fear and Greed Index, and the NAAIM Exposure Index, provide the frameworks through which this reset is visible.
The wall of worry is a well-documented market dynamic: equity markets historically climb furthest when widespread scepticism keeps investor positioning cautious, reducing the crowding and complacency that typically precede market tops. The current environment fits this pattern. Subdued sentiment sits alongside an S&P 500 that has already recovered to all-time highs above 7,400.
Fisher Investments’ analysis frames the divergence between subdued investor sentiment and strong underlying fundamentals as a positive condition for continued bull market momentum, not a warning sign.
Three conditions Fisher Investments identifies as currently supporting continued advances:
The instinct to treat widespread pessimism as a signal to exit is understandable. The historical record suggests it is also costly.
The March 2026 selloff displayed the characteristics of a sentiment-driven drawdown, not a fundamentals break. That categorisation is not a matter of hindsight; Fisher Investments and other institutional voices identified it as such in real time, and the S&P 500’s behaviour since has confirmed the assessment.
The investor decision framework in this environment follows a clear sequence:
Fisher Investments’ bull market forecast remains intact despite short-term volatility. The case for staying the course is the historically supported default, though individual risk tolerance and time horizon remain personal variables that no broad-market analysis can resolve.
Investors looking to translate this framework into specific portfolio decisions will find our comprehensive walkthrough of geopolitical risk investing strategy, which covers the behavioural biases that cause reactive trading to underperform during high-attention conflict events, the institutional consensus recommendation on dollar-cost averaging through volatility, and a practical pre-action filter for separating systematic rebalancing from headline-driven reactions.
Investors who sold near the March trough and are now watching the S&P 500 above 7,400 face a specific cognitive trap: waiting for certainty before re-entering. Geopolitical conflicts rarely produce an all-clear signal. The ceasefire remains fragile. Talks are ongoing. Oil is still elevated. By every conventional measure of “clarity,” the situation is unresolved.
Yet the market is at record highs. The 11-trading-session recovery from trough illustrates how quickly the re-entry window closes after a sentiment-driven drawdown. The asymmetry is stark: the cost of missing the recovery has already exceeded the cost of enduring the drawdown for any investor who remained positioned through March.
The point is not that every investor should hold through every conflict. The point is that waiting for clarity that may never arrive carries its own measurable cost.
This article is for informational purposes only and should not be considered financial advice. Investors should conduct their own research and consult with financial professionals before making investment decisions. Past performance does not guarantee future results. Financial projections are subject to market conditions and various risk factors.
The 2026 US-Iran conflict has not materially altered the underlying economic and earnings fundamentals that drive long-term equity returns. That is the finding that every other section of this analysis supports, and it is the finding that matters most for investors sitting with a decision right now.
The framework is transferable. Sentiment versus fundamentals. Historical recovery patterns across conflict types. Oil price normalisation mechanics. Political resolution incentives tied to electoral calendars. These are not observations specific to Iran in 2026; they are analytical tools that apply to the next geopolitical shock, whenever it arrives and whatever form it takes.
Fisher Investments’ core thesis: The divergence between current subdued sentiment and strong underlying fundamentals represents the defining condition for the next leg of the bull market, supported by midterm cycle tailwinds, a sentiment reset that reduces complacency risk, and identifiable political pressure toward conflict resolution.
The second half of 2026 carries identifiable tailwinds. The conflict premium is transient. The fundamentals are not.
A sentiment-driven drawdown occurs when markets fall due to fear and uncertainty rather than deteriorating economic fundamentals like falling earnings or rising recession risk. In the case of the 2026 US-Iran conflict, Fisher Investments classified the 8-10% March selloff as sentiment-driven because corporate earnings and economic growth remained intact throughout.
Historical studies from Vanguard, Fidelity, and J.P. Morgan Asset Management consistently show that geopolitical shocks produce sharp initial drawdowns followed by recovery within 6-12 months, provided the shock does not trigger a broader economic recession. The 2026 US-Iran conflict saw the S&P 500 reverse within roughly 11 trading sessions of its trough and reach all-time highs by mid-May.
Oil above $100 per barrel is an inflationary headwind but has not historically been a reliable predictor of sustained equity market declines on its own. The more consequential variable is whether elevated oil prices trigger a recession; in cases where broader economic fundamentals remain intact, markets have historically absorbed oil price spikes without structural damage.
The wall of worry describes a market environment where widespread investor scepticism and cautious positioning coexist with strong underlying fundamentals, a combination that has historically preceded further market advances rather than tops. In mid-2026, subdued sentiment following the Iran conflict sat alongside an S&P 500 at record highs, fitting this pattern closely.
Geopolitical conflicts rarely produce a definitive all-clear signal, meaning investors waiting for full resolution before re-entering can miss the recovery entirely. The 2026 case illustrates this: the S&P 500 reached record highs above 7,400 while the ceasefire remained fragile and diplomatic talks were still ongoing, meaning the cost of missing the recovery had already exceeded the cost of enduring the drawdown.