Bull vs Bear Scenarios: How to Stress-Test Any Stock Price
19 mins ago
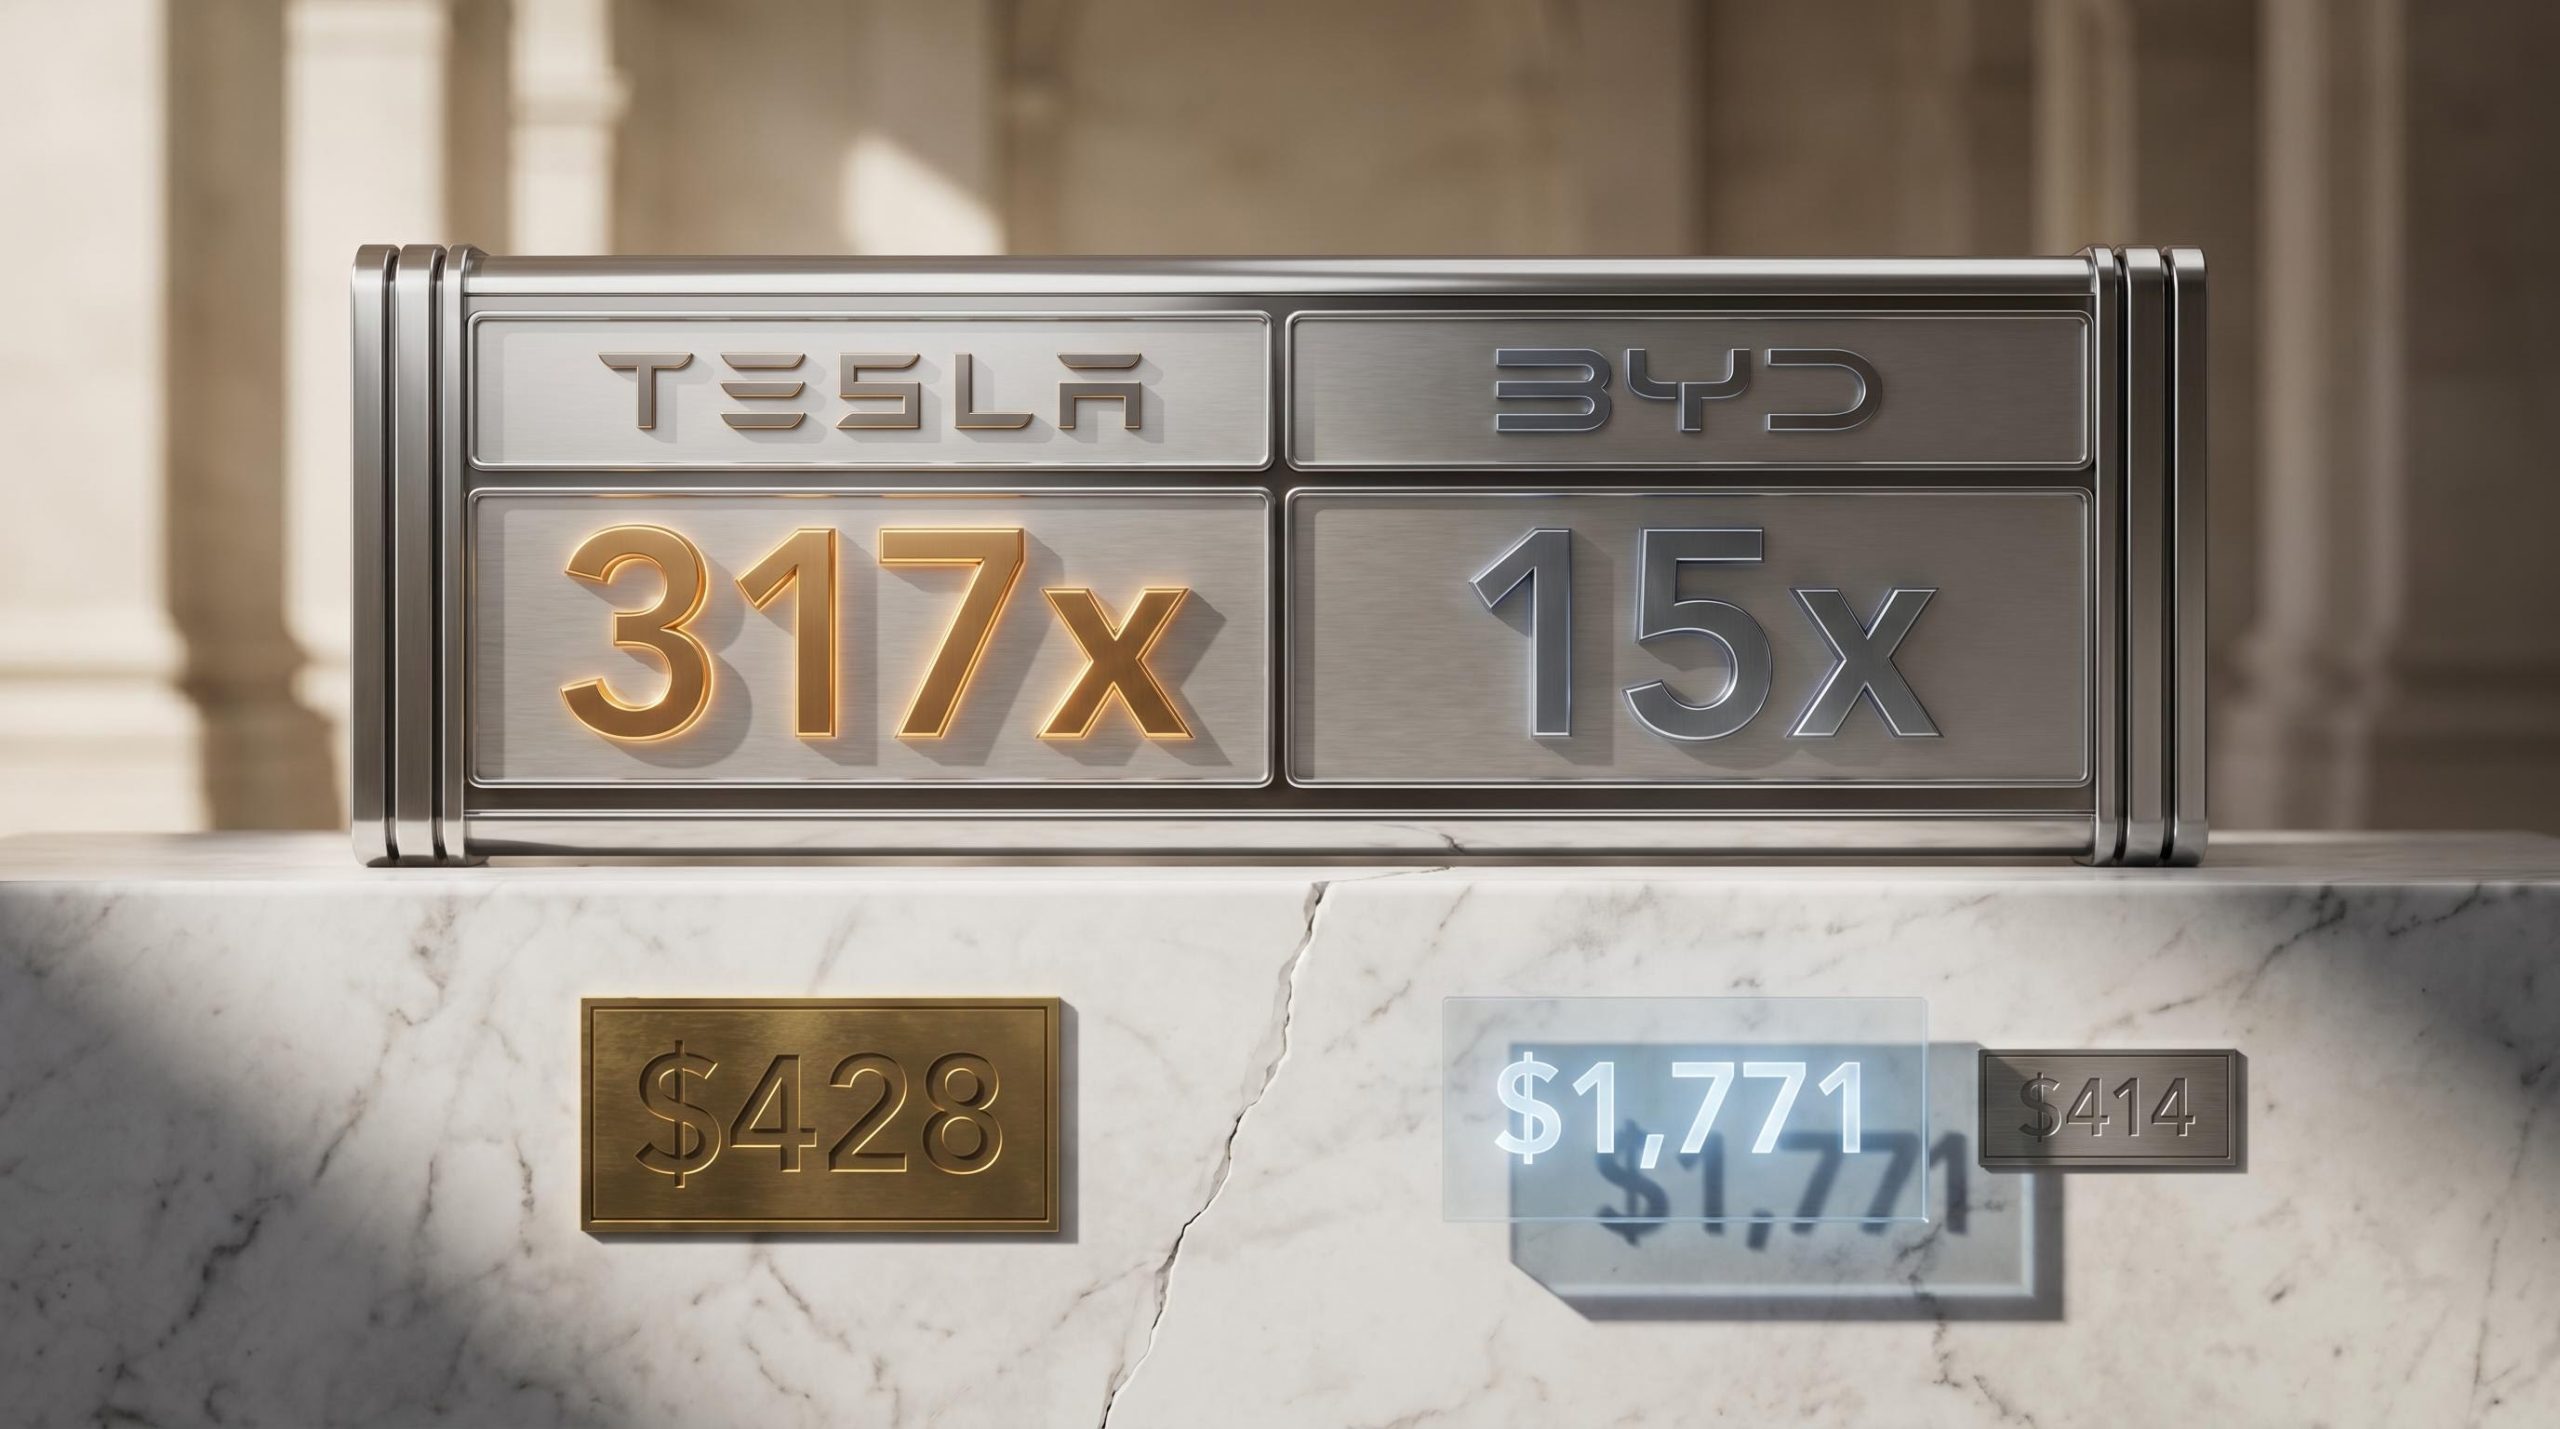
At roughly $428 per share in early May 2026, Tesla trades at approximately 317 times its trailing earnings. BYD, a pure-EV competitor, trades at around 15 times. That gap is not a pricing error. It is a bet.
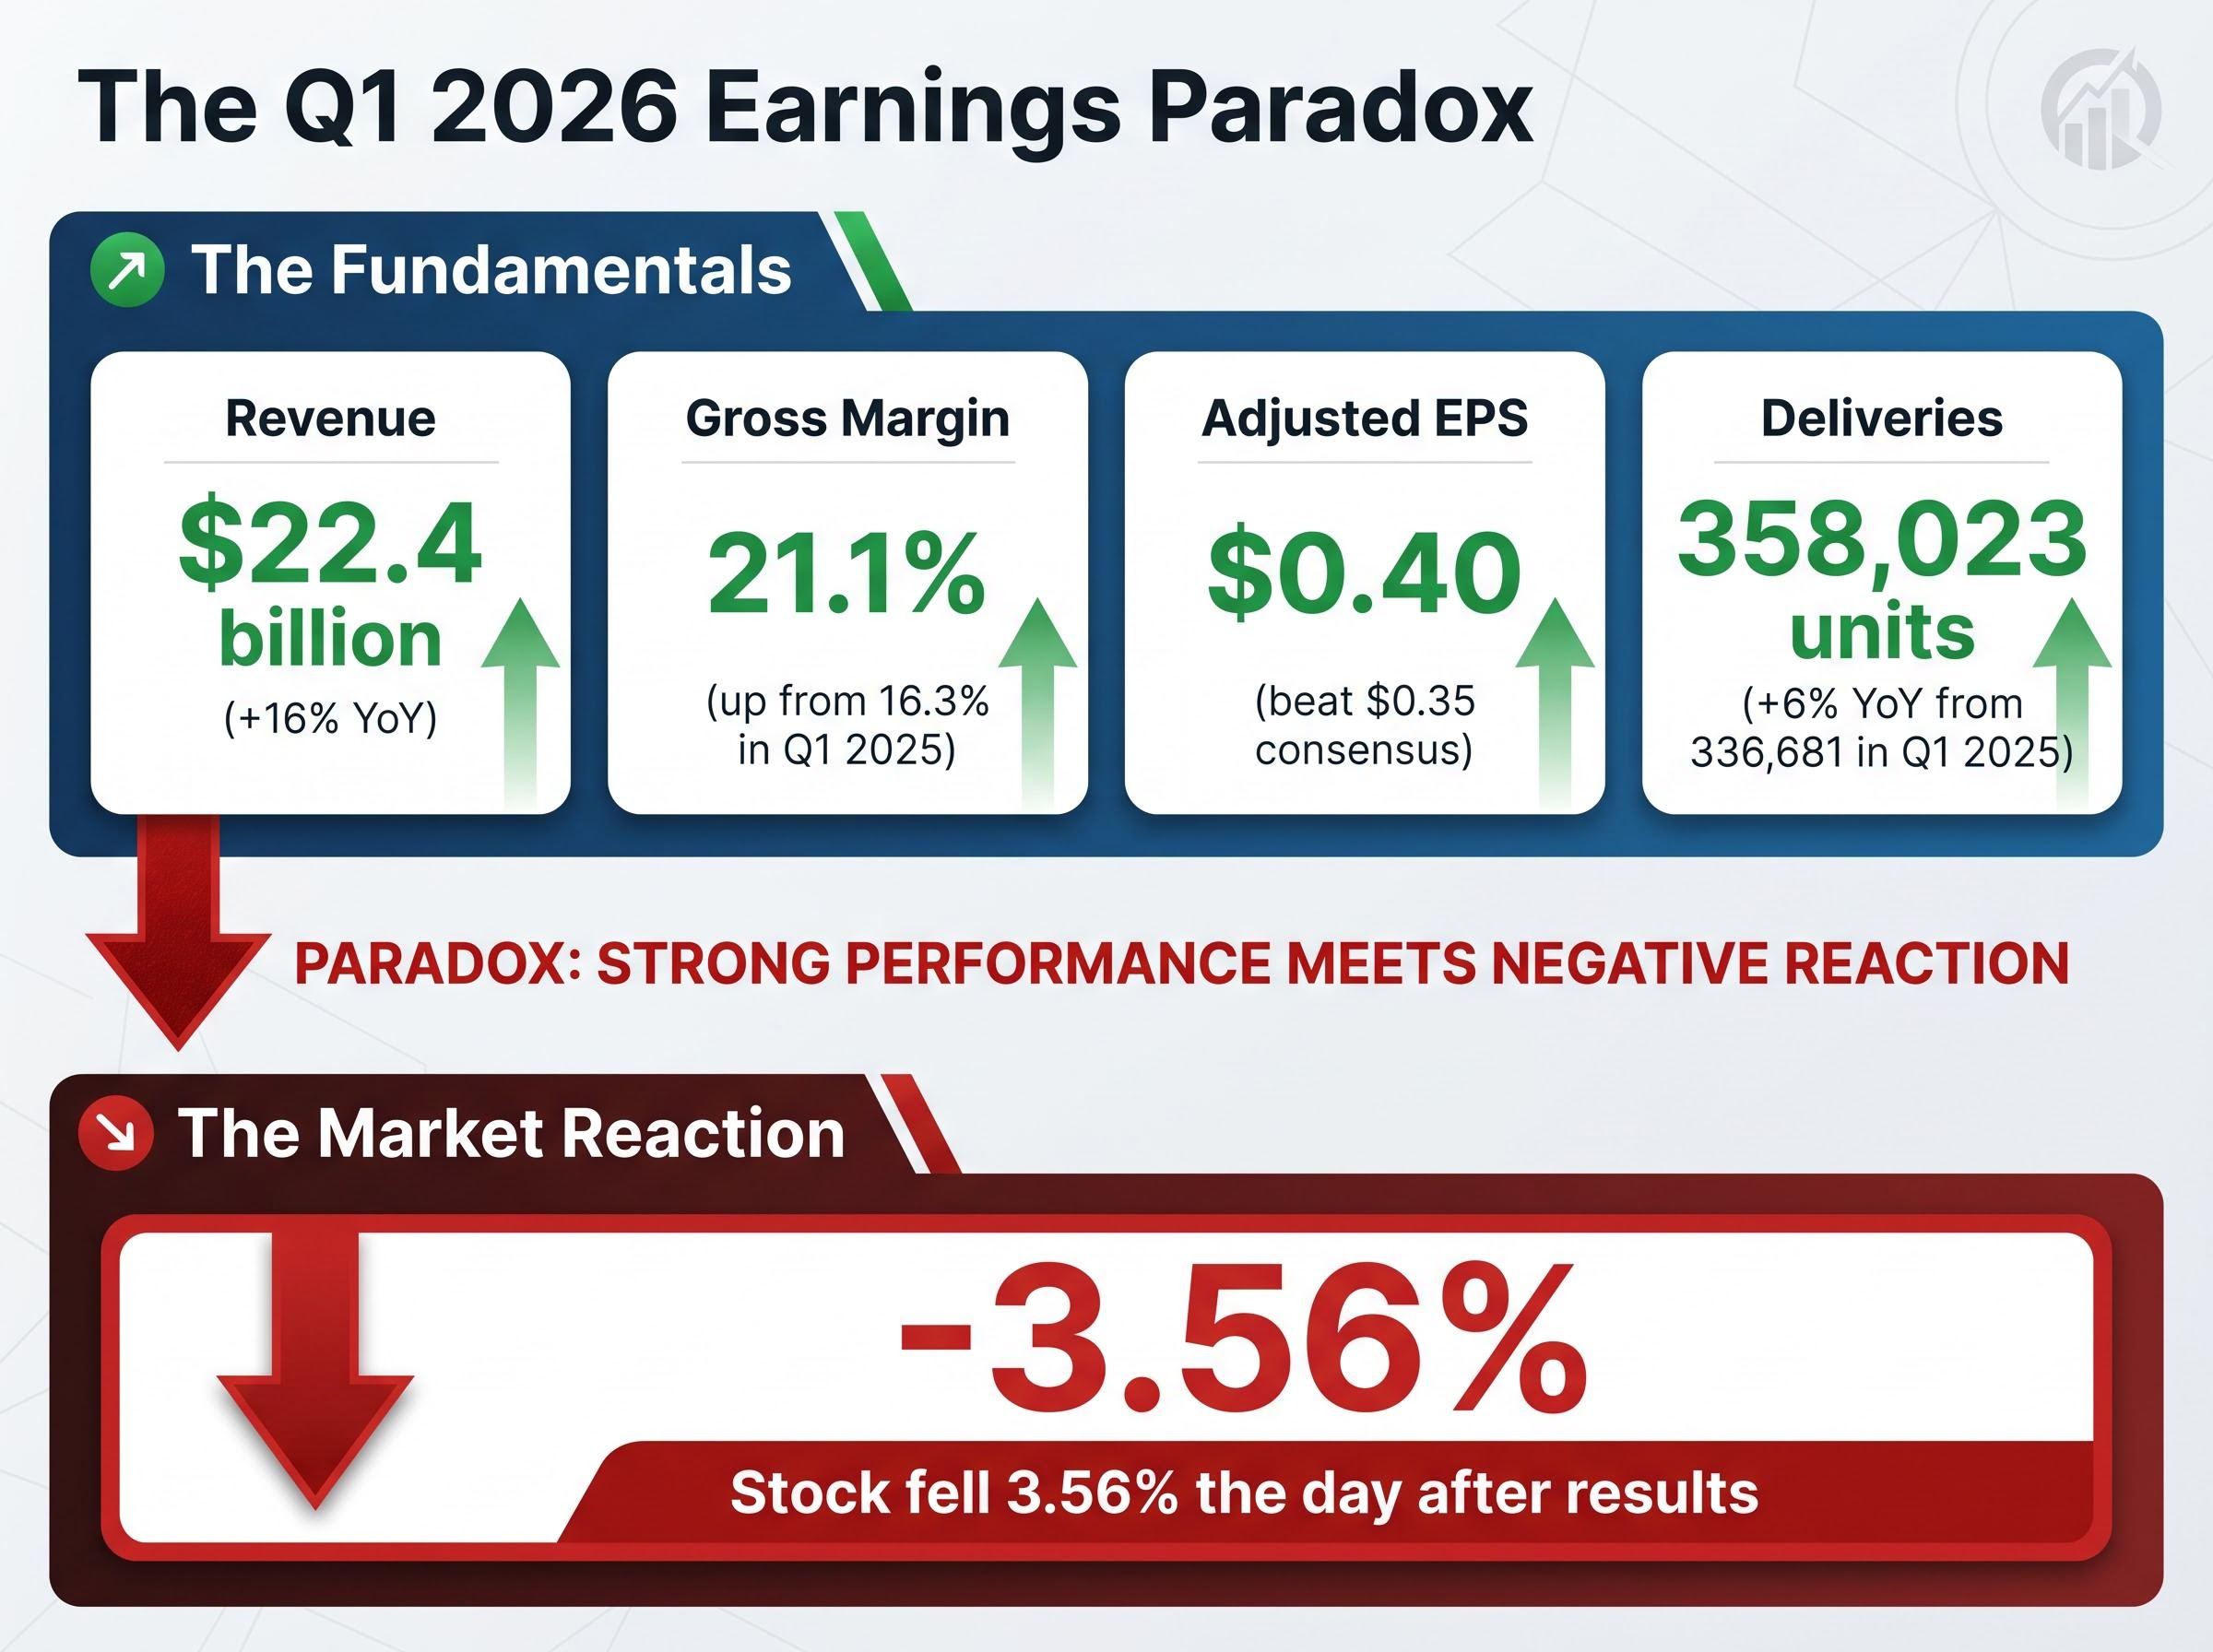
Tesla’s Q1 2026 earnings delivered a beat on revenue ($22.4 billion, up 16% year-over-year), a beat on gross margin (21.1%, the strongest in five quarters), and a beat on adjusted EPS ($0.40 vs. $0.35 consensus). The stock fell 3.56% the day after results. This apparent contradiction, outperforming on every reported metric and still declining, captures exactly why Tesla is one of the most instructive stock valuation analysis case studies available to investors right now.
This guide uses Tesla’s current bull and bear case frameworks as a practical lens for learning how to structure scenario-based valuation for any company whose stock price is running ahead of its current financials. Readers will leave with a repeatable methodology: how to build scenario inputs, how to interpret the spread between outcomes, and why the price paid at entry determines how much risk is actually being accepted.
Tesla’s trailing price-to-earnings ratio of approximately 317x is not an error or a sign of market irrationality. It reflects the market assigning probability-weighted value to a business that does not yet exist in revenue form: autonomous driving at commercial scale, a robotaxi network, and a humanoid robotics division. The current auto business alone does not justify the multiple. The premium is the market’s down payment on those future businesses.
Two analyst camps illustrate the divergence. The street consensus target sits at approximately $414, derived primarily from a forward P/E methodology applied to Tesla’s core automotive revenue. The TIKR bull case target reaches $1,771, built from a discounted cash flow (DCF) model that incorporates AI and robotics scaling scenarios. That is a 4x gap between two reasoned, data-informed targets for the same company.
The gap is not primarily a difference in optimism. It is a difference in methodology, specifically in what each analyst chooses to include or exclude from their valuation model. Three approaches sit at the centre of this divergence:
Tesla trades at approximately 317x trailing earnings. BYD, a pure-EV competitor producing more vehicles by volume, trades at approximately 15x. The difference is not about cars. It is about what each company’s stock price assumes about the next decade.
| Methodology | Price Target Implied |
|---|---|
| Street Consensus (Forward P/E, core auto) | ~$414 |
| TIKR Bull Case (DCF, AI + robotics scaling) | ~$1,771 |
Understanding why two rational analysts can produce targets 4x apart for the same stock is the first skill this guide builds. Once the methodology divergence is visible, the scenario analysis that follows becomes legible rather than arbitrary.
The $414 vs. $1,771 gap is not a quirk of Tesla analysis. It is what happens when two analysts build their models around different assumptions about the future. Scenario-based valuation formalises this process: rather than solving for a single “correct” price, it estimates a range of outcomes by varying the assumptions that drive a company’s future earnings.
Three input levers determine the output of any scenario model:
Damodaran’s DCF valuation framework, developed at NYU Stern, establishes the foundational principle that cash flows and discount rates must be matched precisely to the business being valued, a discipline that separates rigorous scenario models from those that simply assume growth without grounding it in capital structure realities.
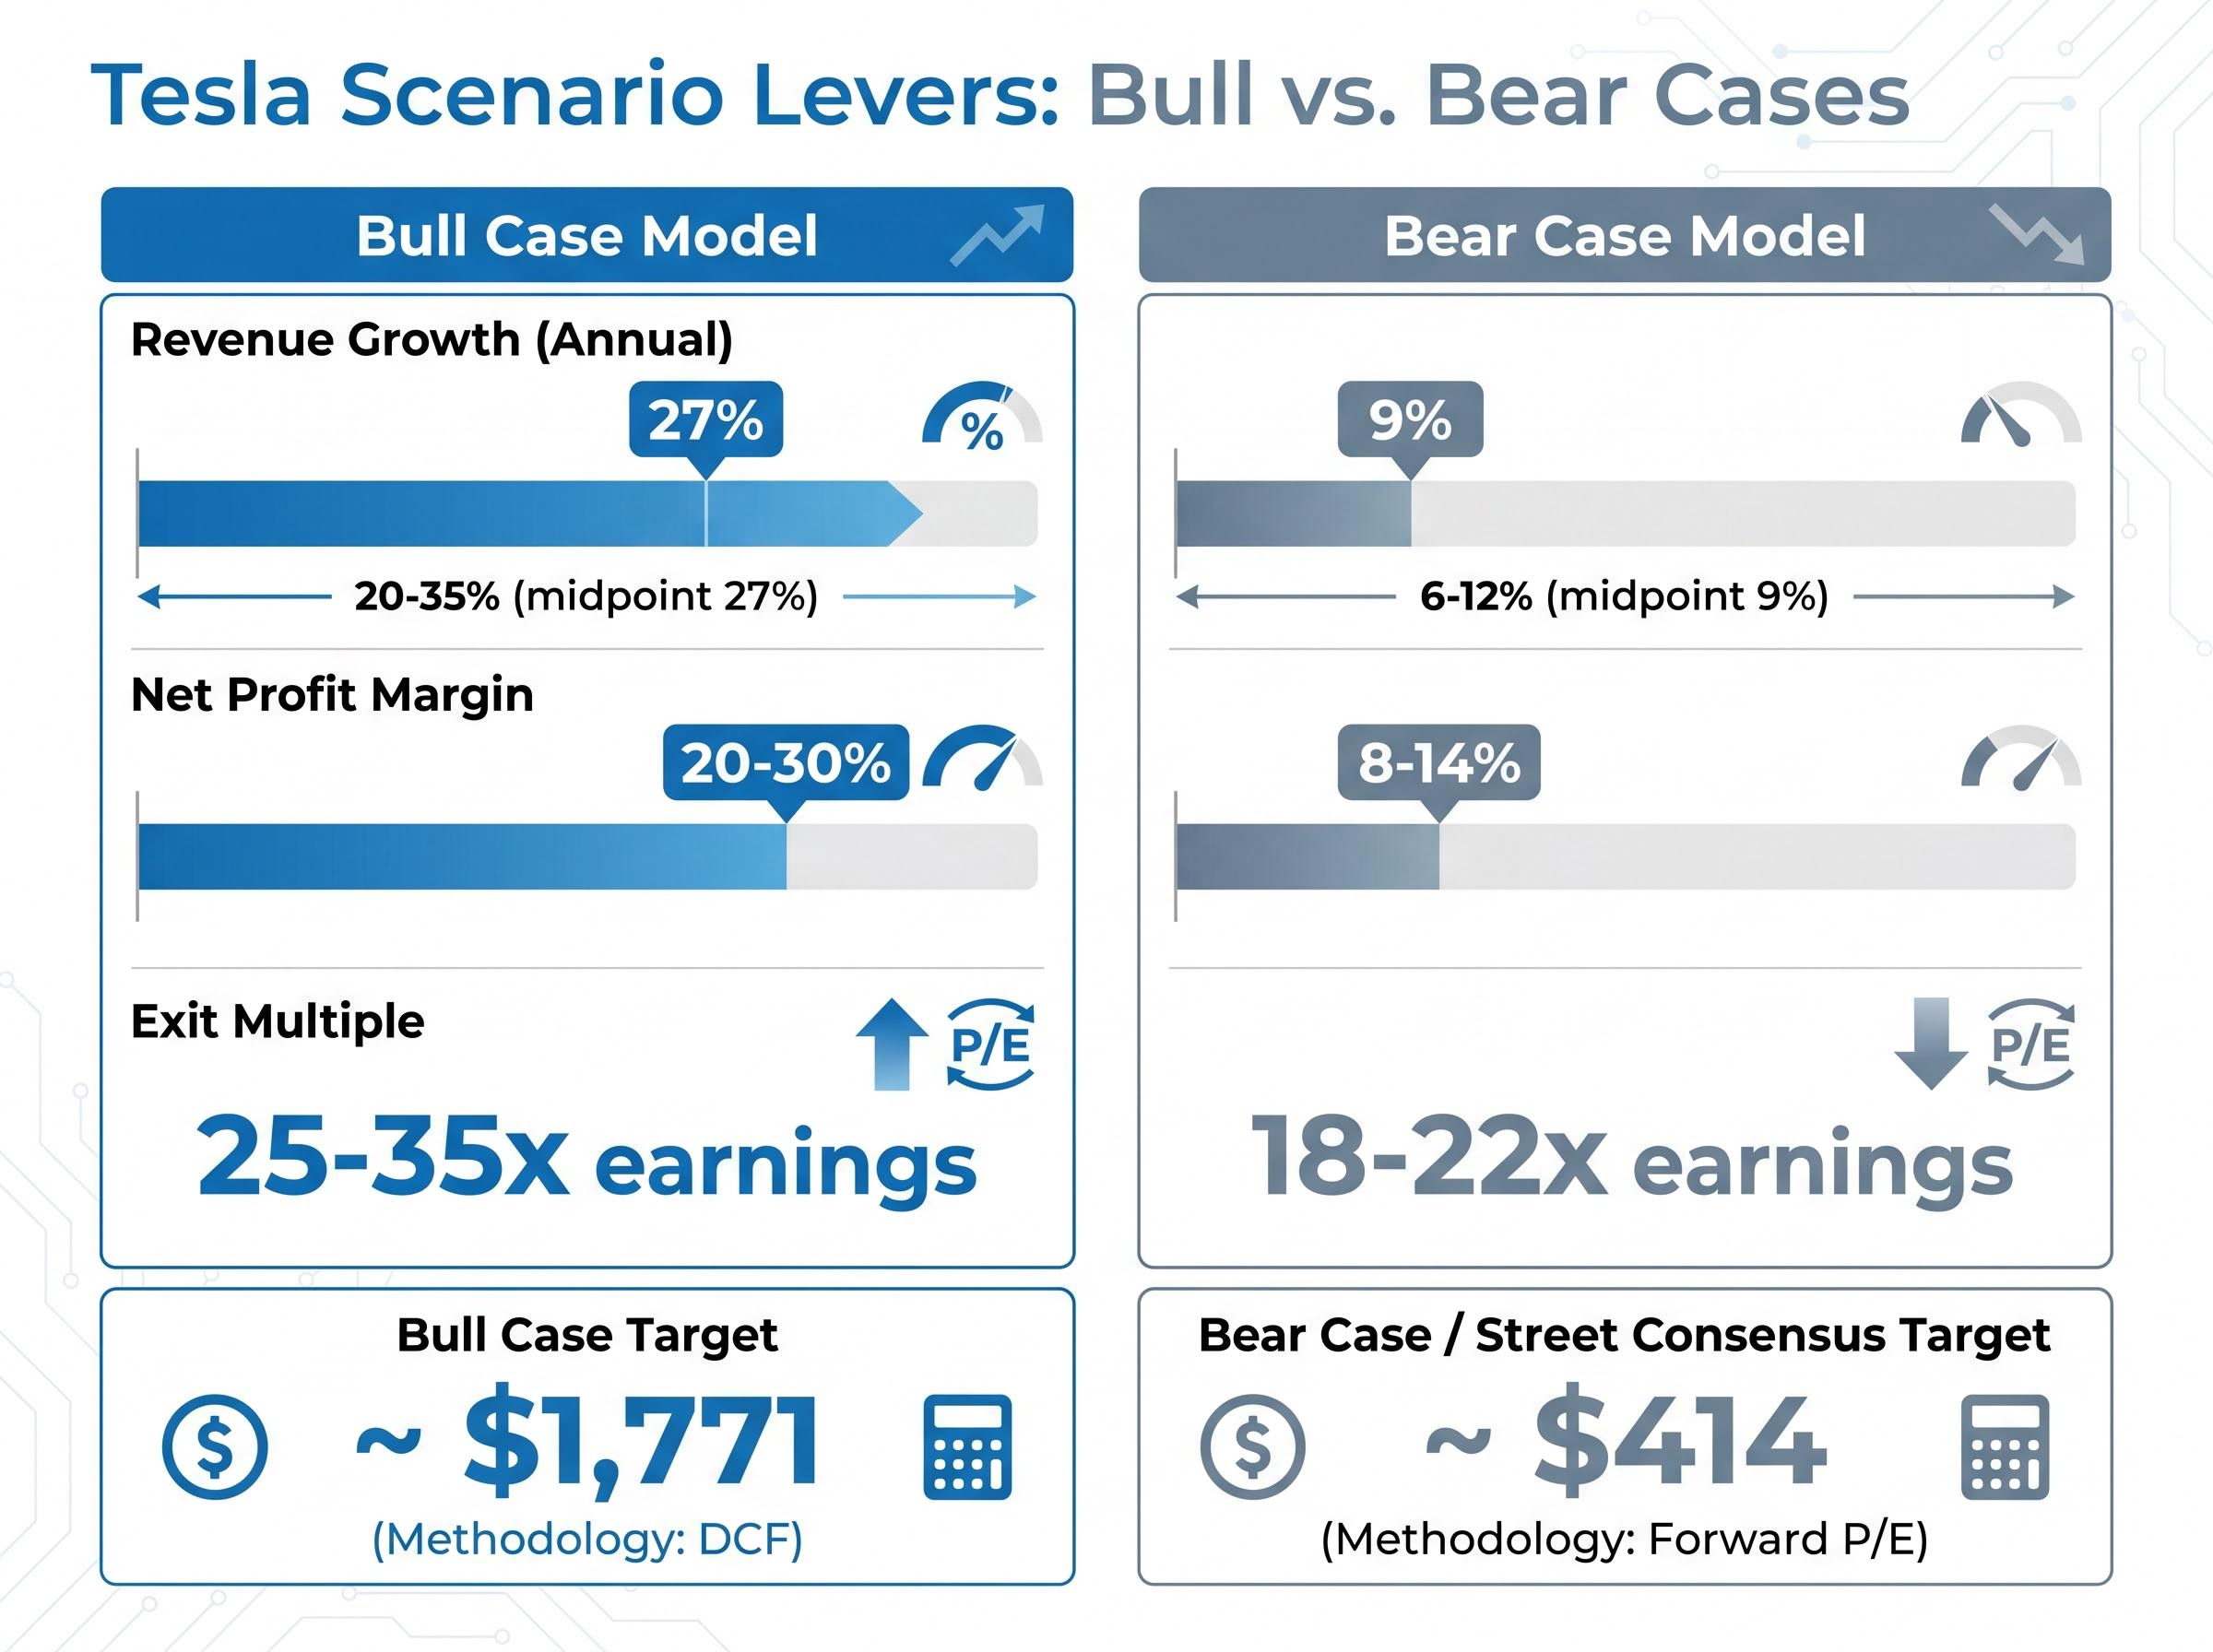
| Assumption | Bull Case | Bear Case | Why It Matters |
|---|---|---|---|
| Revenue Growth (Annual) | 20-35% (midpoint 27%) | 6-12% (midpoint 9%) | Determines the size of the earnings base being valued |
| Net Profit Margin | 20-30% | 8-14% | Controls how much revenue translates to shareholder earnings |
| Exit Multiple | 25-35x earnings | 18-22x earnings | Reflects the market’s future growth expectations at horizon end |
The steps for building a scenario model follow a consistent sequence:
One additional concept ties the framework together: probability weighting. Scenarios are not equally likely, and the price an investor pays implicitly reflects which scenario the market currently believes is most probable. At $428, Tesla’s market price sits far closer to the bull case assumptions than the bear case. That positioning has consequences for returns under each outcome, which the following sections examine in detail.
Probability-weighted valuation converts the bull and bear spread from a range of possibilities into a single blended expected return that can be compared directly against the investor’s required rate of return at any given entry price, which is the step that makes scenario analysis actionable rather than illustrative.
The bull case for Tesla is not simply “the company does well at cars.” It specifically depends on three distinct business transformations reaching commercial scale within the projection horizon:
If all three materialise on schedule, the TIKR bull case model implies a target of $1,771 per share.
From an entry price of approximately $428, the $1,771 bull case target implies an annualised internal rate of return (IRR) of 38% over the projection horizon, a return typically associated with early-stage venture investments rather than mega-cap equities.
Several Q1 2026 data points lend credibility to the bull thesis. Gross margin recovered to 21.1%, up from 16.3% in Q1 2025, a 490 basis point improvement that suggests pricing power and cost discipline are intact. Deliveries reached 358,023 units, up 6% year-over-year from 336,681 in Q1 2025.
On the autonomy front, Tesla reported that autonomous miles driven nearly doubled quarter-over-quarter in Q1 2026. The company expanded robotaxi operations to Dallas and Houston without safety drivers, marking a geographic expansion of real-world deployment.
The gaps are specific. As of early May 2026, Tesla has confirmed no Optimus or Cyber Cab revenue. No California robotaxi permits have been filed or approved. The CFO confirmed that free cash flow (the cash a company generates after accounting for capital spending) is expected to remain negative for all remaining 2026 quarters, driven by over $25 billion in planned capital expenditure.
Tesla’s Q1 2026 capital expenditure commitments, with CFO guidance of over $25 billion for the full year, sit at the intersection of the bull and bear narratives: the same spending that funds the robotaxi and Optimus programs responsible for the bull case target also produces the negative free cash flow that the bear case cites as structural risk.
Waymo already operates approximately 700 robotaxis commercially. Figure AI is well-funded and advancing in the humanoid space. The bull case requires Tesla not only to deliver on its own timeline but to establish market position against competitors that are already generating operational data.
The bear case does not assume Tesla collapses or fails. It assumes Tesla remains a well-run, above-average EV business with margins superior to traditional automakers, but without meaningful autonomous or robotics revenue contribution over the ten-year projection horizon. Even the bear case’s 8-14% net margin assumption exceeds what Ford or General Motors typically achieve.
The finding is stark.
At an entry price of approximately $375-$428 per share, every projected return outcome under bear case assumptions is negative. The current stock price structurally requires AI and robotics success to generate positive returns, not as upside optionality, but as a baseline requirement.
| Assumption | Bull Case | Bear Case |
|---|---|---|
| Revenue Growth (Annual) | 20-35% | 6-12% |
| Net Profit Margin | 20-30% | 8-14% |
| Exit Multiple | 25-35x | 18-22x |
| Implied Return at ~$428 Entry | Up to 38% annualised IRR | Negative across all scenarios |
Elon Musk’s historical timeline record provides evidence-based calibration for how likely the bull case’s AI assumptions are to arrive on schedule. This is not a dismissal of Tesla’s capabilities; it is a risk measurement tool:
Broader EV demand context adds additional pressure. Global EV sales growth slowed to approximately 20% in 2026 from 35% in 2025. BYD surpassed Tesla as the largest EV producer by volume, and pricing pressure from Chinese manufacturers remains ongoing.
The bear case’s core lesson is direct: the current stock price embeds a structural requirement for AI and robotics success regardless of how strong the core automotive business performs. An investor buying at $428 is not making a bet on whether Tesla is a good car company. That question is already answered. The bet is on whether it becomes something far larger.
The same company at two different entry prices represents two fundamentally different risk profiles. An investor who bought Tesla near $100 (available several years prior to May 2026) and an investor buying near $428 are not making the same bet, even though they own the same asset.
Entry price determines how much of the bull case must materialise for an investment to generate a positive return. At a lower entry, even a partial realisation of the bull case (say, FSD generating meaningful revenue but Optimus delayed by five years) may produce strong returns. At a higher entry, only the fullest realisation of the bull case avoids negative outcomes.
Three practical questions apply before buying any stock whose price reflects a transformation narrative:
Defining monitoring triggers before purchase — specific observable milestones such as gross margin thresholds, regulatory permit filings, or production volume targets — converts scenario analysis from a one-time exercise into an ongoing evidence-based system that tells investors when to raise or lower their probability weights as each quarter’s data arrives.
The street consensus of approximately $414 implies virtually no upside from $428. This means the core automotive business, even with 21.1% gross margins and 16% revenue growth, is already priced in at current levels.
Analyst forward estimates project EPS growing more than 5x from current levels, but this projection almost certainly incorporates AI and autonomy contributions. An investor needs to assess whether those contributions are already priced in at $428 or remain underpriced.
Historical context sharpens the point. Tesla’s trailing P/E peaked at approximately 1,200x in 2021. Investors who bought near that peak experienced significant losses even as Tesla’s underlying business improved materially. The $450 prior peak in 2026 sits close to the current price, reinforcing that the margin for error at elevated entry points is narrow.
Entry price is the one variable the investor controls. It does not determine whether Tesla succeeds or fails. It determines whether the investor is compensated appropriately for the risk they are accepting.
Tesla’s valuation debate is instructive precisely because the analytical tools it requires are not specific to one company. The scenario-based framework used throughout this guide applies to any company undergoing a business model transformation, AI repositioning, or high-multiple expansion phase.
The process reduces to four repeatable steps:
A blended fair value estimate — which weights each scenario’s implied price by its assigned probability and sums the results — produces a single number that can be directly compared to the current market price to determine whether the stock is cheap, fairly valued, or expensive relative to the most likely probability distribution of outcomes.
The most likely outcome for Tesla, in the assessment of most analysts, is a middle path: partial execution on AI and robotics, continued strength in core automotive, but neither the full bull nor the full bear materialising. This is also the hardest scenario to model precisely, which is why the bull-bear range serves as the more useful analytical tool.
The full spread of reasoned outcomes for Tesla illustrates this: $414 (street consensus), $1,771 (bull case), and negative implied fair value under bear case assumptions at current prices. Tesla’s analyst EPS estimates declined more than 90% from their peak before recovering, a reminder of how drastically projections can shift for companies in the midst of a transformation narrative.
Valuation analysis for transformation-stage companies is not about predicting the future correctly. It is about ensuring the price paid provides adequate margin of safety if the transformation takes longer or delivers less than projected.
This article is for informational purposes only and should not be considered financial advice. Investors should conduct their own research and consult with financial professionals before making investment decisions. Past performance does not guarantee future results. Financial projections are subject to market conditions and various risk factors.
Scenario-based stock valuation analysis estimates a range of potential outcomes for a stock by varying key assumptions such as revenue growth rate, net profit margin, and exit multiple, rather than solving for a single price target. It helps investors understand the spread of possible returns under different business trajectories.
Trailing P/E divides the current share price by the last twelve months of actual earnings, while forward P/E divides the current share price by projected future earnings. Tesla's trailing P/E of approximately 317x reflects market expectations of future businesses like autonomous driving, not just current profitability.
The gap typically reflects a difference in methodology rather than optimism alone. For Tesla, the street consensus of around $414 uses a forward P/E applied to core automotive revenue, while the bull case target of $1,771 uses a DCF model that incorporates AI and robotics scaling scenarios.
Entry price determines how much of the bull case must materialise for an investment to produce a positive return. At Tesla's current price of approximately $428, every bear case return outcome is negative, meaning the stock structurally requires AI and robotics success just to avoid a loss.
The four-step process applies to any transformation-stage company: identify what future business the stock price is paying for, build independent bull and bear case inputs grounded in specific milestones, calculate return outcomes at your entry price under each scenario, and assess whether the probability-weighted expected return justifies the risk.