How to Start Investing: From Cash Erosion to Wealth Building
11 hrs ago

Cash sitting in a bank account loses value every year. Inflation quietly erodes purchasing power, turning £1,000 today into roughly £800 of real purchasing power over several years. The gap widens not because savers made poor decisions, but because the monetary system rewards ownership over earnings. Wages track inflation. Assets outpace it. This guide provides a complete framework for beginning investors: understanding why markets work, how to access them with minimal fees, and how to build a sustainable habit that compounds over decades.
Inflation is the silent tax on cash. A loaf of bread that cost £1.20 five years ago now costs £1.55. A tank of petrol that filled for £45 now costs £58. The price increases feel sudden when noticed at checkout, but they accumulate gradually across every category of spending. Cash held in savings accounts earns interest rates that rarely match these increases, meaning the real value of money declines year after year.
Inflation is the silent tax on cash, with energy price inflation and its transmission through the broader economy creating secondary effects across transportation, manufacturing, and logistics costs. March 2026 energy prices surged 12.5% year-over-year, accounting for nearly three-quarters of that month’s total CPI increase as Brent crude approached $115 per barrel.
Wage growth has historically matched inflation rates, keeping incomes roughly stable in real terms. Asset prices, by contrast, have exceeded inflation significantly over long periods. A property purchased 20 years ago has generally more than doubled in value. Equity markets have historically delivered 8-10% average annual returns for disciplined investors. These returns compound, creating substantial wealth gaps between those who earn salaries and those who own appreciating assets.
Equity markets have historically delivered 8-10% average annual returns for disciplined investors, significantly outpacing both inflation and wage growth over multi-decade periods.
Investing levels this playing field by allowing ordinary people to become asset owners. Three mechanisms drive wealth accumulation through equity ownership:
These forces work over years and decades, not weeks or months. The investor who begins early and persists through market cycles captures the full benefit.
The investor who begins early and persists through market cycles captures the full benefit of equity ownership. However, forward return projections for the S&P 500 have compressed significantly, with JPMorgan projecting annualised returns of 5% or less over the next decade at current valuation levels despite Wall Street year-end 2026 targets ranging from 7,500 to 8,000.
A share is a fractional ownership stake in a real business. When you purchase shares in a company, you own a small portion of that company’s assets, future profits, and decision-making rights. The price you pay reflects what other market participants collectively believe the company is worth at that moment in time.
Publicly traded companies list their shares on exchanges where buyers and sellers transact throughout each trading session. Prices fluctuate throughout the day as new information arrives, quarterly results are released, management makes announcements, or broader economic conditions shift. These fluctuations represent the market’s ongoing reassessment of company value, not random volatility.
Investors profit from equity ownership through two mechanisms:
Reinvesting dividends accelerates compounding. Instead of spending the dividend payment, investors can purchase additional shares with the proceeds. Those additional shares then generate their own dividends, creating a snowball effect over time. This mechanism is how modest monthly contributions grow into substantial portfolios over multi-decade periods.
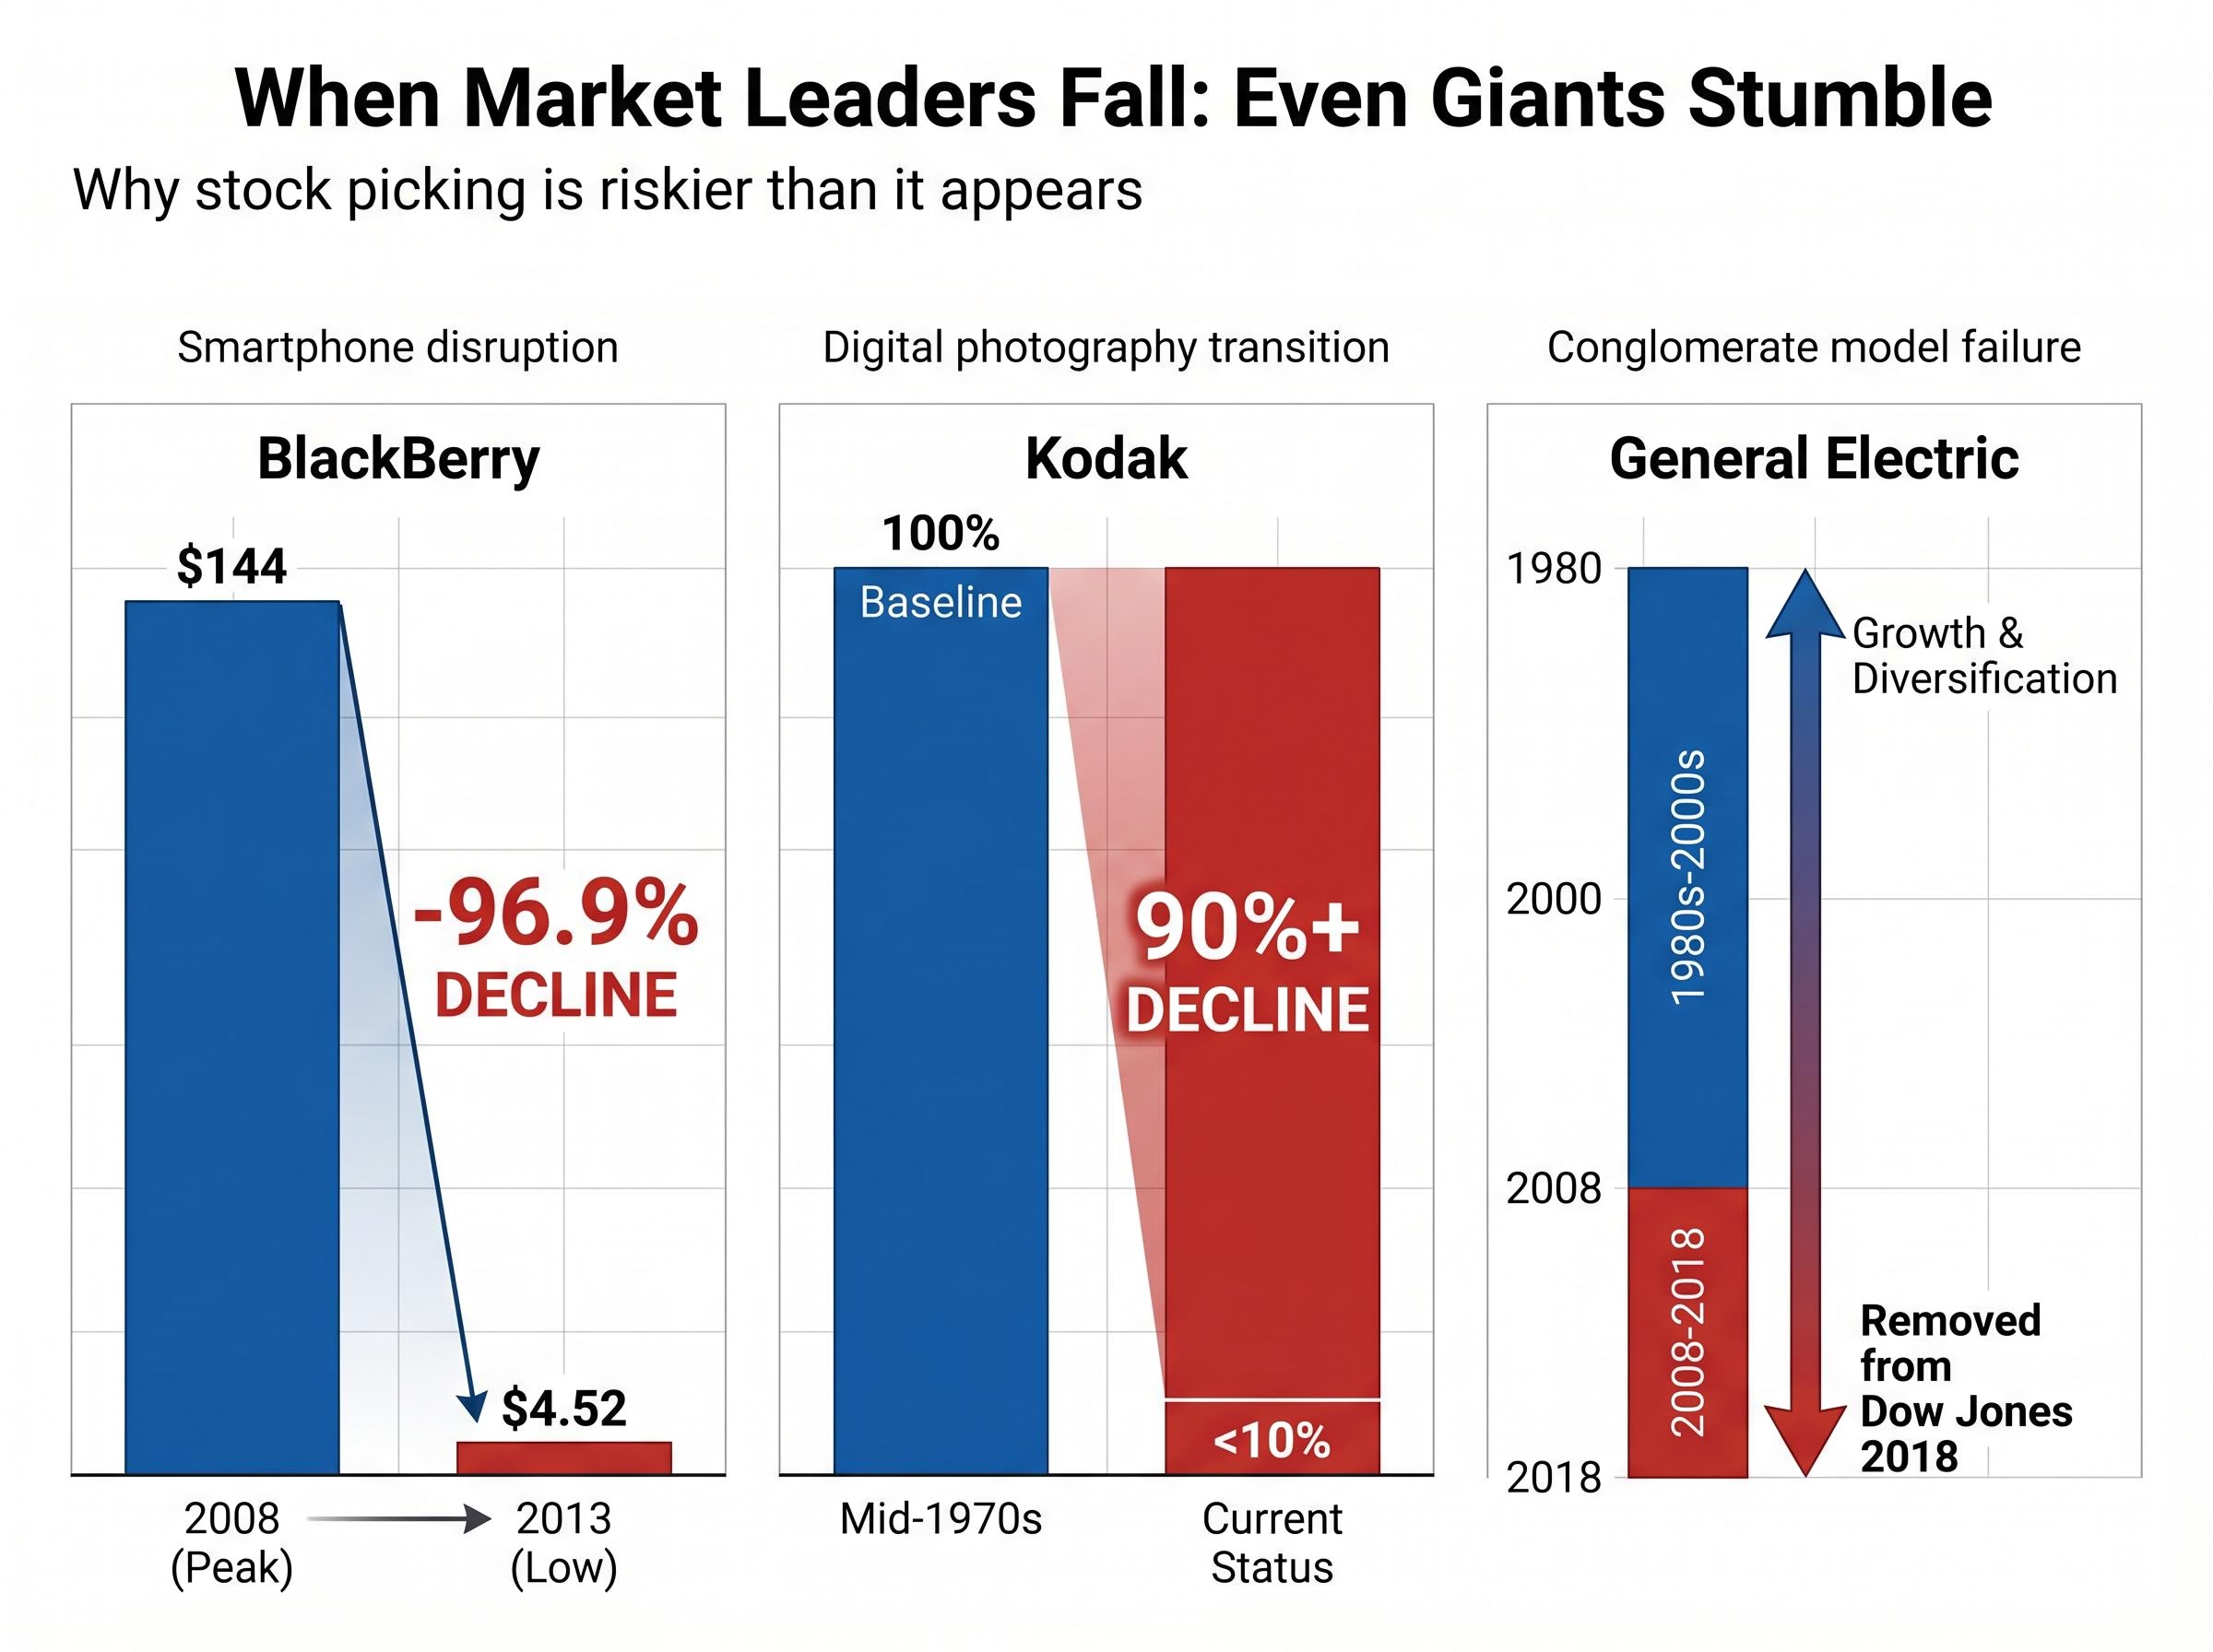
The logic of stock picking feels sound. Research a company thoroughly, identify strong management and growing markets, purchase shares, and hold for the long term. The difficulty is that thorough research cannot reliably predict which companies will maintain their positions over decades. Even dominant market leaders lose relevance as technologies shift, consumer preferences change, or competitors execute better strategies.
BlackBerry stock traded at $144 per share in June 2008, reflecting the company’s dominance in mobile business communications. Within five years, the stock had declined to $4.52 as smartphones with touchscreen interfaces displaced physical keyboards. Thorough analysis in 2008 would have identified BlackBerry’s strong market position, loyal customer base, and growing revenue. None of that analysis predicted the iPhone’s market impact.
The historical BlackBerry stock price data showing the 2008-2013 decline confirms the stock peaked at $147 per share in June 2008 before falling to $4.52 within five years, a 97% loss that illustrates how dominant market positions evaporate when technological paradigms shift faster than incumbents can adapt.
Kodak’s share price dropped over 90% during the mid-1970s downturn despite the company’s century-long dominance in photography. The S&P 500 composition shifted significantly between 1980 and 2020, with former leaders like General Electric, Walmart, and Exxon Mobil no longer holding dominant positions. The 1960s-1970s “blue chip” bubble saw American Express, McDonald’s, Kodak, and Coca-Cola all experience severe corrections despite appearing to be permanently stable businesses.
| Company | Peak Period | What Happened | Outcome |
|---|---|---|---|
| BlackBerry | June 2008 | Smartphone revolution displaced physical keyboards | $144 to $4.52 per share |
| Kodak | Mid-1970s | Failed to adapt to digital photography transition | 90%+ decline |
| General Electric | 1980-2000 | Conglomerate model fell out of favour, financial crisis exposure | Removed from Dow Jones Industrial Average in 2018 |
BlackBerry stock declined from $144 per share in June 2008 to $4.52 within five years, illustrating how even dominant market leaders can lose relevance when technologies shift.
Financial statement analysis, management interviews, and industry research cannot overcome this structural uncertainty. The companies that dominate today will not necessarily dominate tomorrow, and predicting which will survive requires foresight that even professional analysts rarely demonstrate.
Index funds solve the stock-picking problem by bundling hundreds or thousands of equities into a single investment vehicle that mirrors overall market performance. Instead of attempting to identify the handful of winners, index funds own all the major companies in a given market, capturing the aggregate returns without requiring individual selection.
The S&P 500 is the most widely tracked index, comprising the 500 largest US corporations across technology, energy, healthcare, finance, and other sectors. Major constituents include Apple, Microsoft, Amazon, Google (Alphabet), Tesla, and Nvidia. An S&P 500 index fund owns shares in all 500 companies, weighted by market capitalisation, so larger companies represent larger portions of the fund.
$100 invested in the S&P 500 at the start of 1996 with dividends reinvested grew to approximately $1,764 over 30 years, representing a cumulative return of roughly 1,664% and an inflation-adjusted annual return of approximately 7.52%.
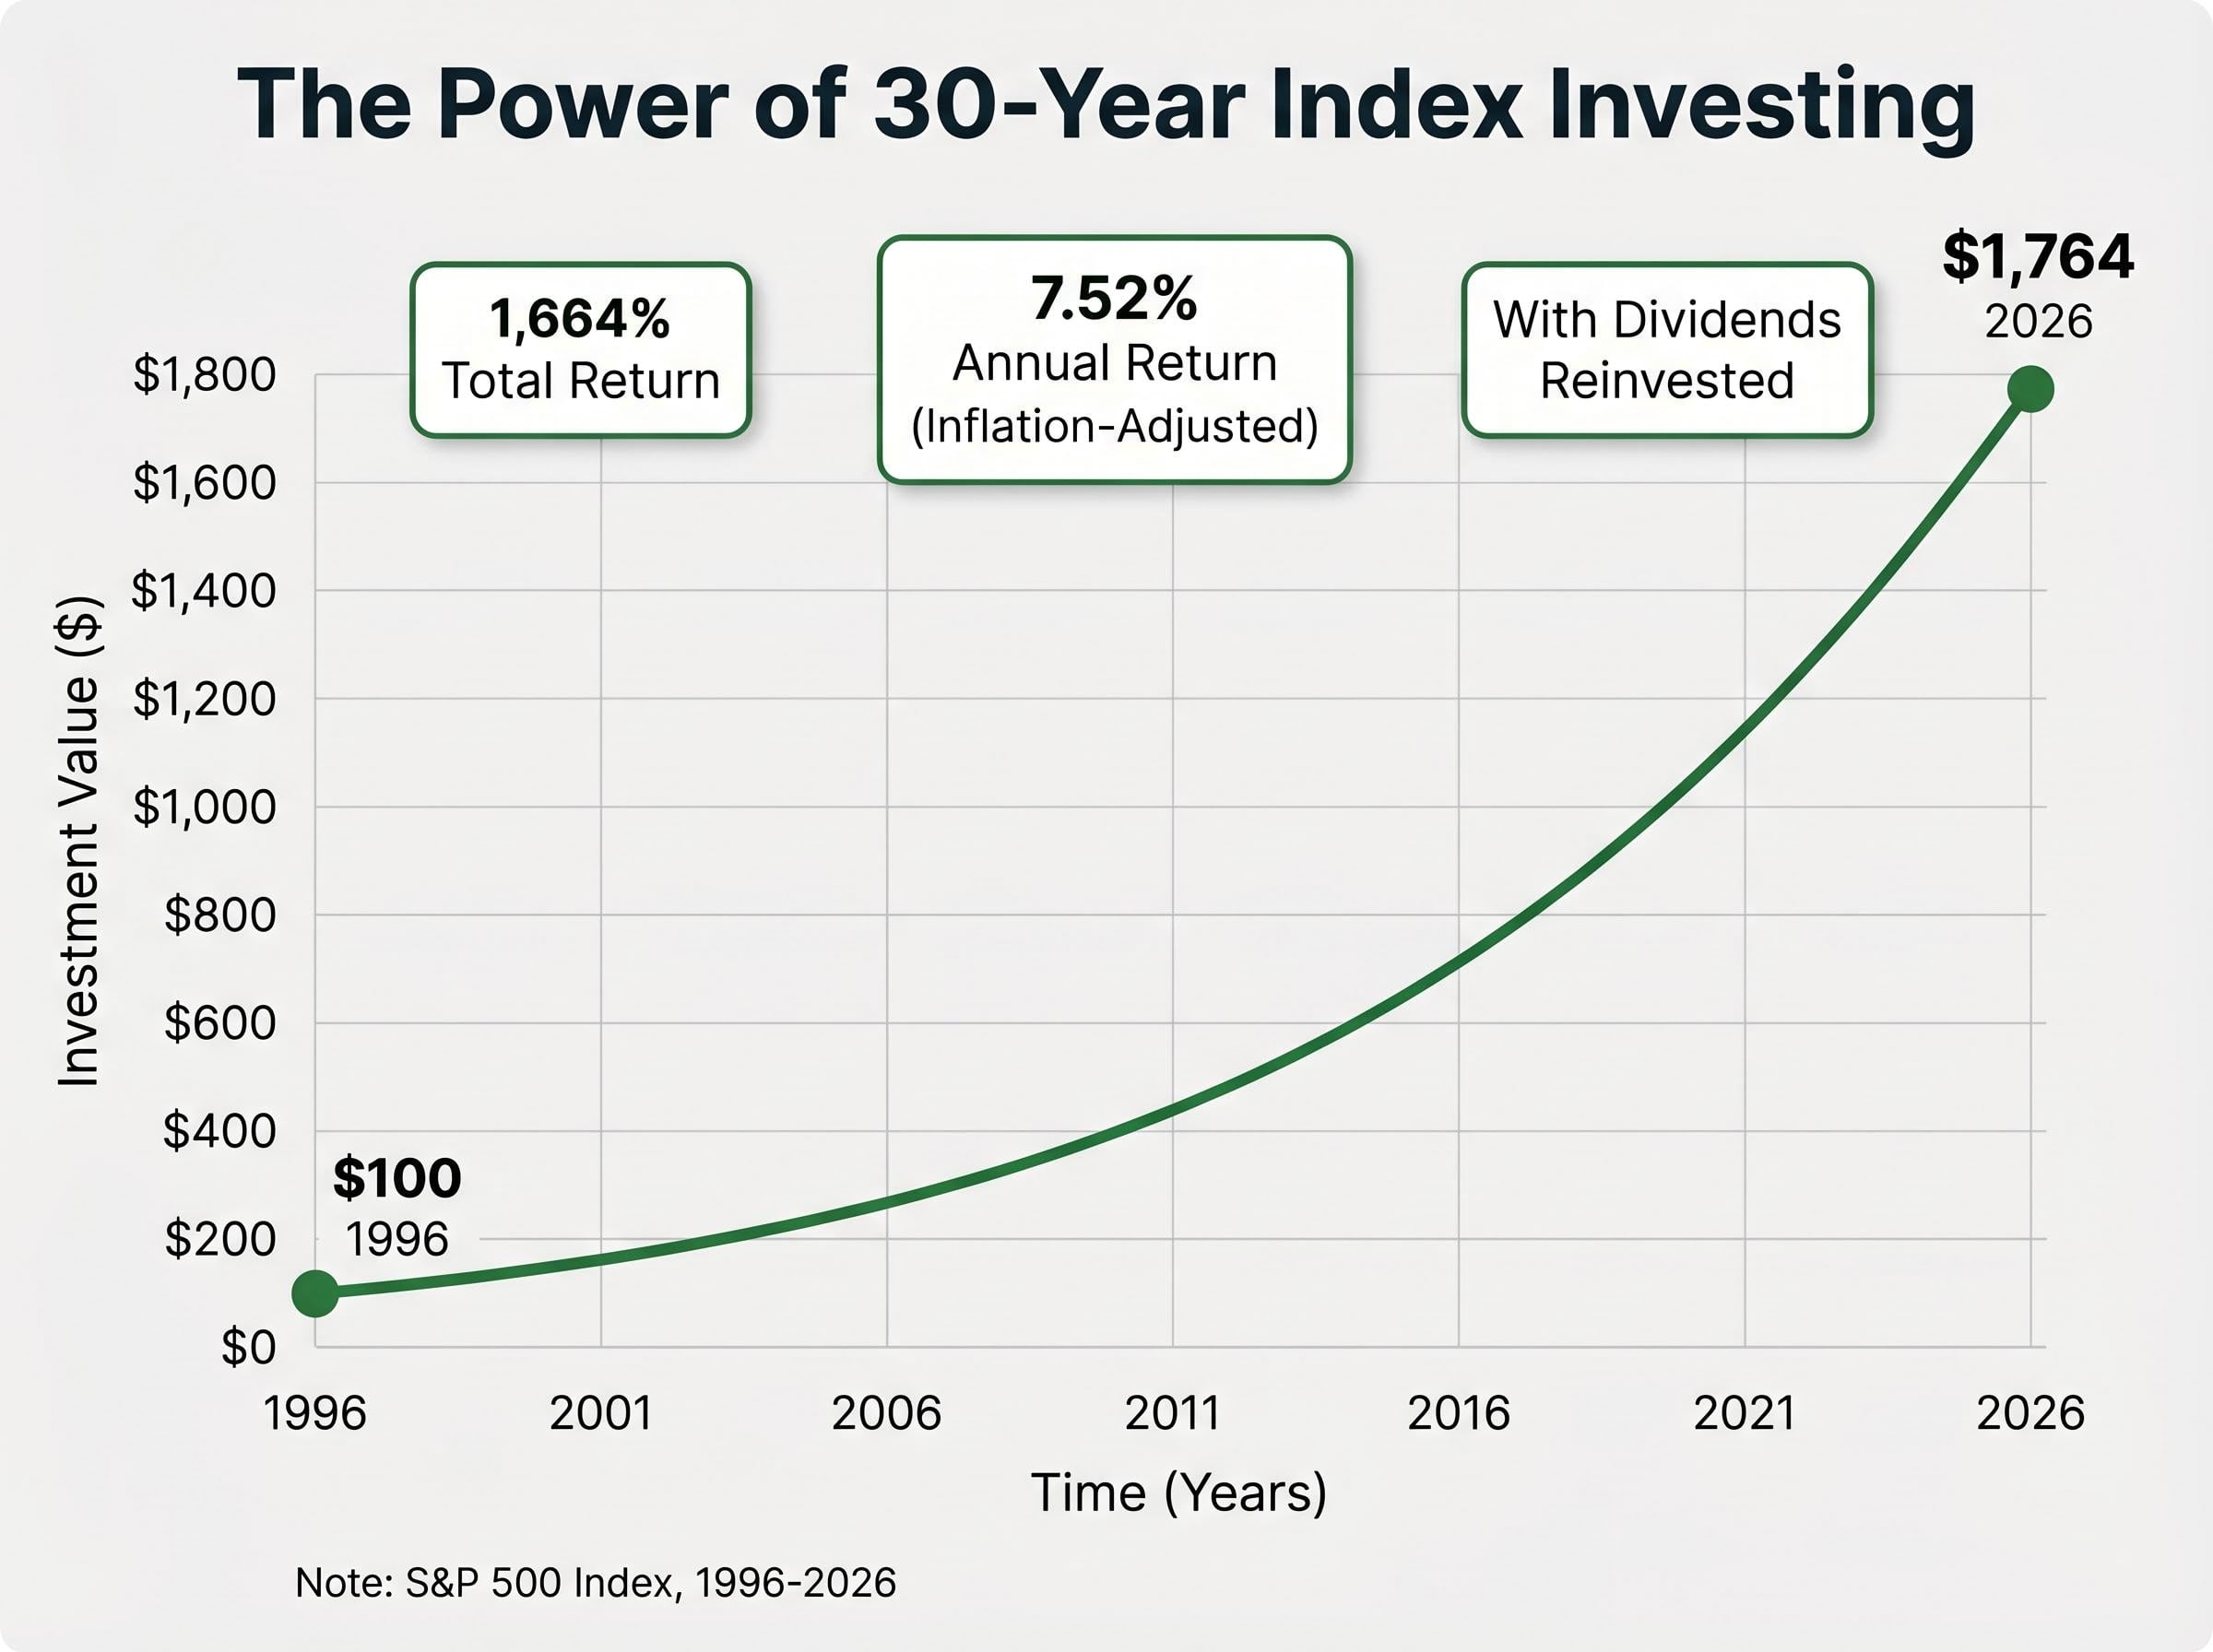
This 30-year result required no stock picking, no market timing, and no attempt to identify the next Apple or Amazon. The fund simply owned the market, and the market delivered.
Shiller’s monthly U.S. stock market data since 1871, compiled by Nobel laureate Robert Shiller and hosted at Yale University, provides the foundational dataset for calculating long-term inflation-adjusted equity returns, including the dividend reinvestment assumptions underlying the 30-year S&P 500 performance cited above.
Benefits of index fund investing:
US market dominance over the past decade has been extraordinary, driven partly by the Magnificent 7 technology stocks (Apple, Microsoft, Amazon, Google, Meta, Tesla, Nvidia). Historical patterns suggest today’s leaders may not maintain this dominance indefinitely. Economic uncertainties, regulatory changes, and technological shifts create reasons to diversify beyond a single geographic market.
Funds that include international developed markets (Europe, Japan, Australia) and emerging markets (China, India, Brazil) provide exposure to growth outside the US economy. This geographic diversification reduces reliance on any single country’s economic performance and captures opportunities in regions with different growth drivers.
Moving from understanding to action requires a clear framework. Five steps transform knowledge into an active portfolio:
The UK government ISA guidance confirming the £20,000 annual allowance establishes the maximum tax-advantaged contribution limit for the current tax year, a threshold that enables investors to shelter substantial equity growth from capital gains and dividend taxation.
For readers opening their first investment account, our comprehensive guide to verifying trading platform legitimacy walks through the specific SEC, CFTC, and FINRA registration checks that identify fraudulent brokerages, particularly critical in 2026 as deepfake celebrity endorsements and AI-powered fake dashboards have made visual verification shortcuts unreliable.
The UK government ISA guidance confirming the £20,000 annual allowance establishes the maximum tax-advantaged contribution limit for the current tax year, a threshold that enables investors to shelter substantial equity growth from capital gains and dividend taxation.
Employer-matched workplace pensions represent free money and should be prioritised before additional investing. If your employer matches contributions up to a certain percentage, contribute at least enough to capture the full match.
Fee minimisation compounds significantly over decades. A 0.1% annual fee versus a 1% annual fee on a £100,000 portfolio costs roughly £900 annually. Over 30 years, that difference represents tens of thousands in lost returns. Choose platforms and funds with the lowest possible fee structures.
Markets will decline. This is not a possibility, but a certainty. The S&P 500 has experienced corrections (10%+ declines) roughly once every two years on average. Bear markets (20%+ declines) occur less frequently but are inevitable over multi-decade investment periods. The greatest threat to returns is not market volatility, but investor behaviour during volatility.
Panic selling locks in losses. When markets fall 15%, investors who sell at the bottom convert a temporary paper loss into a permanent realised loss. Re-entering the market requires buying at higher prices, compounding the damage. Historical data shows that investors who hold through downturns and continue contributing during declines capture the full recovery and subsequent growth.
Diversification across funds and asset classes provides downside protection. Holding a globally diversified index fund rather than individual equities reduces single-company bankruptcy risk. Adding bond allocations or other asset classes further smooths volatility, though at the cost of some potential upside.
Common panic-selling triggers to avoid:
The greatest threat to investment returns is investor behaviour, not market volatility. Panic selling during downturns locks in losses and increases the cost of re-entering positions at higher prices.
The discipline that separates successful long-term investors from unsuccessful ones is the ability to hold through fear. Automation helps by removing the emotional decision point. Monthly contributions continue regardless of market conditions, purchasing more shares when prices are low and fewer when prices are high. This dollar-cost averaging smooths entry points over time.
The discipline that separates successful long-term investors from unsuccessful ones is the ability to hold through fear, and proven strategies for navigating market volatility include maintaining diversified index holdings, continuing automated contributions during downturns, and monitoring Federal Reserve policy shifts rather than reacting to daily headline swings.
Inflation erodes cash gradually but relentlessly. Diversified index funds offer accessible wealth-building by capturing broad market returns without requiring stock-picking skill. Automation removes emotion from the process, ensuring consistent contributions regardless of market conditions. Staying invested through volatility is the discipline that separates those who build wealth from those who do not.
Take one concrete step this week. Research a regulated low-fee platform in your jurisdiction. Check whether your employer offers pension matching and ensure you are capturing the full benefit. Set up your first automated contribution, even if the amount feels modest. The compounding mechanism does not require large sums to begin. It requires time and consistency. Start now.
Investing for beginners involves buying assets like index funds that grow in value over time, outpacing inflation. The practical first step is opening a tax-efficient account such as a Stocks and Shares ISA and setting up automated monthly contributions into a low-cost, diversified index fund.
Cash loses real purchasing power each year because savings account interest rates rarely match inflation. Over several years, £1,000 today can shrink to the equivalent of roughly £800 in real purchasing power, while asset prices have historically outpaced inflation significantly.
Index funds are investment vehicles that bundle hundreds or thousands of company shares to mirror overall market performance, such as the S&P 500. They are recommended for beginners because they provide instant diversification, require no stock-picking skill, and charge minimal management fees compared to actively managed funds.
There is no minimum amount required to begin investing. The article emphasises that the compounding mechanism does not require large sums; it requires time and consistency, meaning even modest monthly contributions like £100 build substantial wealth over multi-decade periods.
The recommended approach is to hold your positions and continue making automated contributions rather than panic selling. Selling during a downturn locks in a permanent loss, while investors who hold through declines capture the full recovery and subsequent growth, as confirmed by historical market data.