How to Start Investing: From Cash Erosion to Wealth Building
11 hrs ago

A single statistic reveals dramatically different investor experiences: one ETF dropped 25% from peak to trough over five years while a comparable fund fell just 17%, yet both charge identical 0.03% expense ratios. Understanding why two low-cost index funds can produce such different volatility profiles requires examining the specific metrics that quantify risk, not just returns. This explainer breaks down the core volatility metrics used to evaluate ETFs, demonstrates how to interpret them using real fund comparisons, and clarifies which measurements matter most for different investment goals.
Volatility is the stomach-churning experience of watching your portfolio swing 5% in a single day. The numbers that capture that experience, beta and maximum drawdown among them, are just precise language for something investors already know instinctively: some funds move more violently than others, even when their average returns look similar.
Volatility measures the degree of price fluctuation around an average return, not simply whether prices go up or down. Two funds can both deliver 10% annual gains, yet one investor sleeps peacefully while the other checks their account anxiously. The difference is volatility. It matters separately from returns because the path to a destination shapes whether you can actually stay on it. A fund that drops 30% during a market correction may ultimately recover and outperform, but if you panic-sold at the bottom, the final return is irrelevant.
Volatility tolerance is not about optimising for maximum returns or minimum variance in isolation. It is about understanding why index funds provide instant diversification across hundreds of companies, which eliminates single-stock concentration risk and allows you to hold through drawdowns that would be intolerable in individual equity positions.
Three core reasons volatility metrics matter:
Knowing a fund’s historical drawdown helps investors assess whether they can actually hold through similar declines. Implementing strategies for investing during market volatility, such as disciplined rebalancing and systematic exposure adjustments, converts drawdown awareness into concrete portfolio actions rather than abstract risk tolerance assessments.
Volatility metrics split into backward-looking measurements (what happened) and forward-looking risk expectations (what the market prices in). Beta and maximum drawdown are historical. They tell you how a fund behaved, not how it will behave, but past volatility often persists because it reflects underlying portfolio composition.
Identical expense ratios do not mean identical risk. A 0.03% fee tells you nothing about whether a fund dropped 17% or 25% during the last market stress event.
Broad market ETFs and value-focused ETFs can charge the same 0.03% yet produce meaningfully different volatility profiles. Trailing 12-month returns can differ by nearly 10 percentage points (37.2% versus 27.7%) between funds with different volatility characteristics, yet both are marketed as low-cost core holdings.
Beta is how much your fund moves when the market moves. A fund with a beta of 1.2 historically climbs 12% when the S&P 500 rises 10%, and falls 12% when the index drops 10%. A fund with a beta of 0.8 captures only 80% of those swings in both directions. That is the concept. The calculation uses monthly return data relative to the S&P 500 benchmark, regressing fund performance against index performance to produce a single correlation figure.
FINRA’s official definition of beta as a volatility measure establishes the metric as a regression-based correlation figure that quantifies how a security’s returns move relative to benchmark returns, the mathematical foundation underlying the practical interpretation that a 1.2 beta fund historically captures 120% of market swings.
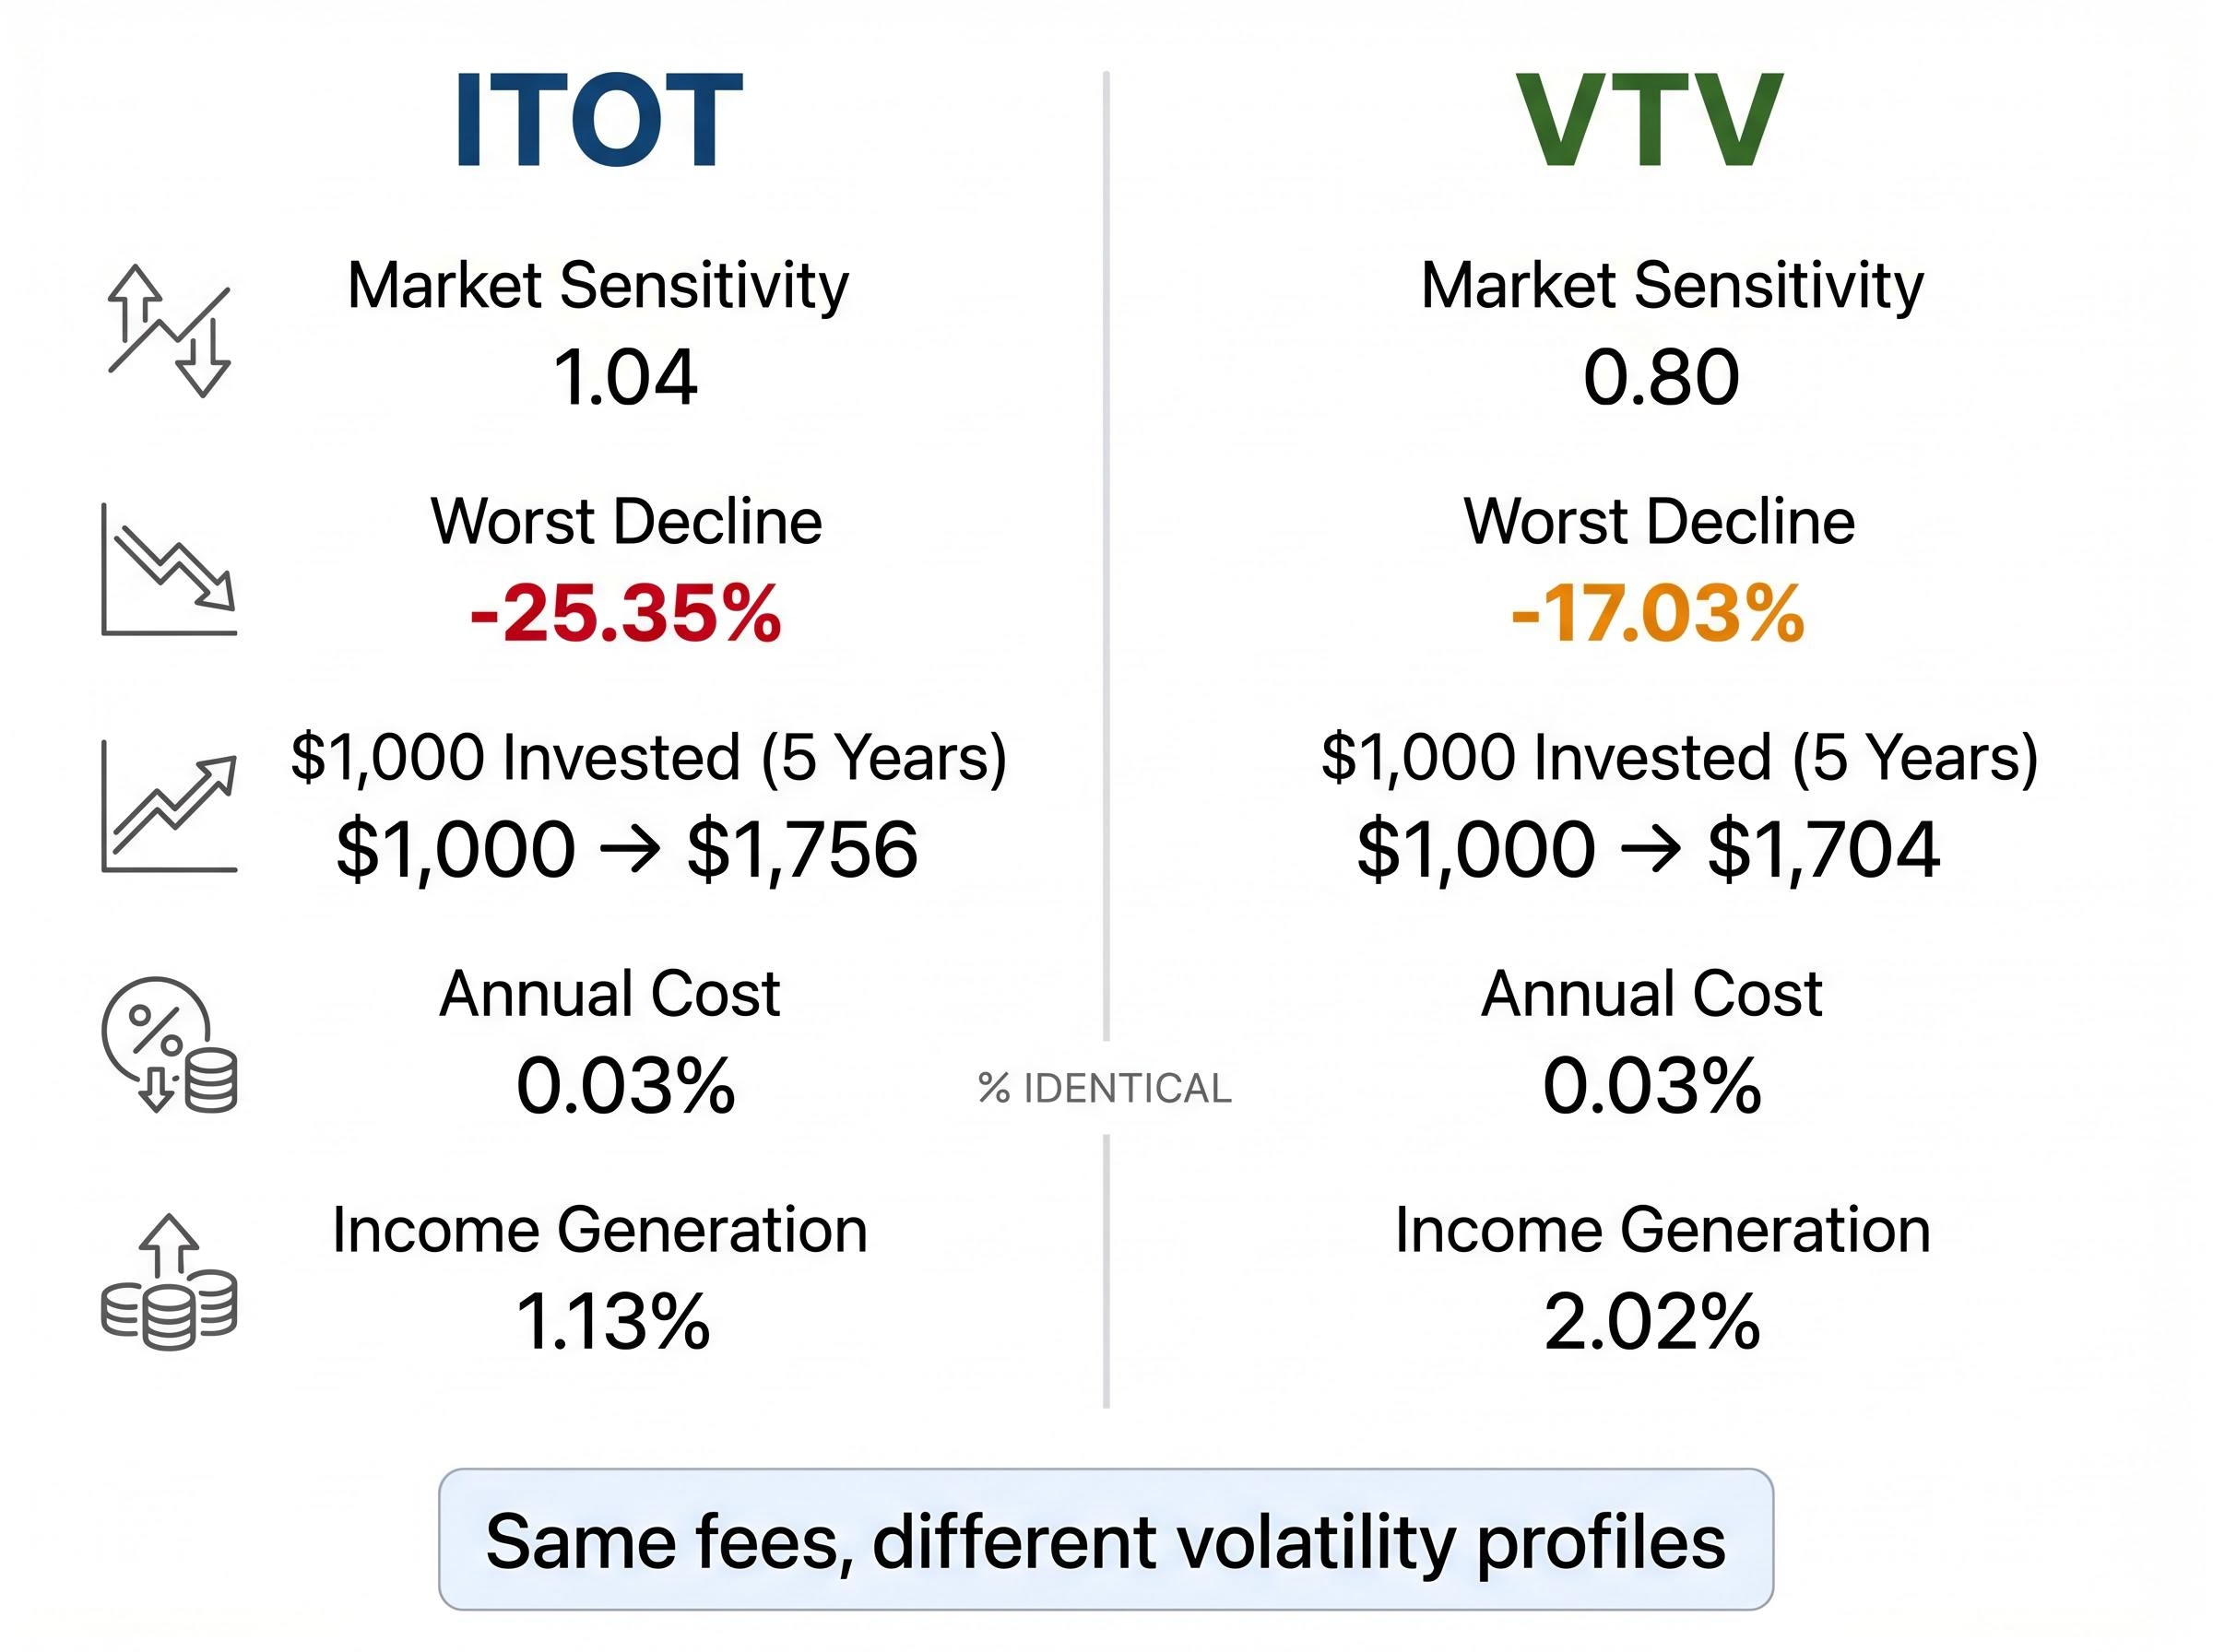
ITOT, a broad market ETF, carries a five-year monthly beta of 1.04. It moves slightly more than the S&P 500. VTV, a value-focused ETF, sits at a beta of 0.80, meaning it historically captures only 80% of market swings. When the S&P 500 rallied 10% during a particular quarter, ITOT likely gained around 10.4%, while VTV rose approximately 8%. When the index fell 10%, ITOT dropped closer to 10.4%, VTV closer to 8%.
Beta measures correlation with market direction, not absolute volatility in isolation. A fund can have low beta but high volatility if its price swings are large but uncorrelated with the broader market. Conversely, a fund with beta near 1.0 moves in lockstep with the index, making its behaviour predictable relative to market conditions.
| Beta Range | Market Behaviour Expectation | Typical Fund Characteristics |
|---|---|---|
| Below 0.90 | Fund moves less than the market in both directions, dampening gains and losses | Value-focused, dividend-weighted, defensive sector concentration |
| 0.90 to 1.10 | Fund tracks market movements closely with minimal deviation | Broad market index funds, total market ETFs |
| Above 1.10 | Fund amplifies market swings, rising and falling more aggressively | Growth-focused, technology-heavy, leveraged strategies |
Understanding beta allows investors to predict how their holdings will likely behave during market rallies and selloffs. If you hold a portfolio with an average beta of 1.2, a 10% market correction could compress your portfolio by 12%. If you cannot tolerate that level of drawdown, adjusting to lower-beta holdings before the next downturn becomes a concrete action rather than an abstract risk conversation.
How much could I actually lose? Every investor asks this question, most silently, some obsessively. Maximum drawdown answers it with precision. It measures the largest peak-to-trough decline over a specified period, capturing the worst loss an investor who bought at the high and sold at the low would have experienced. It is the paper loss that never materialised for those who held, and the realised loss for those who panicked.
ITOT’s worst five-year drawdown reached -25.35%. VTV’s maximum decline during the same period was -17.03%. The 8+ percentage point difference represents meaningfully different investor experiences during market stress. If you held $100,000 in ITOT at the peak, you watched it fall to $74,650 at the trough. If you held VTV, the low point was $82,970. Both funds recovered, but the journey tested different levels of conviction.
Drawdown often matters more than standard deviation for retail investors because it captures the actual pain of holding through a decline. Standard deviation is a statistical abstraction. Drawdown is what you see when you log into your brokerage account during a crisis. It is gut-level, not academic.
Maximum drawdown measures paper losses, not realised losses. The figure assumes you held through the entire decline without selling. If you sold partway down, your actual loss differs. If you held and recovered, the drawdown was temporary volatility, not permanent capital destruction.
Drawdown figures are historical. They do not guarantee future maximum losses. A fund that fell 17% during the last five years could fall 30% during the next downturn if market conditions shift or portfolio composition changes. The metric tells you what happened, giving you a stress-test benchmark, not a ceiling.
A fund that fell 25% during the last five years could fall 30% during the next downturn if market conditions shift or portfolio composition changes. The April 2026 case study of how geopolitical shocks drive violent equity swings, where the Dow whipsawed through a 500-point range across three days driven entirely by Strait of Hormuz headlines, demonstrates that historical drawdown figures do not ceiling future volatility in environments where macro catalysts escalate.
Compare drawdown figures only across similar time periods. A five-year drawdown and a one-year drawdown measure different market cycles. The five-year figure likely captures a full bear market; the one-year figure may not.
Consider drawdown alongside recovery time. A fund that fell 25% but recovered within six months delivered a different experience than a fund that fell 17% and took two years to regain its peak. The depth of the decline is half the story; the duration of the pain is the other half.
Recognise that larger drawdowns often accompany larger long-term gains. ITOT’s steeper drawdown reflects its growth and technology exposure, which also drove its higher trailing returns. VTV’s shallower decline pairs with lower recent performance. The tradeoff is visible in both directions.
$1,000 invested in ITOT grew to $1,756 over five years. $1,000 invested in VTV reached $1,704 during the identical period. The $52 difference in ending value, a 3% gap, seems marginal. One investor, however, endured a 25.35% drawdown to capture that return. The other experienced a 17.03% maximum decline. The journey mattered.
Cumulative returns tell only part of the story. Path matters for investor behaviour and compounding. If you sold ITOT during its 25% drawdown, perhaps in panic or to meet a cash need, you locked in a loss and forfeited the recovery. If you held VTV through its shallower 17% decline, the psychological burden was lighter, making it easier to stay invested. The fund you can hold through stress is the fund that delivers its advertised return. The fund you sell at the bottom does not.
Sector allocation and market-cap exposure drive these volatility differences. ITOT holds approximately 2,500 stocks with technology accounting for roughly 32% of assets. It captures the full market, including high-growth, high-volatility names. VTV concentrates on large-cap value companies with heavier weightings in financials, healthcare, and industrials. These sectors historically exhibit lower volatility than technology, dampening drawdowns during growth-stock corrections.
Sector allocation and market-cap exposure drive these volatility differences. The SOXX versus SMH comparison in April 2026 demonstrated precisely how semiconductor ETF index construction determines performance divergence, with SOXX’s 8% position cap producing a 7-percentage-point outperformance over SMH’s mega-cap concentration during a 17-session rally despite both funds targeting the same sector.
The beta figures connect directly to this composition. ITOT’s 1.04 beta reflects its market-representative holdings. VTV’s 0.80 beta reflects its defensive sector tilt. The maximum drawdown figures are the consequence: when technology sold off sharply, ITOT fell further; when value sectors held up, VTV declined less.
| Metric | ITOT | VTV | Difference | What It Means |
|---|---|---|---|---|
| Five-Year Beta | 1.04 | 0.80 | 0.24 higher for ITOT | ITOT amplifies market swings by 4%; VTV dampens them by 20% |
| Maximum Drawdown | -25.35% | -17.03% | 8.32 percentage points deeper for ITOT | ITOT investors endured significantly larger peak-to-trough decline |
| Five-Year Ending Value ($1,000 start) | $1,756 | $1,704 | $52 higher for ITOT | ITOT delivered 3% more total return over the period |
| Expense Ratio | 0.03% | 0.03% | Identical | Cost structure does not explain volatility difference |
| Dividend Yield | 1.13% | 2.02% | 0.89 percentage points higher for VTV | VTV generates nearly double the income, partially offsetting lower capital gains |
Readers learn to evaluate whether marginally higher returns justify materially higher volatility. A 3% cumulative gain difference over five years compounds to a modest advantage. A 8+ percentage point drawdown difference represents a dramatic variance in investor experience. The choice depends on whether the extra return compensates for the extra stress, and whether you can hold through that stress without selling.
Volatility tolerance is personal and situation-dependent. There is no universal correct answer to the growth-versus-value question, no objectively optimal beta. The fund that works for a 30-year-old accumulating wealth differs from the fund that works for a 65-year-old drawing income. Investment timeline affects which volatility metrics matter most.
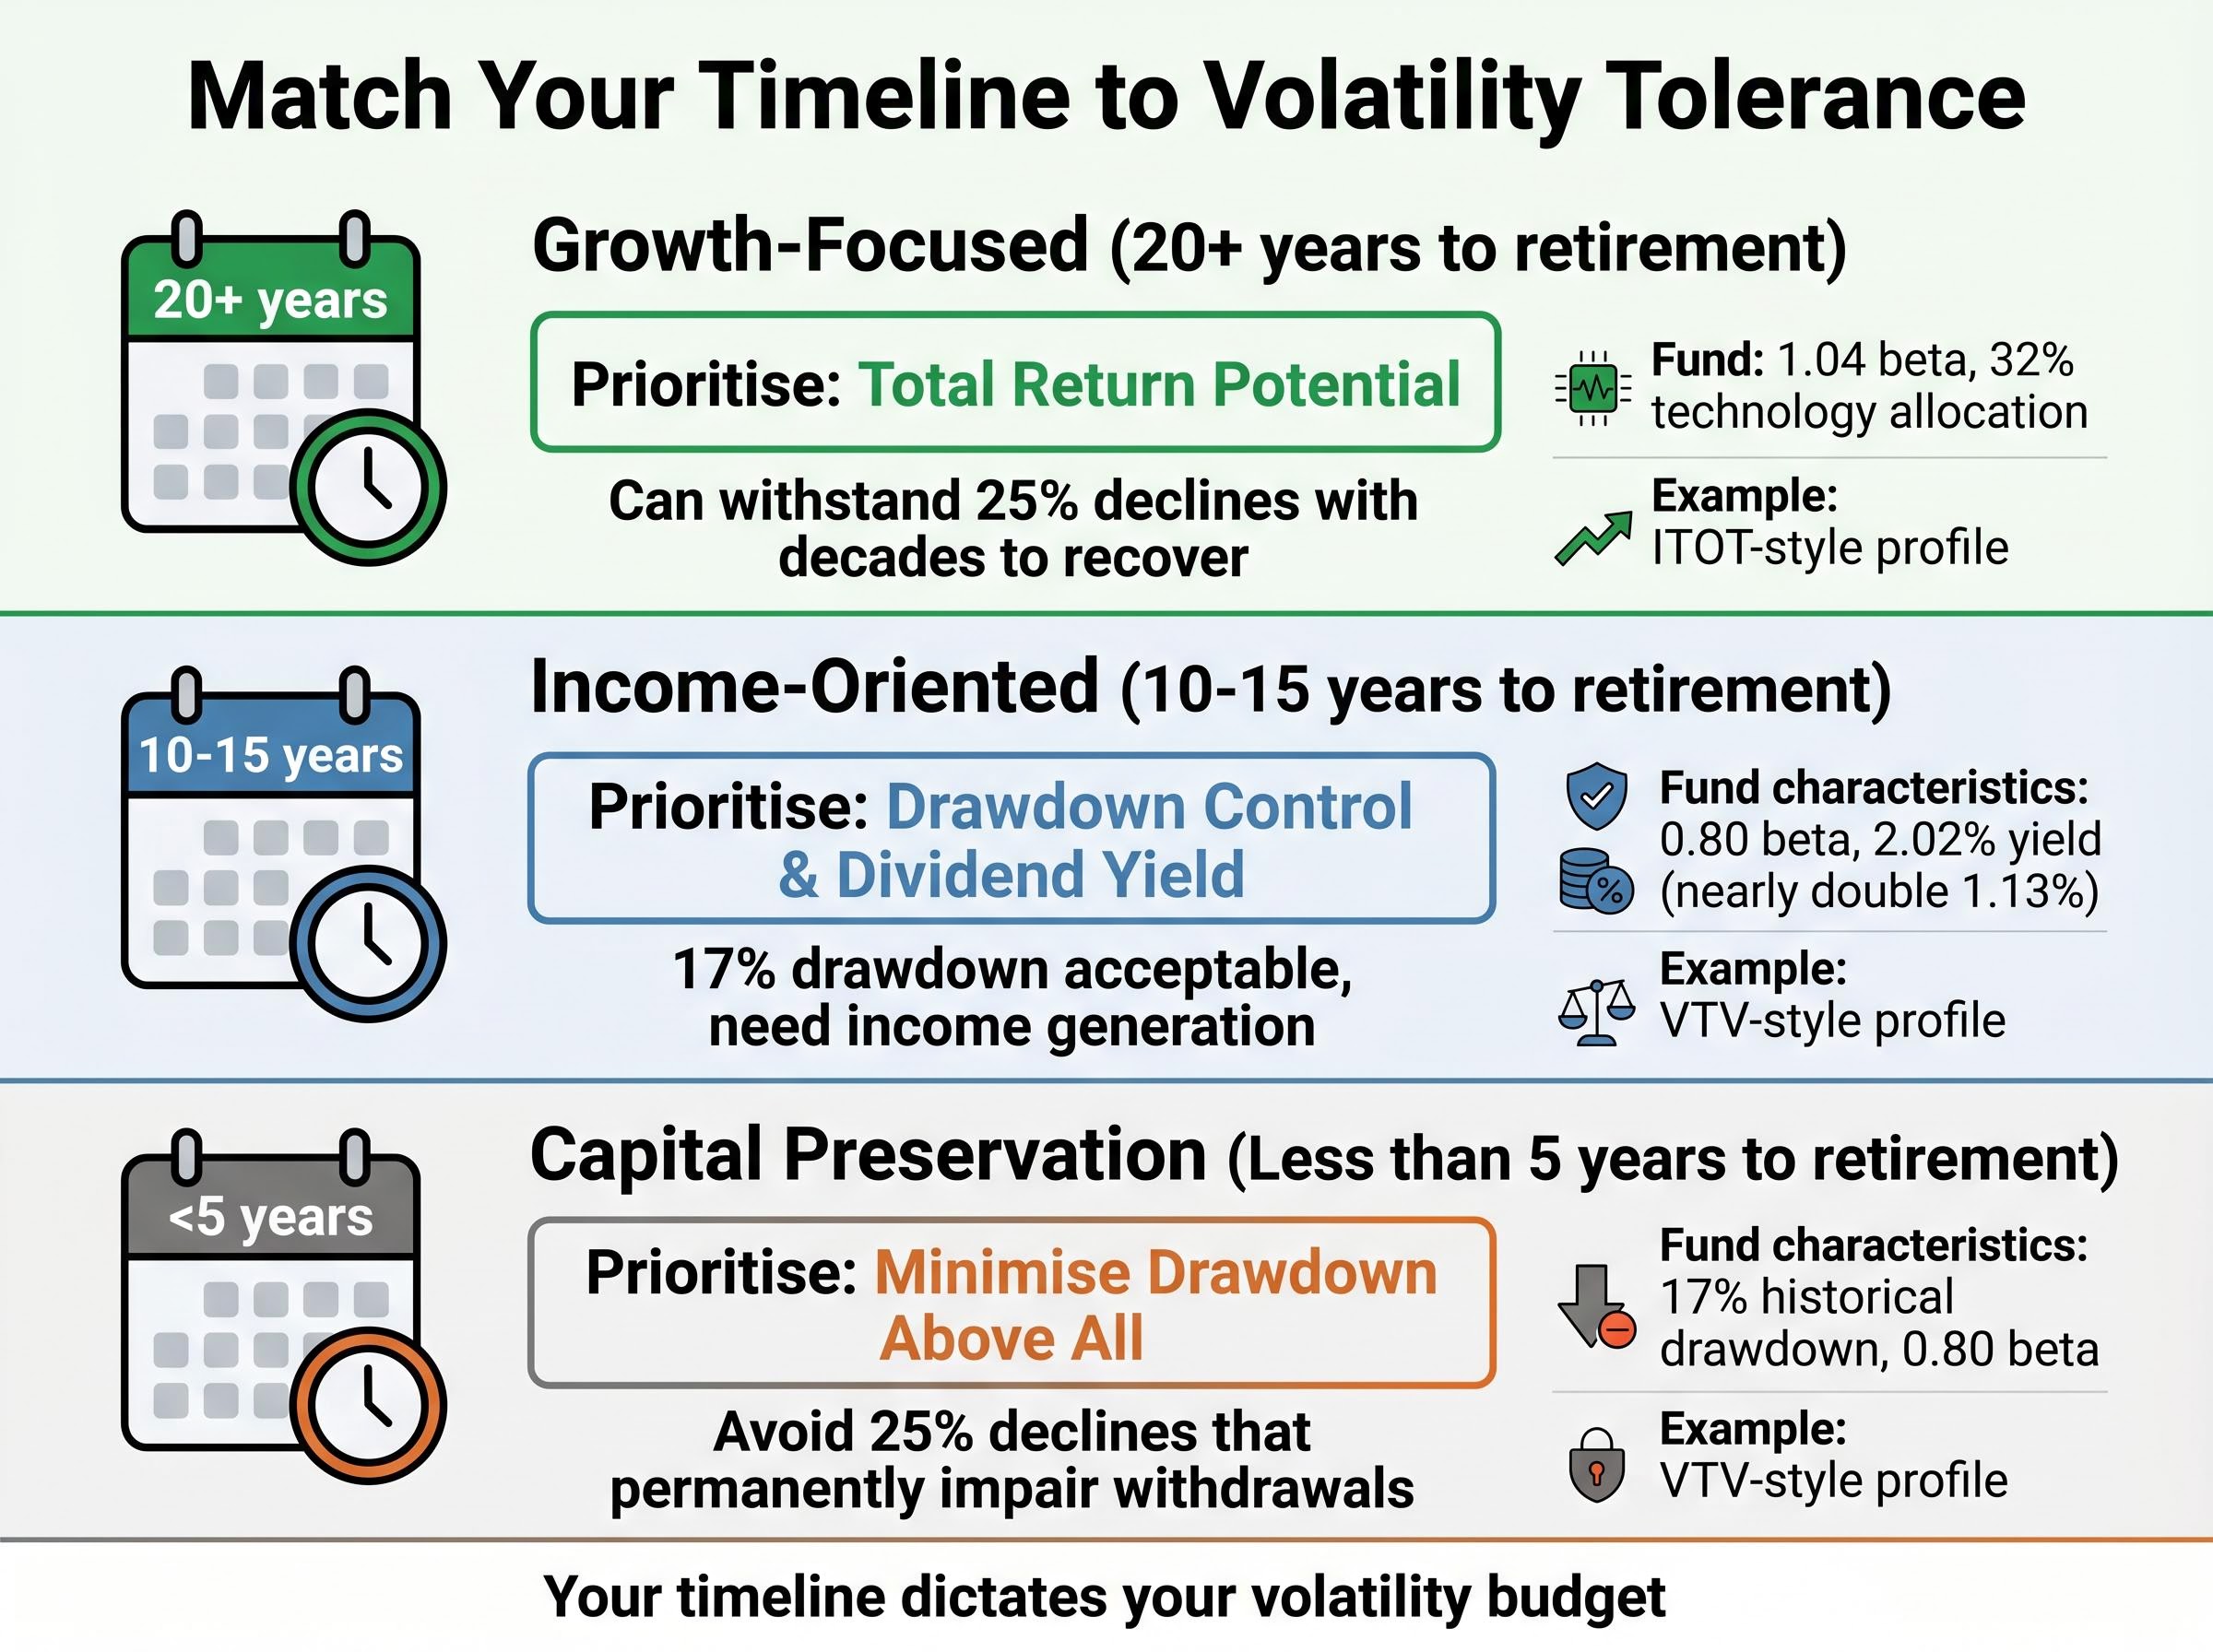
Three investor profile scenarios illustrate the framework:
The shallower 17% drawdown also reduces the risk of selling into a trough to meet income needs, a concern quantified in peer-reviewed measures of sequence-of-returns risk for retirement portfolios that demonstrate how bad return sequences early in the withdrawal phase can permanently impair portfolio sustainability.
VTV manages approximately $225.7 billion in assets compared to ITOT’s $79.6 billion, suggesting different investor bases have already voted with capital. The larger asset base in VTV reflects its appeal to income-focused and risk-averse portfolios. Trailing 12-month returns of 37.2% (ITOT) versus 27.7% (VTV) show the growth-volatility tradeoff in recent performance, but this snapshot does not predict which fund outperforms over the next decade.
Readers finish with a framework for self-assessment rather than a product recommendation. Your timeline dictates your volatility budget. Your temperament dictates whether you can actually hold through the drawdown your timeline theoretically allows. Match measurable risk characteristics (beta, drawdown, yield) to your specific circumstances, not to abstract optimisation.
Volatility metrics transform vague feelings about risk into precise, comparable numbers. Beta reveals market sensitivity, with figures above 1.0 amplifying swings and figures below 0.90 dampening them. Maximum drawdown captures worst-case historical declines, answering the question every investor asks: how much could I actually lose? Comparing these figures across funds exposes how identical 0.03% fees can mask dramatically different investor experiences, from 17% drawdowns to 25% declines, from 2% dividend yields to 1% yields.
The choice between higher-volatility growth exposure and lower-volatility value orientation is not about finding the objectively better fund. It is about matching measurable risk characteristics to personal circumstances. A 30-year timeline tolerates a 25% drawdown; a 5-year timeline does not. An income need prioritises a 2% yield; a growth mandate does not.
Before evaluating any ETF’s returns, check its beta and historical drawdown against your own timeline and temperament. The fund that looks best on paper may not be the one you can actually hold through market stress.
ETF volatility metrics are quantitative measures such as beta and maximum drawdown that capture how much a fund's price fluctuates relative to the market or from peak to trough. They matter because two funds can deliver similar returns yet expose investors to very different levels of risk and psychological stress along the way.
Beta measures how much an ETF moves relative to the broader market; a beta of 1.04 means the fund moves slightly more than the S&P 500, while a beta of 0.80 means it captures only 80% of market swings in both directions. It helps investors predict how their holdings will behave during market rallies and selloffs.
Maximum drawdown shows the largest peak-to-trough decline over a specified period, representing the worst loss an investor who bought at the high and sold at the low would have experienced. For example, ITOT had a five-year maximum drawdown of 25.35% compared to 17.03% for VTV, meaning ITOT investors endured a significantly steeper decline during market stress.
Yes, identical expense ratios reveal nothing about volatility; both ITOT and VTV charge 0.03% yet their five-year maximum drawdowns differ by more than 8 percentage points. The difference comes from portfolio composition, specifically sector allocation and market-cap exposure, not from cost structure.
Investors with long timelines of 20 or more years can tolerate higher-beta funds like ITOT because they have time to recover from deep drawdowns, while those within five years of retirement should prioritise lower-beta, lower-drawdown options like VTV to avoid permanent capital impairment just before withdrawals begin.