How to Start Investing: From Cash Erosion to Wealth Building
11 hrs ago

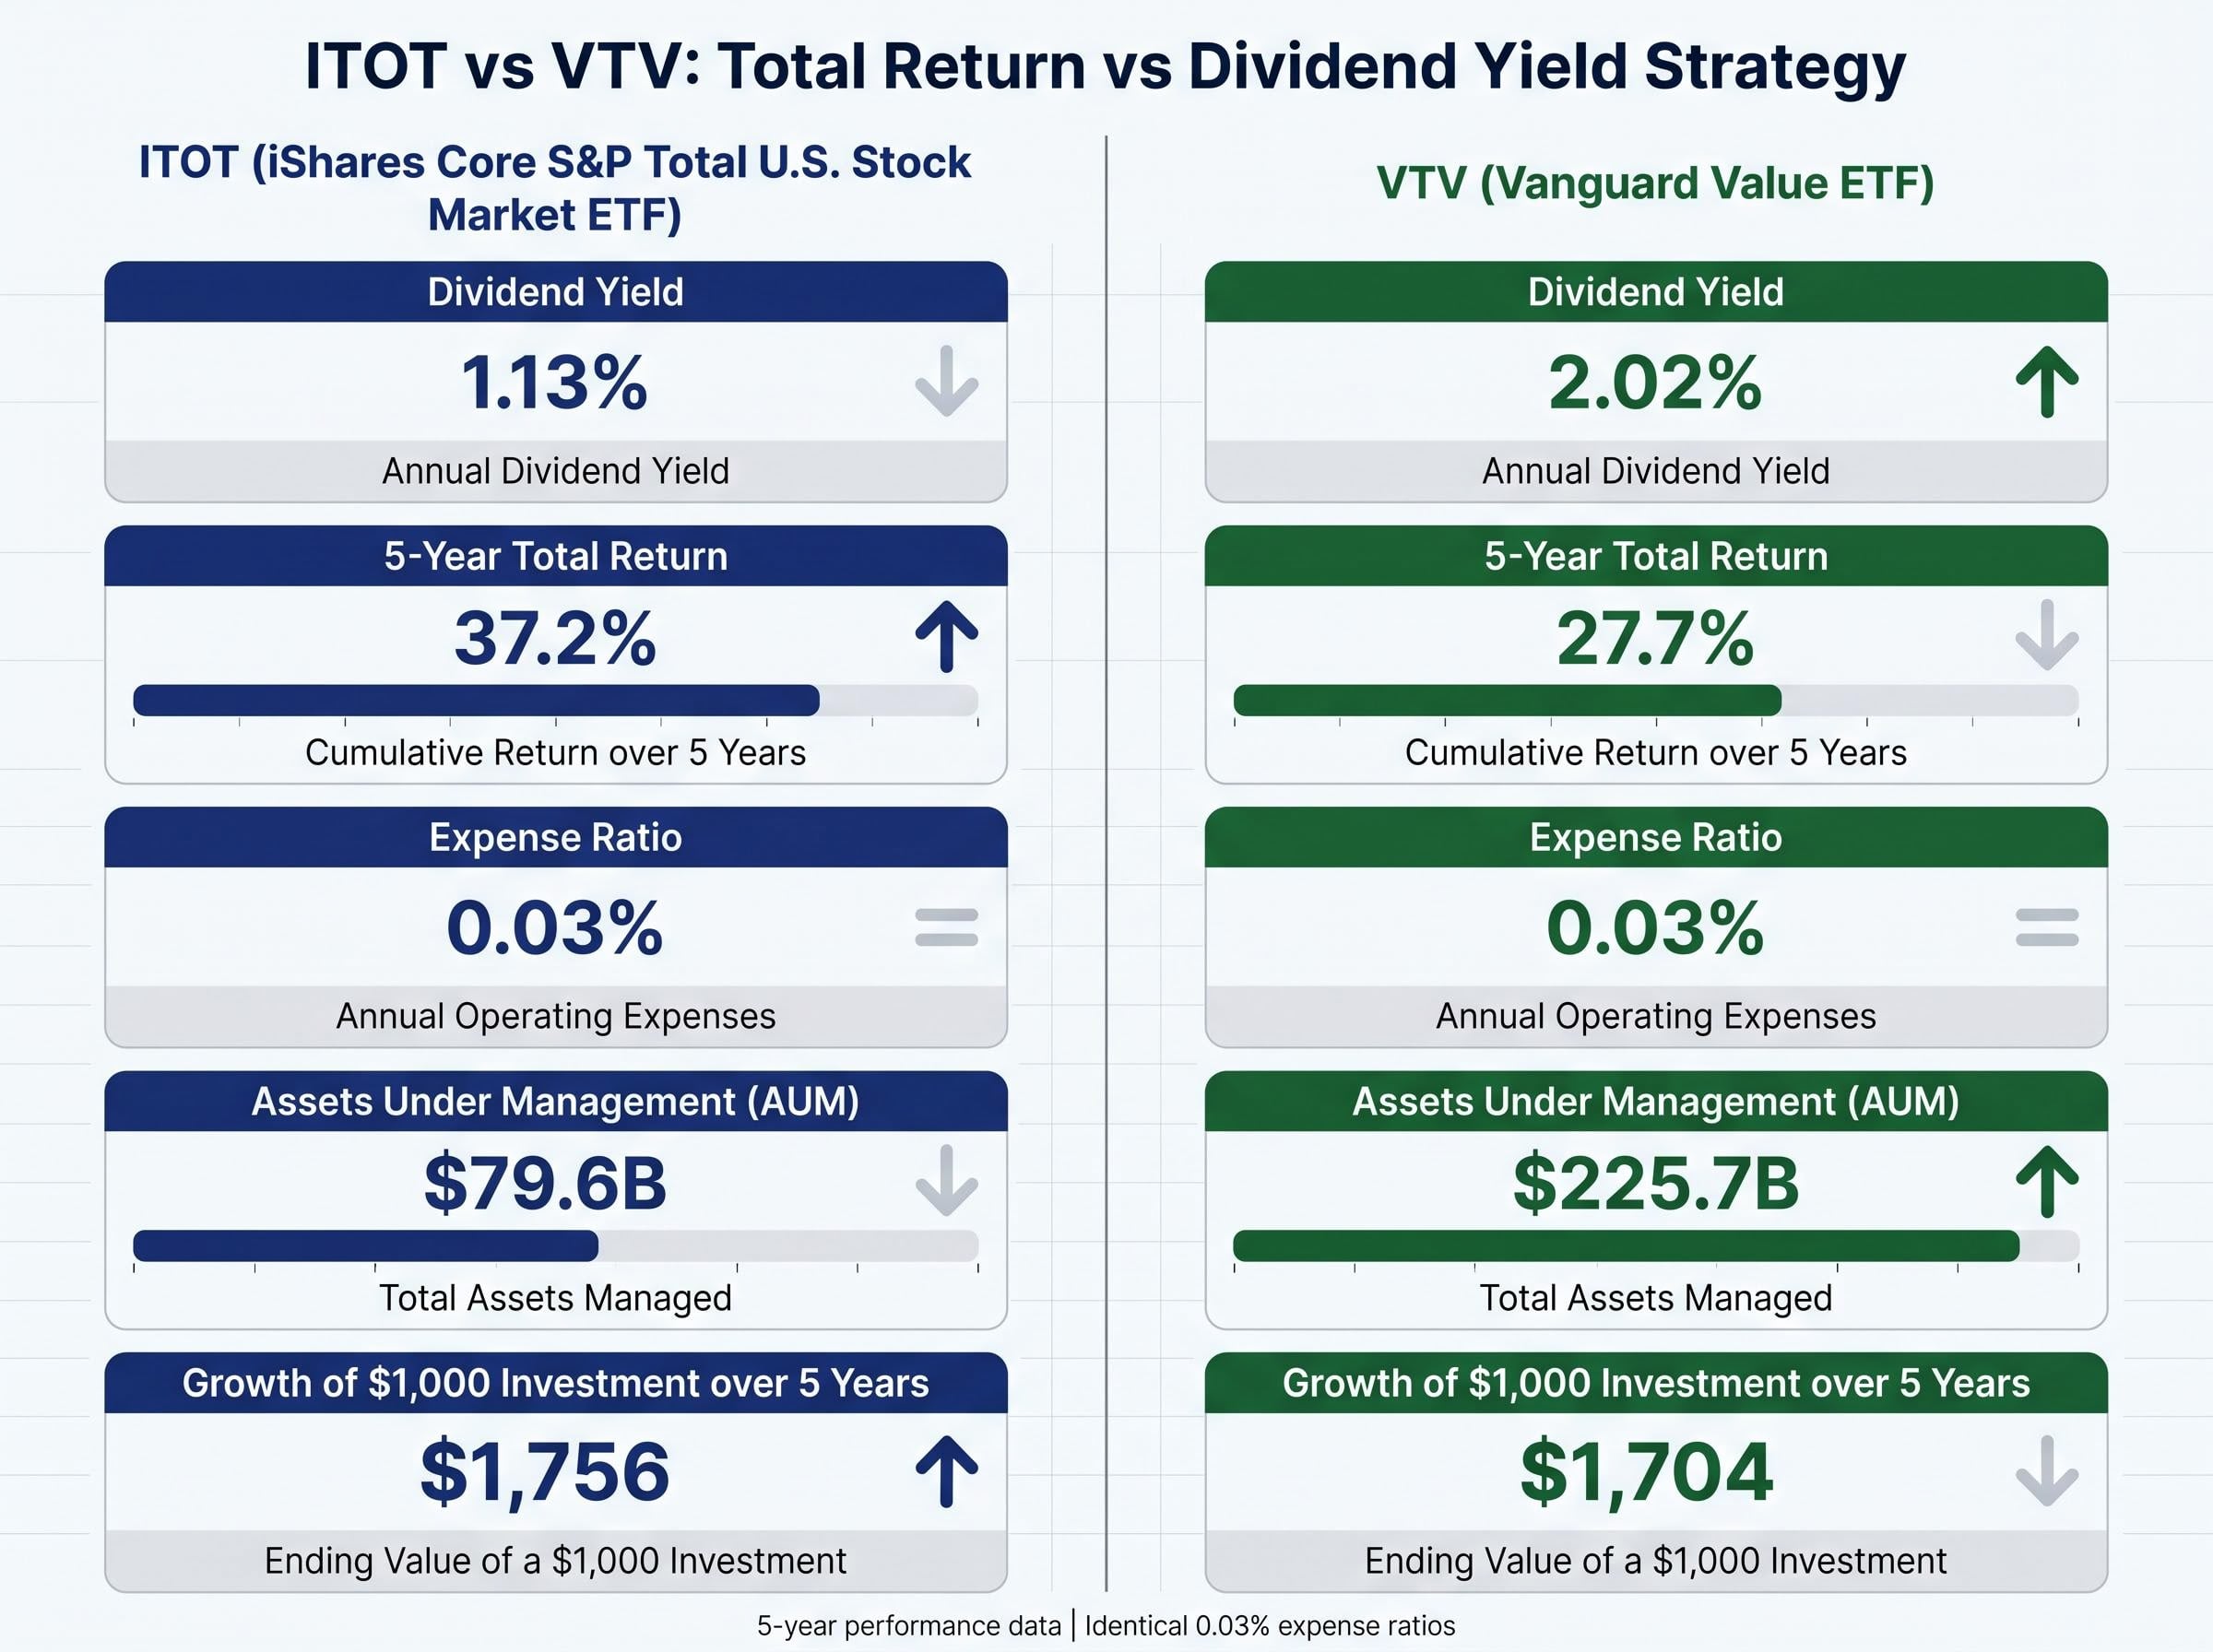
A $1,000 investment in ITOT grew to $1,756 over five years whilst the same amount in VTV reached $1,704, yet VTV’s 2.02% dividend yield nearly doubles ITOT’s 1.13%. The gap illustrates why raw returns alone cannot settle the dividend yield versus total return debate.
The 2026 market rotation away from technology concentration has reignited investor interest in dividend strategies. Value stocks outperformed growth by approximately eleven percentage points year to date, whilst dividend ETFs nearly doubled assets under management during 2025. This analysis examines when dividend yield strategies make sense versus when total return approaches dominate, using ITOT and VTV as case studies to help investors match their strategy to their circumstances, time horizon, and risk tolerance.
Dividend yield measures the annual income percentage from distributions. Total return captures the combined result of price appreciation plus reinvested dividends. The distinction is definitional, but the practical impact runs deeper.
Two investors start with identical capital. One holds a dividend-focused portfolio, receives quarterly distributions, and uses that cash for living expenses or reinvestment elsewhere. The other holds a total-return-focused portfolio, sees the same economic value accrue through price appreciation, and accesses it by selling shares when needed. The first investor experiences portfolio value through cash flows. The second experiences it through systematic rebalancing.
Neither approach is inherently superior. Each serves different investor objectives and circumstances. The choice between them is not about finding the “better” option but about matching investment approach to personal financial goals and life stage.
For readers new to equity investing who need to understand the foundational mechanics before comparing specific strategies, our beginner’s guide to index fund investing explains how index funds work, why diversification matters, and how to set up automated contributions that remove emotional decision-making from the investment process.
The ITOT versus VTV comparison demonstrates the trade-off in action. ITOT delivered 37.2% total return with 1.13% yield. VTV delivered 27.7% total return with 2.02% yield. Both funds carry identical 0.03% expense ratios, isolating the strategy difference. VTV manages approximately $225.7 billion versus ITOT’s $79.6 billion, suggesting substantial investor demand for dividend-focused approaches.
| Metric | ITOT | VTV |
|---|---|---|
| Dividend Yield | 1.13% | 2.02% |
| Total Return (5-Year) | 37.2% | 27.7% |
| Expense Ratio | 0.03% | 0.03% |
| Assets Under Management | $79.6B | $225.7B |
Understanding this distinction helps investors recognise that choosing between these strategies is not about finding the “better” option but about matching investment approach to personal financial goals and life stage.
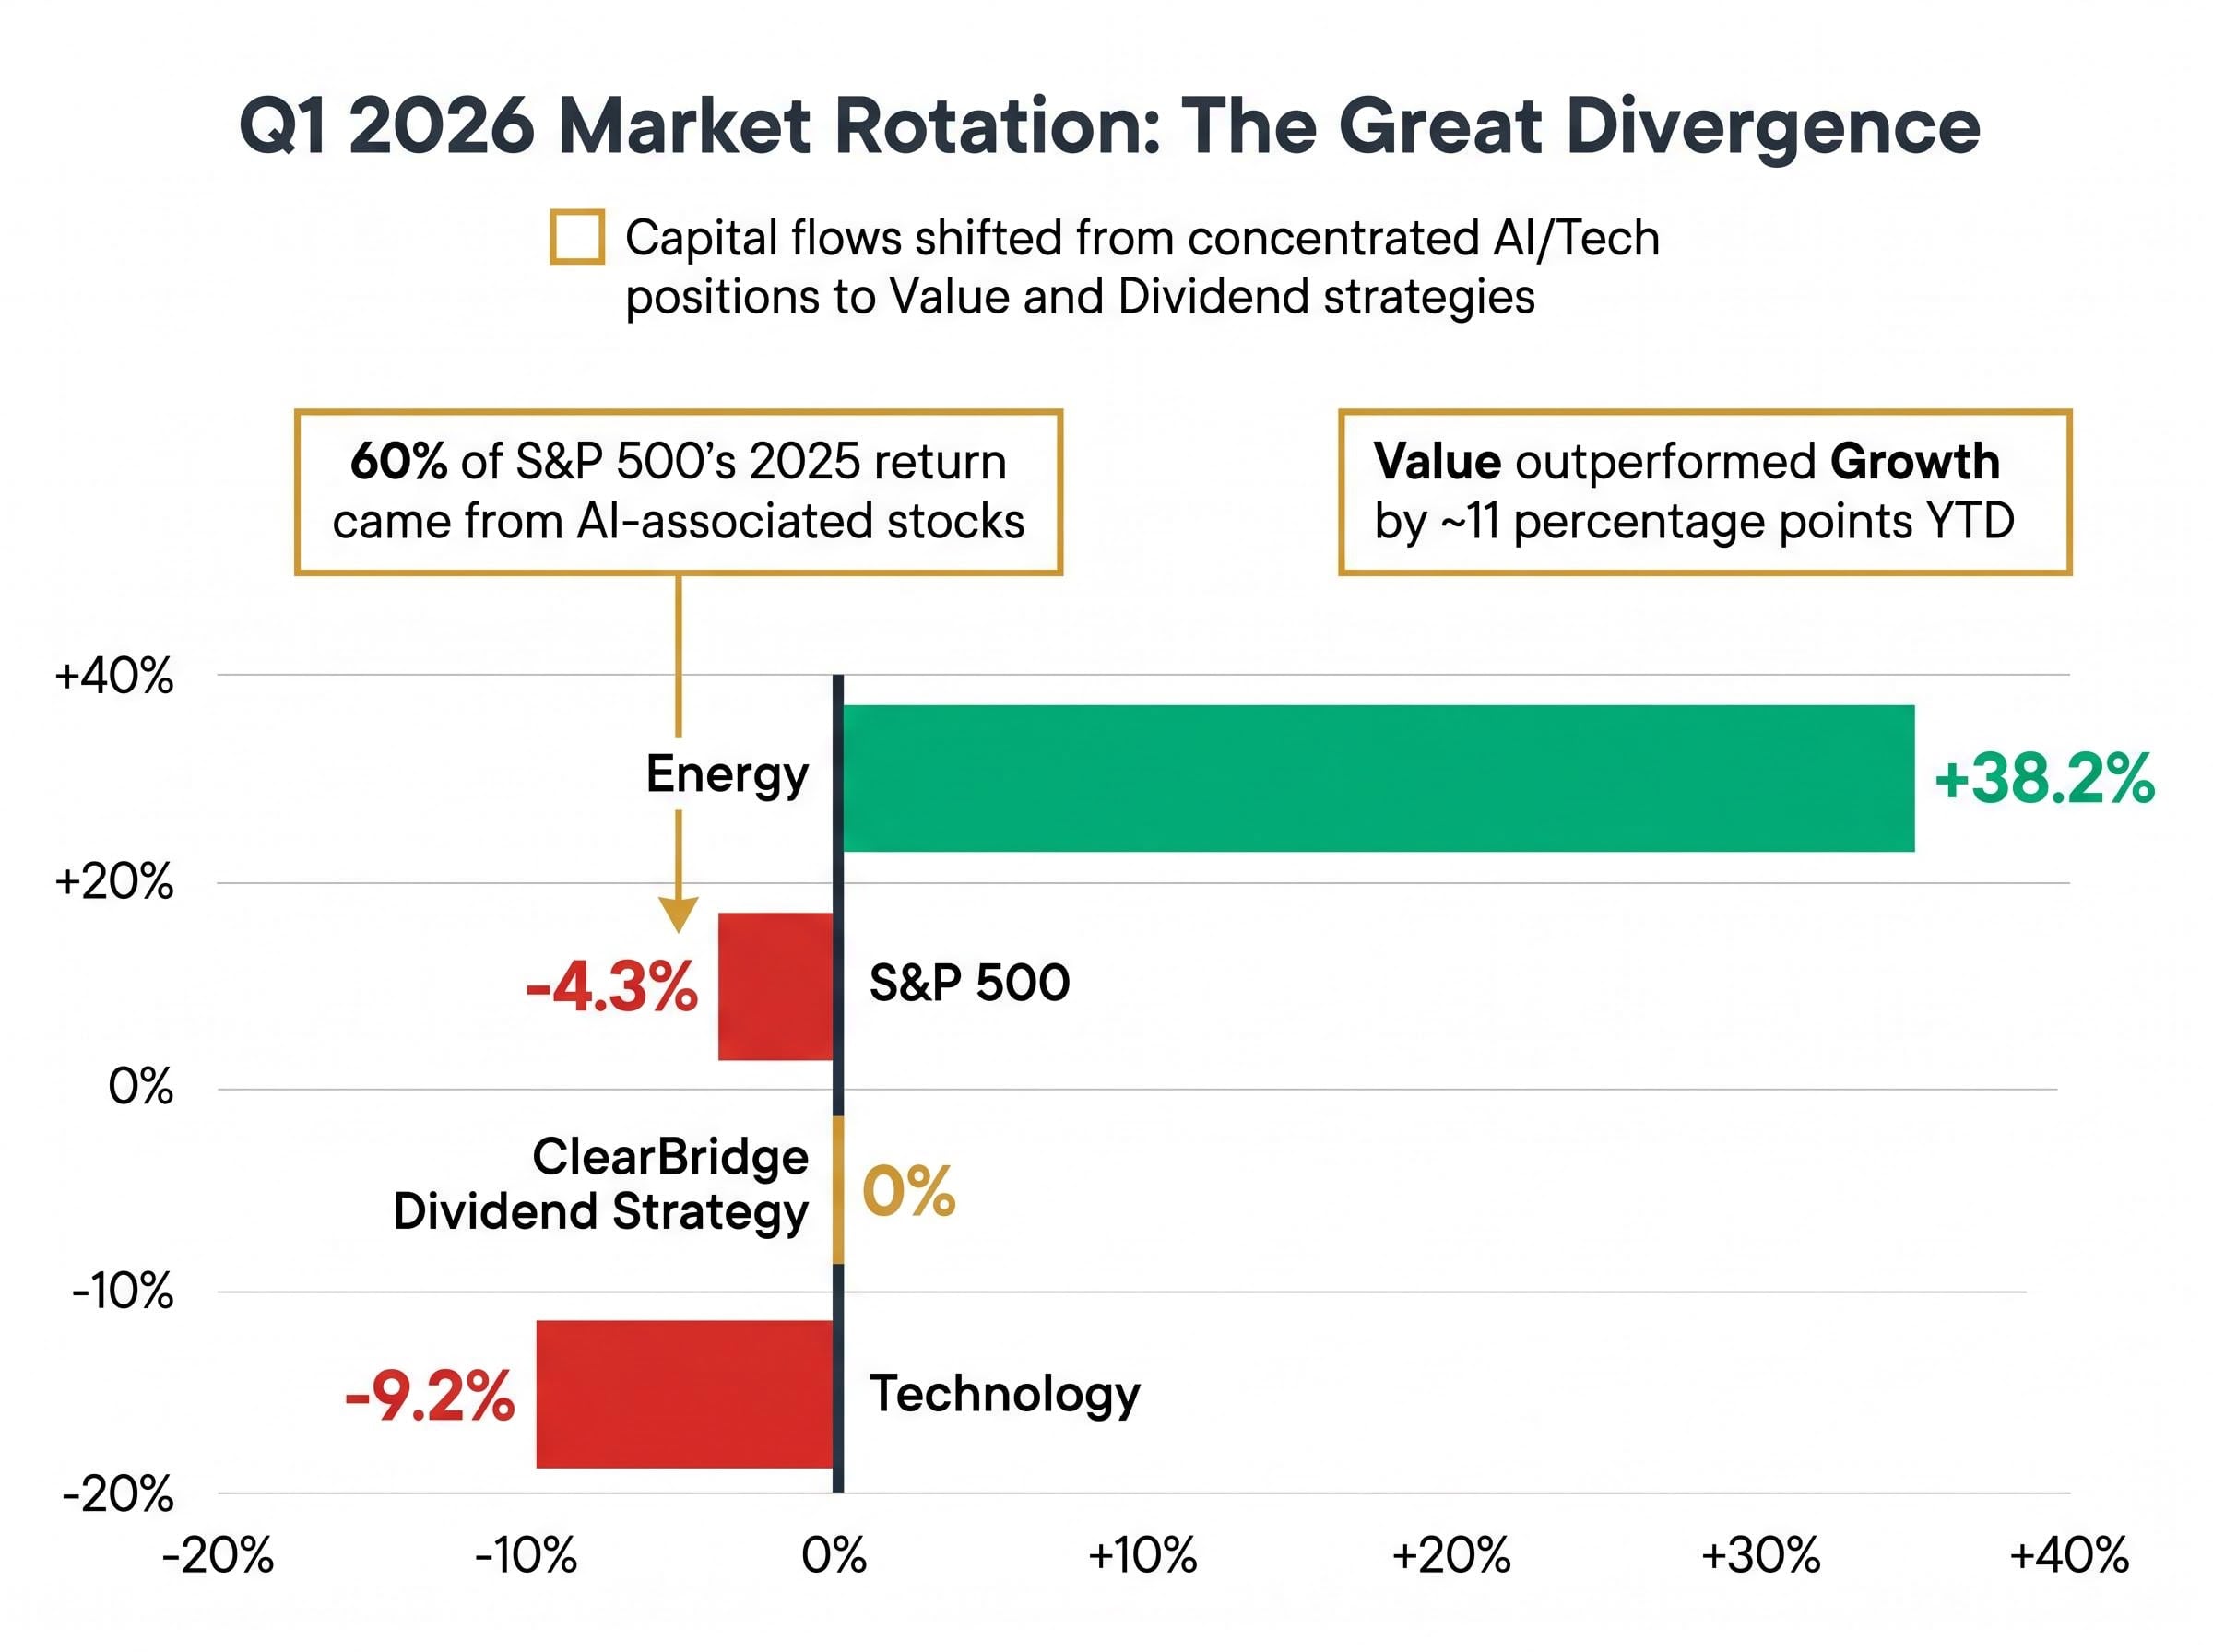
Approximately 60% of the S&P 500’s 2025 return came from AI-associated stocks. That concentration created risk that prompted investor reallocation starting in late 2025 and accelerating through the first quarter of 2026.
The rotation is measurable. Value stocks outperformed growth by roughly eleven percentage points through February 2026. Energy surged 38.2% during Q1 2026 whilst technology declined 9.2% during Q1 2026. Traditional energy companies, which feature prominently in dividend portfolios, benefited from geopolitical tensions that pushed oil prices toward $100 per barrel.
The 2026 market rotation away from technology concentration has reignited investor interest in dividend strategies, with value stocks outperforming growth by approximately eleven percentage points year to date. Implementing disciplined rebalancing during volatile periods, rather than panic selling into drawdowns, allows investors to capture mean reversion opportunities whilst maintaining exposure to long-term equity returns.
ClearBridge Dividend Strategy remained approximately flat in Q1 2026 whilst the S&P 500 declined 4.3%.
The shift in capital flows reversed a five-year trend. Value funds netted more inflows than growth funds in Q1 2026. Dividend ETFs saw assets under management nearly double during 2025 as investors sought to reduce portfolio concentration risk whilst maintaining equity exposure.
Sector performance comparisons illustrate the divergence:
The Interactive Investor Q1 2026 market review documenting value’s outperformance reported global value returning 3.20% whilst global growth declined 6.62%, with energy surging 40.70% and technology falling 17.66%, confirming the sector rotation that drove capital flows into dividend strategies during the quarter.
Current market conditions illustrate that strategy performance is regime-dependent. Investors who understand when dividend strategies tend to outperform can make more informed allocation decisions rather than defaulting to one approach permanently. The 2026 environment, with its recognition of AI concentration risk and rotation into value and dividend strategies, exemplifies exactly the conditions under which dividend strategies outperform.
ITOT carries a five-year monthly beta of 1.04. VTV’s beta sits at 0.80. The difference translates directly into investor experience during market disruptions.
ITOT’s worst five-year drawdown reached negative 25.35%. VTV’s maximum decline hit negative 17.03%. An investor who held through a 25% drawdown experienced meaningfully different psychological and financial pressure than one who held through a 17% drawdown. The difference determines whether investors can stay invested through market downturns.
VTV’s value-stock orientation, with heavier weightings in financials, healthcare, and industrials, produces milder price fluctuations. ITOT’s technology-heavy allocation, approximately 32% of assets, drives both its higher return potential and larger drawdowns. ITOT holds approximately 2,500 stocks across the full market whilst VTV concentrates on large-cap value companies.
ITOT’s technology-heavy allocation, approximately 32% of assets, drives both its higher return potential and larger drawdowns. Current forward P/E valuation levels and long-term return expectations suggest that elevated technology sector multiples create headwinds for cap-weighted index returns, with JPMorgan projecting annualised returns of 5% or less at 20.8 times forward earnings over the next decade.
| Risk Metric | ITOT | VTV |
|---|---|---|
| Five-Year Beta | 1.04 | 0.80 |
| Maximum Drawdown | -25.35% | -17.03% |
| Holdings Count | ~2,500 | 311 |
| Technology Allocation | ~32% | Lower |
Volatility tolerance directly impacts whether investors can stay invested through market downturns. Risk profile is a critical factor in choosing between these approaches regardless of which strategy might produce higher long-term returns. The investor who sells during a 25% drawdown locks in losses and misses the subsequent recovery. The investor who holds through a 17% drawdown with a defensive portfolio maintains exposure and benefits from the recovery.
Qualified dividends receive favourable tax treatment. Ordinary income faces rates up to 37%. Qualified dividends face rates of 0%, 15%, or 20% depending on income level.
For 2026, single filers pay:
Married filers face the 15% threshold at $98,901 and the 20% threshold at $613,700.
Reinvested dividends remain taxable in the year earned. Unrealised capital gains in growth stocks defer taxation until sale. A Treasury bill yielding 4.5% reduces to approximately 2.7% after-tax for high-income investors. Qualified dividend income retains substantially higher after-tax value.
The difference narrows the apparent advantage of growth strategies. A dividend strategy generating 2% after-tax yield combined with 4% annual capital appreciation delivers 6% total after-tax return. A growth strategy generating 1% capital gains distributions and 7% unrealised capital appreciation delivers approximately 8% total return pre-tax, but perhaps 6.5% to 7% after-tax when the eventual capital gains tax is contemplated.
Holding dividend-paying securities in tax-advantaged accounts maximises tax efficiency through deferral. The investor pays no current tax on dividends received in a 401(k) or IRA. The entire distribution compounds tax-deferred.
Growth stock placement in taxable accounts allows capital gains deferral. The investor pays no tax on unrealised appreciation, potentially for decades. The eventual sale triggers long-term capital gains treatment at 0%, 15%, or 20% rates, the same favourable rates applied to qualified dividends but deferred for the entire holding period.
Tax considerations can narrow or widen the apparent advantage of one strategy over another. Investors who ignore after-tax analysis may choose strategies that underperform on the metric that actually matters: wealth retained after the IRS takes its share.
Dividend yield strategies prove compelling for retirees requiring cash income. The quarterly distributions provide predictable cash flows without requiring active portfolio rebalancing or systematic asset sales. The psychological and practical benefit of living on dividend income rather than systematically reducing portfolio size often outweighs purely mathematical calculations of total return.
Tax-sensitive investors in taxable accounts benefit from the favourable treatment of qualified dividends. Those seeking reduced portfolio volatility without abandoning equity exposure benefit from dividend strategies, which historically exhibit lower volatility and greater downside protection during market disruptions.
Total return strategies prove optimal for young investors with decades until retirement. The compounding benefit of reinvesting all returns, combined with the tax efficiency of unrealised capital gains in growth stocks held in tax-advantaged accounts, outweighs the diversification and stability benefits of dividend strategies. Research shows that even a modest 1-2% annual difference in returns compounds to hundreds of thousands of dollars over four decades.
Investors with substantial non-portfolio income who do not require portfolio distributions can continue reinvesting all returns. For these investors, the tax efficiency of long-term capital gains, where no tax is paid until position sale, exceeds even the favourable treatment of qualified dividends, where tax is paid annually on distributions.
Schwab research shows dividend growers outperformed the market by 3.1% annually over 20 years whilst dividend cutters underperformed by 12.5% annually. Companies paying out more than 80% of earnings as dividends have historically been most likely to reduce dividends, making payout ratio sustainability thresholds critical in distinguishing stable income streams from high-yield traps.
The long-term performance advantage of dividend growth strategies is measurable. Schwab research showing dividend growers outperformed the market by 3.1% annually over 20 years validates the approach for investors seeking both income and capital appreciation, whilst the same research found dividend cutters underperformed by 12.5% annually, highlighting the importance of dividend sustainability screening.
Schwab research shows dividend growers outperformed the market by 3.1% annually over 20 years whilst dividend cutters underperformed by 12.5% annually.
High-yield traps represent a meaningful risk. Declining stock prices artificially inflate yields for distressed companies. Companies paying out more than 80% of earnings as dividends have historically been most likely to reduce dividends. VTV’s top holdings include Berkshire Hathaway, JPMorgan Chase, and Exxon Mobil, representing stable, established businesses rather than high-yield traps.
Circumstances favouring dividend strategies:
Circumstances favouring total return strategies:
Long-term VTV investors who purchased at $62 in 2006 now collect approximately $4 per share annually, representing a 6.4% yield on original investment. The yield-on-cost dynamic demonstrates how dividend-focused strategies compound returns over decades as companies consistently grow their dividend payments.
Strategy selection should flow from self-assessment of income needs, time horizon, and volatility tolerance rather than performance chasing. The optimal strategy for one investor may be counterproductive for another.
The dividend yield versus total return debate resolves not through declaring a winner but through matching strategy to circumstance. ITOT’s 37.2% total return serves different investor needs than VTV’s 2.02% yield and defensive positioning.
As the 2026 rotation into value and dividend strategies continues, investors who understand both approaches can construct portfolios that incorporate multiple return drivers rather than betting entirely on one philosophy. The market’s shift toward dividend strategies, evidenced by doubled assets under management in dividend ETFs during 2025 and value funds receiving net inflows for the first time since 2020, signals meaningful investor reallocation away from concentrated technology positions.
Assess whether your current allocation reflects your actual income needs, time horizon, and volatility tolerance. Consider whether the market’s shift toward dividend strategies signals an opportunity to rebalance. The concentration risk that characterised 2025, with approximately 60% of the S&P 500’s return driven by AI-associated stocks, has prompted substantial capital flows into dividend and value strategies. For investors who previously held predominantly concentrated growth portfolios, deliberately incorporating dividend-growth strategies or value-focused positions provides meaningful risk reduction whilst maintaining equity exposure.
This article is for informational purposes only and should not be considered financial advice. Investors should conduct their own research and consult with financial professionals before making investment decisions.
Dividend yield measures the annual income percentage a portfolio generates from distributions, while total return captures the combined result of price appreciation plus reinvested dividends. The practical difference is that dividend investors receive regular cash flows, whereas total return investors access value through price appreciation and systematic share sales.
Over five years, ITOT delivered a 37.2% total return compared to VTV's 27.7%, but VTV offers a higher 2.02% dividend yield versus ITOT's 1.13% and a lower maximum drawdown of 17.03% versus ITOT's 25.35%. The better choice depends on whether you prioritise income, lower volatility, or maximum capital growth.
Dividend strategies tend to outperform during market rotations away from high-growth sectors, as seen in Q1 2026 when value stocks outperformed growth by approximately eleven percentage points and energy surged 38.2% while technology fell 9.2%. They also suit retirees, tax-sensitive investors in taxable accounts, and those seeking reduced portfolio volatility.
Qualified dividends are taxed at 0%, 15%, or 20% depending on income level, which is significantly more favourable than ordinary income rates of up to 37%, while unrealised capital gains in growth stocks defer taxation entirely until the position is sold. Holding dividend-paying securities in tax-advantaged accounts like a 401(k) or IRA eliminates the annual tax drag on distributions.
A dividend yield trap occurs when a declining stock price artificially inflates a company's yield, making it appear attractive when the business is actually in distress. Investors can avoid traps by screening for payout ratio sustainability, as companies paying out more than 80% of earnings as dividends have historically been most likely to cut their dividend.