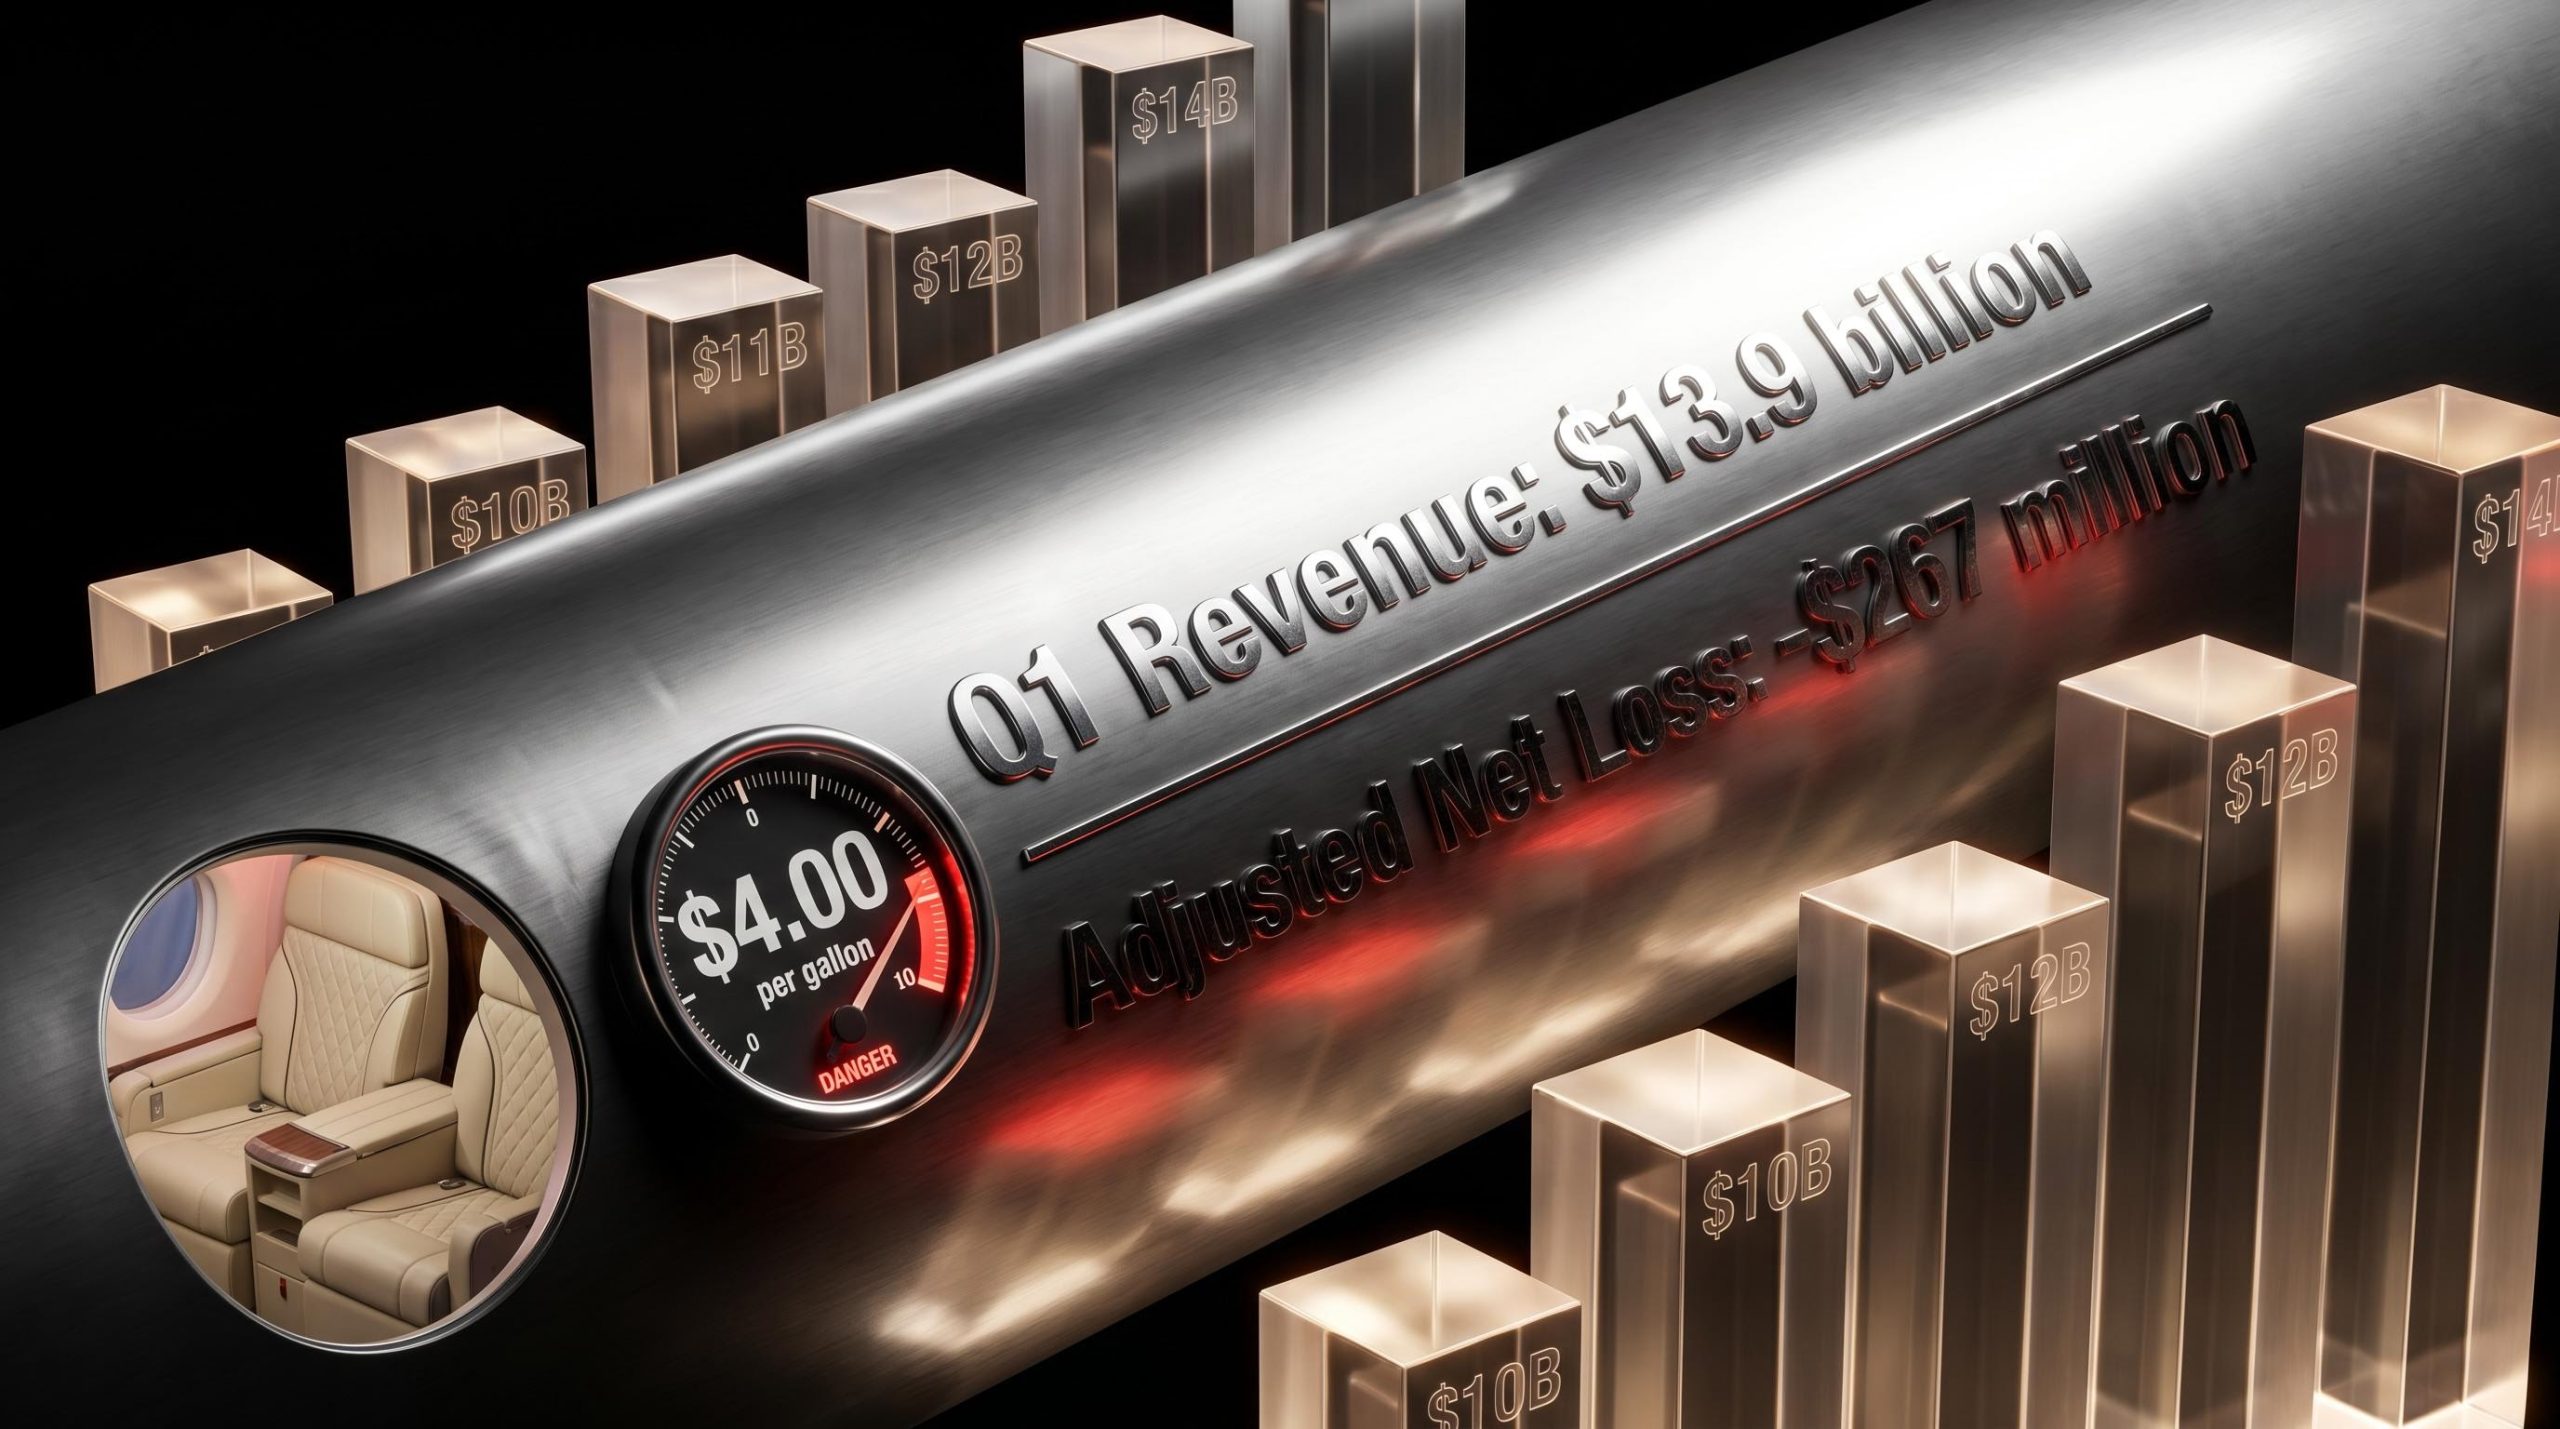
How $4B in Fuel Costs Erased American Airlines’ Record Q1
4 mins ago

The S&P 500 has rebounded to 7,122 after a 9% drawdown triggered by U.S.-Iran tensions, but the rally arrives at valuations that historically signal single-digit annual returns for the decade ahead. Investors face a tension between near-term momentum and long-term valuation constraints. Wall Street forecasts range from 7,500 to 8,000 by year-end, yet JPMorgan research suggests annualised returns of 5% or less when the index trades above 20 times forward earnings. This analysis unpacks what current valuations, earnings trajectories, and expert models actually imply for expected returns, giving readers a framework to calibrate their own expectations rather than chasing headline targets.
The S&P 500 closed at 7,122.64 on 21 April 2026, recovering from 6,582 in early April when geopolitical shocks pushed the index into a brief but sharp correction. The rally brought the index back above two critical technical thresholds: the 50-day moving average at 6,769 and the 200-day moving average at 6,690. Both lines held as support during the drawdown, and the recovery above them signals that institutional buyers stepped in at levels they viewed as oversold.
The April rebound in equities coincided with the April oil price crash from elevated geopolitical risk levels, where Brent crude fell 9.4% to $82 per barrel as markets recalibrated Iran-related supply disruption fears following ceasefire progress.
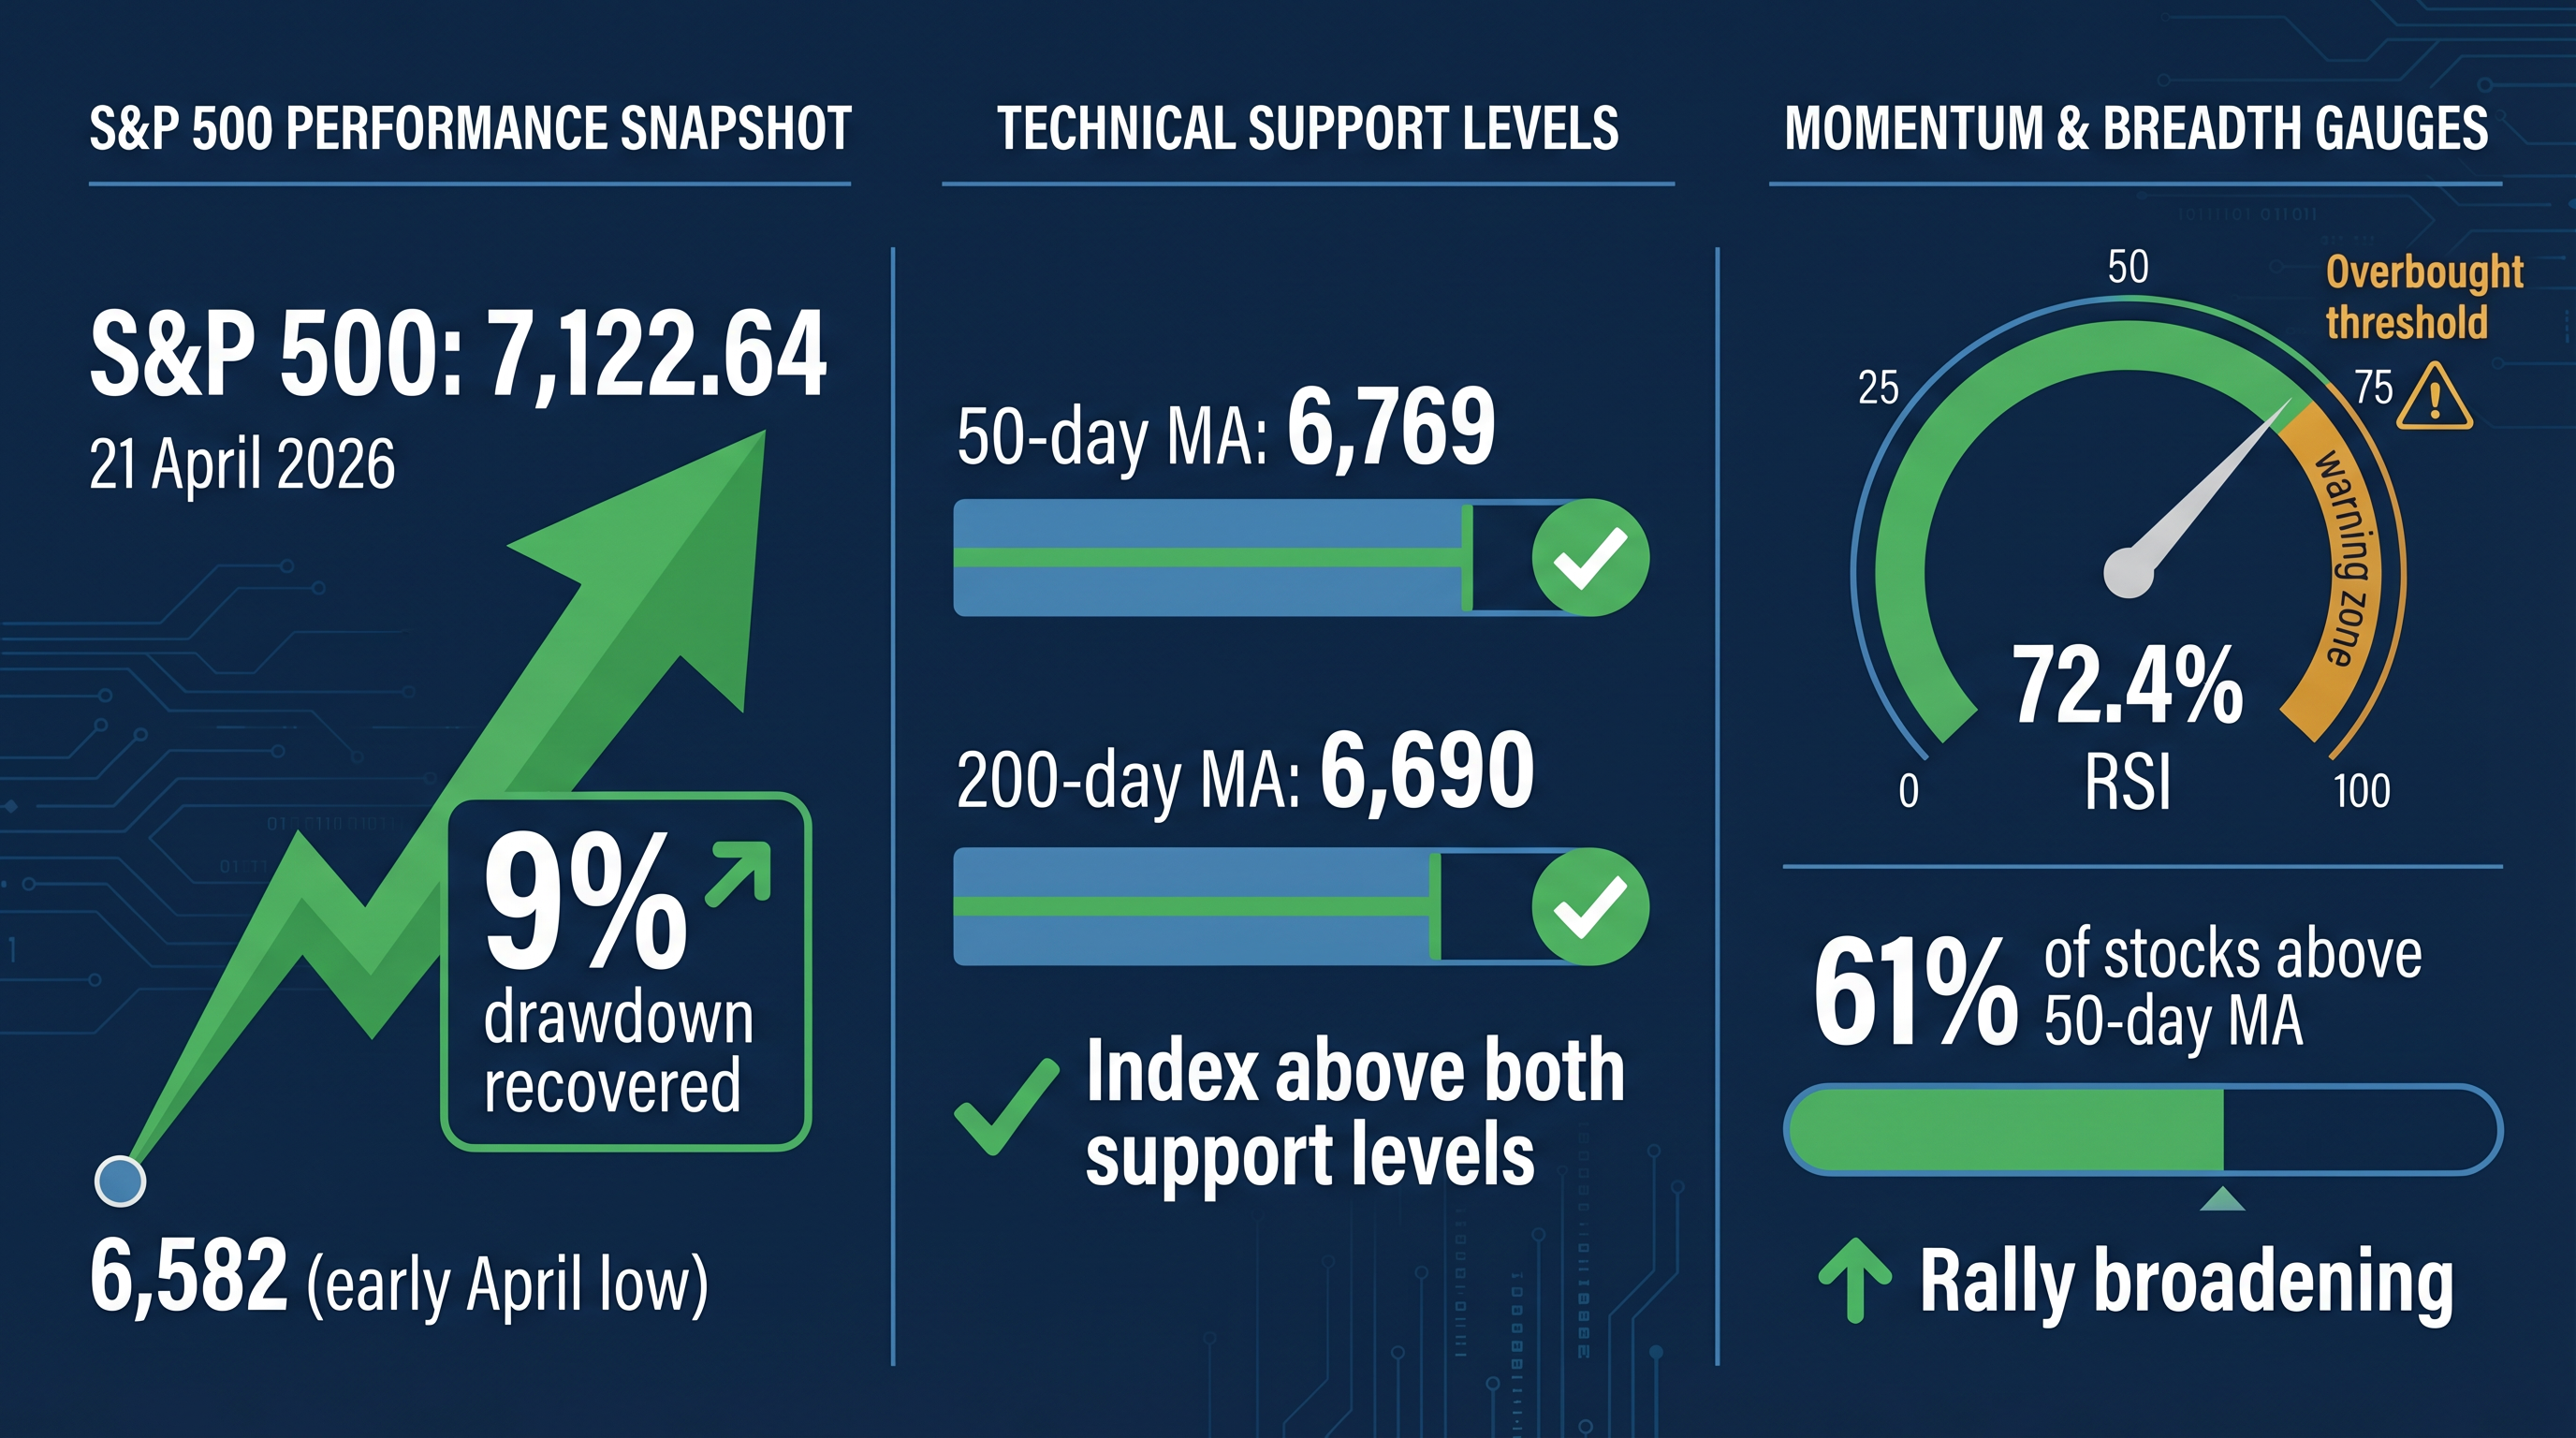
Momentum indicators show strength but also caution. The Relative Strength Index (RSI) now sits at 72.4%, approaching the overbought threshold of 75% that often precedes short-term pullbacks. Market breadth tells a similar story: over 61% of S&P 500 stocks are trading above their 50-day moving averages, a reading that suggests the rally has broadened beyond the mega-cap names that led the index higher through most of 2025.
Sentiment data, however, complicates the picture. Analyst surveys show elevated bullish sentiment, strong stock exposure levels, and persistently low cash reserves. These conditions closely match sentiment readings seen at previous market peaks, when positioning was crowded and vulnerable to reversal. The April rebound has brought relief, but the technical and sentiment backdrop suggests the index is trading at a level where further gains require either stronger earnings or a shift in valuation tolerance.
Valuation is not a timing tool, but it is a reliable predictor of what comes next over the following decade. The S&P 500’s forward 12-month price-to-earnings ratio stands at 20.8 as of April 2026, above both the 5-year average of 19.9 and the 10-year average of 18.9. The operating P/E, which excludes one-off charges and write-downs, sits at approximately 22.4. These multiples are supported by forward earnings per share of $309 for 2026, rising to $342 for 2027, according to consensus analyst estimates.
| Metric | Current (April 2026) | 5-Year Average | 10-Year Average |
|---|---|---|---|
| Forward 12-Month P/E | 20.8 | 19.9 | 18.9 |
The arithmetic connecting today’s valuation to future returns is straightforward. When the index trades above 20 times forward earnings, the starting multiple leaves less room for price appreciation driven by multiple expansion. Returns must come primarily from earnings growth and dividends. JPMorgan’s research on this relationship is specific: at above 20 times forward earnings, projected annual returns over the next 10 years are estimated at 5% or less. For context, the S&P 500 has delivered compounded annual returns of 10.5% since 1957 when dividends are reinvested.
The S&P 500 compounded annual return data since 1957 confirms the 10.5% historical performance with dividends reinvested, a baseline that makes the JPMorgan projection of 5% or less at current valuations a meaningful departure from long-term norms.
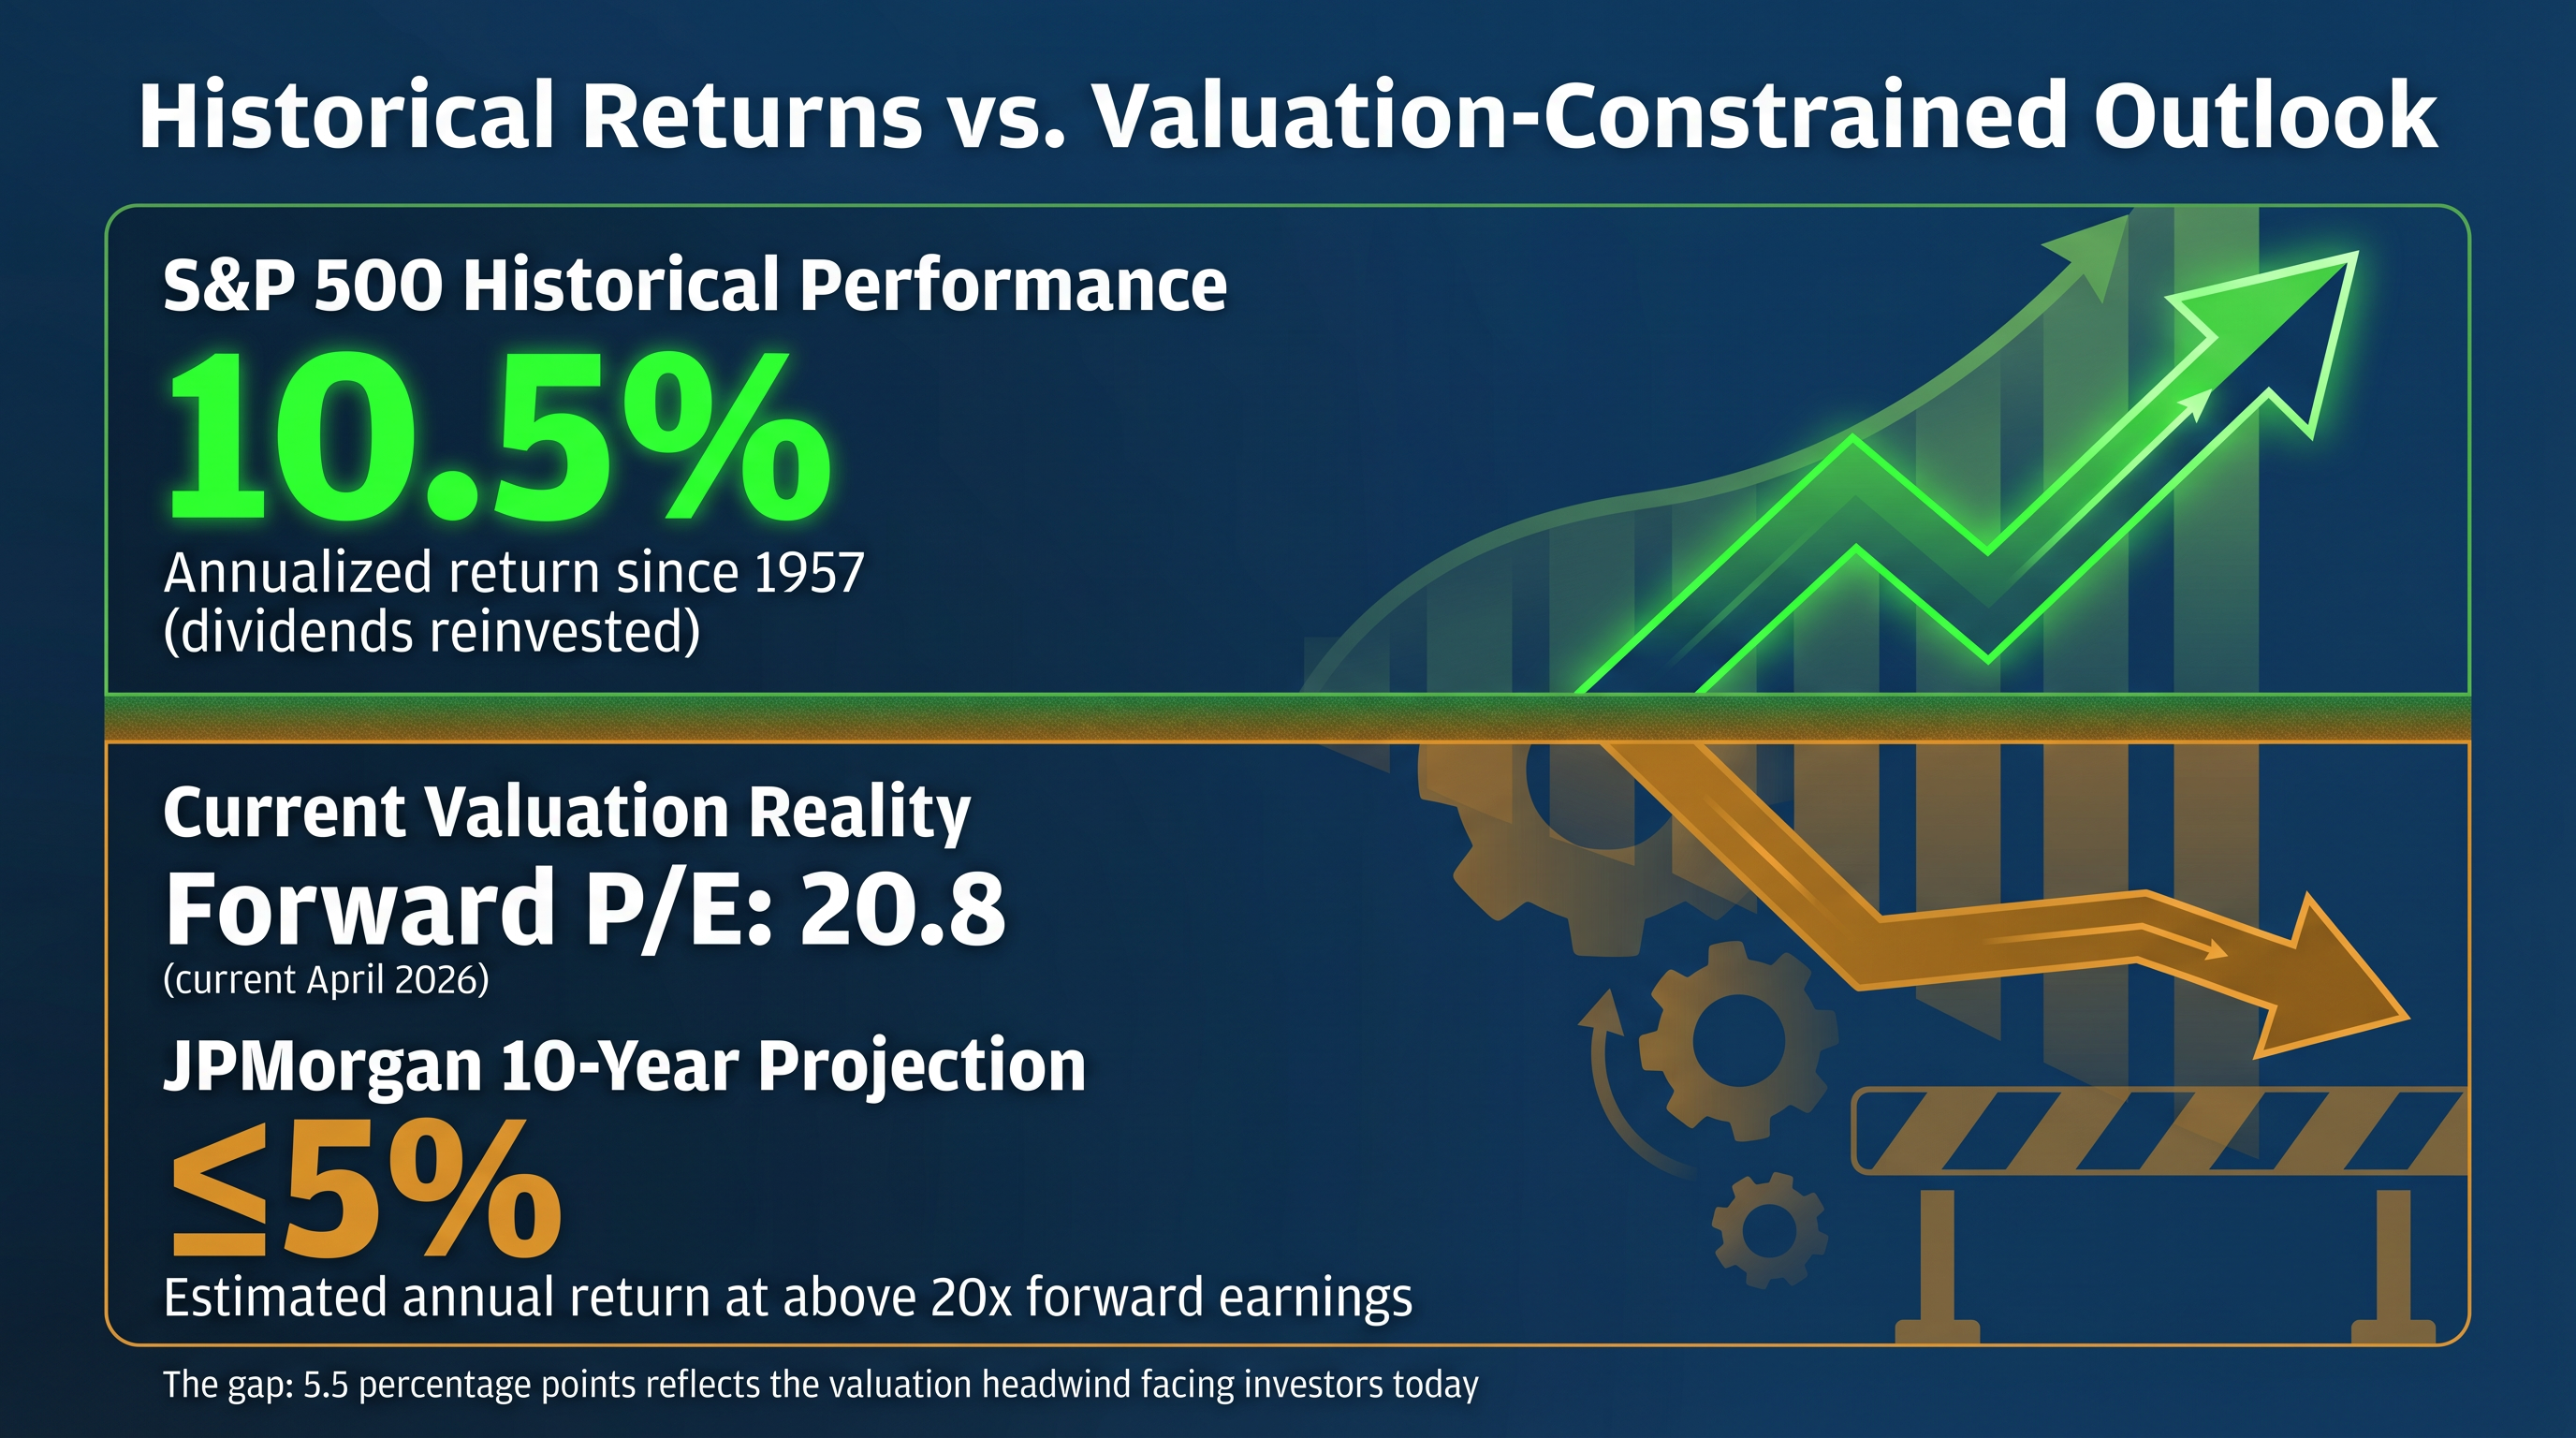
JPMorgan Long-Term Return Projection At above 20x forward earnings, projected annual returns over the next 10 years are estimated at 5% or less.
The gap between historical performance and valuation-constrained expectations matters because it frames the strategic choice investors face. Near-term forecasts pointing to 7,500 or 8,000 by year-end imply tactical gains of 5% to 12%, but those gains do not reset the valuation clock. The index reaching 8,000 by December 2026 would push the forward P/E higher still, compressing the long-term return outlook further. Elevated valuations do not guarantee declines, but they do mechanically limit what the next decade can deliver.
Wall Street’s year-end 2026 targets form a spectrum of assumptions rather than a consensus view. The range reflects different readings of how earnings will evolve, whether the Federal Reserve will deliver rate cuts as expected, and how sustained the current oil price stabilisation proves to be.
| Firm | Year-End Target | Implied Upside | Key Assumption |
|---|---|---|---|
| Deutsche Bank | 8,000 | 18% | U-shaped recovery, broad earnings growth |
| Goldman Sachs | 7,600 | 13.5% | 12% EPS growth to $309, AI productivity gains |
| JPMorgan | 7,500 | 11% | Stable oil, 2-3 Fed rate cuts |
| Barclays | 7,650 | 12% | Continued export growth, minimal disruptions |
| Citigroup | 7,700 | 13% | Forward earnings rising 10% to $350 |
Deutsche Bank’s chief strategist has set the most optimistic target at 8,000, implying 18% upside from current levels. This projection assumes a U-shaped recovery where broad-based earnings growth extends beyond mega-cap technology firms, and global conditions stabilise sufficiently to support margin expansion across sectors. The scenario depends on geopolitical tensions remaining contained and energy prices staying below the $90 threshold that would allow corporate capital expenditure to accelerate.
Goldman Sachs forecasts 7,600, a 13.5% increase, fuelled by expected EPS growth of 12% to around $309 per share. The firm’s bull case, which pushes the target toward 8,000, hinges on AI-driven productivity gains accelerating faster than current adoption curves suggest. This would require evidence that generative AI tools are translating into measurable margin improvements across industries, not just within the technology sector itself.
JPMorgan, Barclays, and Citigroup cluster around 7,500 to 7,700, with all three assuming 2-3 Federal Reserve rate cuts through the year. These forecasts treat monetary easing as the baseline case, supporting equity multiples by reducing the discount rate applied to future earnings. The shared assumption is that inflation pressures ease enough to give the Federal Reserve room to cut without reigniting price acceleration.
The shared assumption among strategists that 2-3 rate cuts will materialise rests on the relationship between oil prices and Federal Reserve policy flexibility, where sustained oil prices above inflation-triggering thresholds mechanically constrain the Fed’s ability to ease without reigniting price acceleration across the economy.
The bear case remains oil-dependent. If Brent crude sustains levels above $150 per barrel, strategists warn the index could retreat toward 5,400, representing a 15% decline from mid-April levels. A break below the 6,400 support level would trigger technical selling that could accelerate a move to 6,170, a major Fibonacci retracement. The range of outcomes is wide because the variables driving them (Fed policy, oil prices, earnings resilience) remain genuinely uncertain.
The S&P 500’s exposure to artificial intelligence is not a thematic overlay. It is a structural concentration. Information technology accounts for 32.9% of the index as of 31 March 2026. Three names alone (Nvidia, Apple, Microsoft) command a combined market capitalisation of approximately $12 trillion, and all five major mega-cap technology firms are deeply involved in AI infrastructure, software, or hardware development.
This concentration creates a dual exposure. If AI spending materialises as projected, the index benefits disproportionately. Nvidia’s CEO has projected that data centre infrastructure spending could reach $4 trillion annually by 2030, roughly 10 times historical levels. Forward EPS projections for the technology sector point to $350 by year-end, up from earlier estimates, as companies capitalise on surging demand for AI-related products and services. If oil prices stabilise below $90, enabling increased corporate investment in technology, AI-driven productivity gains could help justify current valuations and potentially accelerate S&P 500 EPS growth to 12-15% annually.
Nvidia CEO Projection Data centre infrastructure spending could reach $4 trillion annually by 2030, roughly 10 times historical levels.
The risk side of this concentration is equally pronounced. Technology sub-sector P/E ratios average 25-28, well above the broader index multiple. If these valuations compress (either because AI adoption disappoints or because interest rates stay higher for longer), the index falls harder than it would with a more balanced sector composition. Supply chain vulnerabilities tied to Asian chip manufacturing add another layer of fragility, though recent ceasefires in the Middle East have eased immediate concerns about energy-driven disruptions to global logistics.
Analysts have begun flagging “AI Tailwinds Face Rising Contrarian Risks” as a thematic concern. The language reflects caution that current AI enthusiasm may be pricing in outcomes that have not yet materialised in corporate earnings. Elevated valuations in the technology sector leave little margin for execution risk. If AI spending slows, or if productivity gains take longer to appear in profit margins than current forecasts assume, the sector’s premium multiples become harder to defend.
Diversification beyond technology is not a hedging tactic. It is a response to the mathematical reality that the index’s returns are now disproportionately tied to five companies and one sector thesis. Investors holding broad index funds are implicitly making a concentrated bet on AI materialising as the dominant economic force of the next decade. That may prove correct, but the positioning is deliberate rather than diversified.
Valuation analysis and forecast scenarios do not self-execute as portfolio decisions. The translation requires a framework that connects the outlook to specific allocation choices investors can evaluate this week.
The immediate question is entry timing. At 7,122, the index is trading above both moving averages and near recent highs, but below the most optimistic year-end targets. Fibonacci retracement analysis suggests potential support around 6,900 if geopolitical tensions flare again or if earnings disappoint. For investors adding exposure, dollar-cost averaging at current levels reduces the risk of mistiming a pullback, while keeping dry powder to deploy at 6,900 captures opportunistic entry if the market retraces.
Historically, April has averaged a 1.6% return with a 68% gain frequency over the past 50 years. The month’s track record suggests a short-term tailwind, but the pattern is descriptive rather than predictive. The current April is already reflecting that historical tendency, with the index recovering from early-month lows.
Allocation balance matters more than timing precision. A portfolio positioned for the Deutsche Bank 8,000 scenario but unprepared for the oil-shock bear case to 5,400 is mis-calibrated to the range of outcomes. A 10-15% allocation to defensive sectors (utilities, healthcare) provides a buffer against volatility without abandoning growth exposure. These sectors historically hold value better when oil prices spike and recessionary fears build.
Three monitoring triggers should guide repositioning decisions:
For investors wanting to position ahead of upcoming earnings releases rather than reacting to results, our comprehensive walkthrough of KPI screening for earnings winners details the specific operational metrics, margin trends, and consensus revision patterns that historically signal which companies will beat estimates and sustain post-earnings momentum.
The framework is not a prediction. It is a decision tree that maps the scenarios outlined by strategists to specific portfolio responses. The goal is not to call the top or bottom, but to position for the range of outcomes the research supports.
The S&P 500 at 7,122 embodies a tension that valuation alone cannot resolve. Near-term momentum, supported by technical recovery and Wall Street targets ranging from 7,500 to 8,000, suggests tactical upside of 5% to 12% by year-end. Long-term valuation constraints, with the index trading at 20.8 times forward earnings, point to annualised returns of 5% or less over the next decade according to JPMorgan research. Both readings can be simultaneously accurate.
The range of outcomes is wide because the variables driving them remain genuinely uncertain. Federal Reserve policy, oil price trajectories, AI spending materialisation, and earnings resilience through a late-cycle environment are all inputs that could tilt the index toward 8,000 or back toward 6,400. Investors anchoring to a single forecast are substituting precision for probability-weighted thinking.
Stress-test your own return assumptions against the valuation math and scenario triggers outlined. If your portfolio is positioned for double-digit annualised returns over the next decade while the index trades at 20 times forward earnings, the positioning reflects optimism that either earnings will accelerate beyond current consensus or that valuations will re-rate higher still. That may occur, but it is a specific bet rather than a baseline expectation. Calibrate accordingly.
According to JPMorgan research, when the S&P 500 trades above 20 times forward earnings, projected annual returns over the next 10 years are estimated at 5% or less, well below the historical compounded annual return of 10.5% since 1957 with dividends reinvested.
When the index trades at elevated price-to-earnings multiples, there is little room for price appreciation driven by multiple expansion, meaning returns must come almost entirely from earnings growth and dividends rather than valuation re-rating.
Year-end 2026 targets from major firms range from JPMorgan at 7,500 to Deutsche Bank at 8,000, implying upside of roughly 11% to 18% from the April 2026 level of 7,122, with most forecasts assuming 2-3 Federal Reserve rate cuts through the year.
Information technology makes up 32.9% of the S&P 500 as of March 2026, meaning index returns are heavily tied to AI spending materialising as projected; if AI adoption disappoints or interest rates stay elevated, compressed tech valuations could drag the broader index lower.
Key levels to monitor include support at 6,900 (a potential Fibonacci retracement zone), a critical floor at 6,400 where a breakdown could accelerate selling toward 6,170, and the bear case trigger of Brent crude sustaining above $150 per barrel.