Investing During Market Volatility: What Works in 2026

Key Takeaways
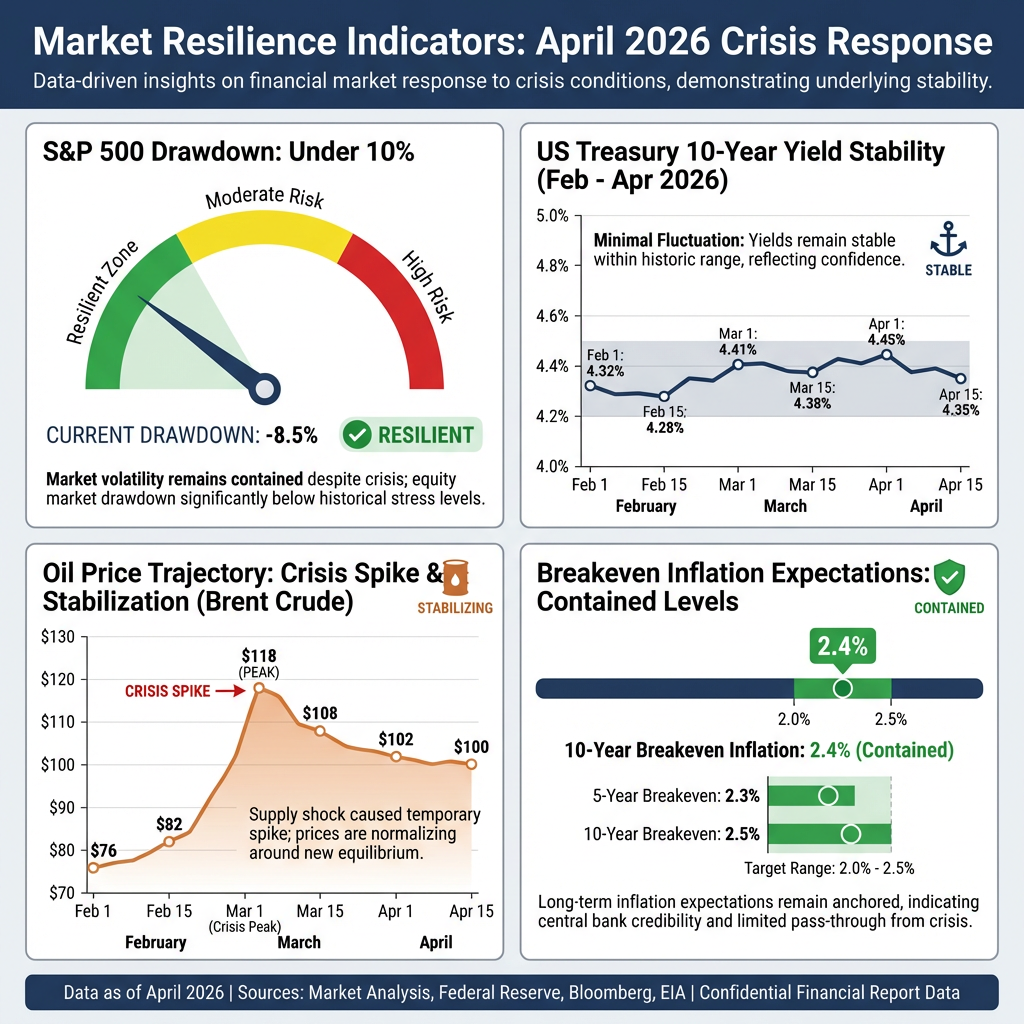
- The Strait of Hormuz blockade has disrupted 20% of global energy supplies, pushing oil prices to approximately $100 per barrel, yet the S&P 500 drawdown remains below 10%, signalling markets view the crisis as containable.
- Investors should consider adding exposure to energy and safe-haven assets like gold while evaluating whether long-duration growth equities and bonds carry excessive inflation risk in the current environment.
- The Federal Reserve held rates steady at its March 2026 meeting and now projects only one rate cut for the year, down from prior expectations, as sticky inflation and geopolitical uncertainty alter the policy outlook.
- Panic selling during volatile periods consistently underperforms disciplined rebalancing, as investors who sell into downturns frequently miss subsequent recoveries and damage long-term portfolio performance.
- Meaningful monitoring of Federal Reserve policy, energy market data, inflation readings, and corporate earnings provides a structured framework for navigating volatility without reacting to daily geopolitical headlines.
Market volatility has surged in April 2026 as the Iran conflict and Strait of Hormuz crisis disrupt global energy supplies. The blockade, which began in late February, has closed a critical shipping route handling 20% of worldwide energy flows, triggering oil price spikes and investor uncertainty. Yet despite turbulent headlines, the S&P 500 drawdown has remained below 10%, Treasury yields hold steady, and cross-asset signals suggest markets are pricing this as a containable disruption rather than a catastrophic crisis. For investors seeking to navigate these conditions, understanding the drivers behind current volatility and applying disciplined strategies can transform uncertainty into opportunity.
Understanding Market Volatility: What’s Really Happening in 2026
Market volatility refers to the degree of price fluctuation in securities over time. Elevated volatility means larger daily swings in asset values, but it does not necessarily signal sustained losses or a market crash. In practical terms, investors experience greater short-term uncertainty, yet disciplined positioning can mitigate risk and identify opportunities.
The primary driver of 2026 volatility is the Iran conflict and the resulting Strait of Hormuz blockade. This crisis began in late February 2026, disrupting a critical energy choke point responsible for 20% of global supplies. Oil prices initially spiked before stabilising around $100 per barrel by mid-April, as markets absorbed ceasefire announcements and assessed the likelihood of resumed tanker passage. While escalated US-Israel airstrikes and regional missile exchanges continue, cross-asset indicators reveal a measured market response.
The International Energy Agency has characterised the current situation as the greatest global energy security challenge in history, with implications extending beyond immediate price movements to fundamental supply infrastructure and long-term energy policy.
Several signals indicate markets view the situation as manageable:
- S&P 500 drawdown contained under 10%, suggesting investors are not anticipating severe economic outcomes
- Stable US Treasury yields, reflecting confidence in fixed-income markets
- Contained breakeven inflation rates, indicating expectations of short-term disruption rather than prolonged stagflation
- Oil prices stabilising around $100 per barrel after initial volatility
- Corporate earnings providing fundamental support for equity valuations
Historically, geopolitical events trigger short-term volatility spikes but produce limited long-term market disruption. The current market behaviour aligns with this pattern, demonstrating proportionate reactions rather than panic-driven selloffs. Investors who understand these dynamics can avoid overreacting to headlines whilst positioning portfolios strategically for the quarters ahead.
Historical patterns of market resilience during geopolitical shocks demonstrate that equity markets frequently recover from crisis-driven drawdowns when fundamental economic conditions remain supportive, a pattern consistent with current S&P 500 behaviour despite ongoing Middle East tensions.
When big ASX news breaks, our subscribers know first
Core Strategies for Investing During Volatile Markets
Leading investment professionals emphasise that successful navigation of volatility requires discipline over reaction. According to analysis from Fidelity, investors who maintain long-term strategic frameworks consistently outperform those making panic-driven adjustments during turbulent periods. The following three-pillar approach forms the foundation of professional volatility management.
Strategic Framework for Volatility Navigation:
- Avoid reactive portfolio changes driven by headlines or panic. Maintain long-term investment discipline even when daily news cycles create anxiety. Selling into volatility locks in losses and often results in missing subsequent recoveries.
- Maintain diversification across asset classes, sectors, and geographies. Ensure portfolios have balanced exposure to equities, bonds, commodities, and international markets. Diversification reduces concentration risk and provides stability during sector-specific disruptions.
- Position tactically by rebalancing toward inflation-resilient assets and identifying emerging opportunities. Use price swings to rebalance toward underweight positions, add to inflation-protected holdings, and reduce over-concentration in vulnerable sectors. This is active portfolio management, not market timing.
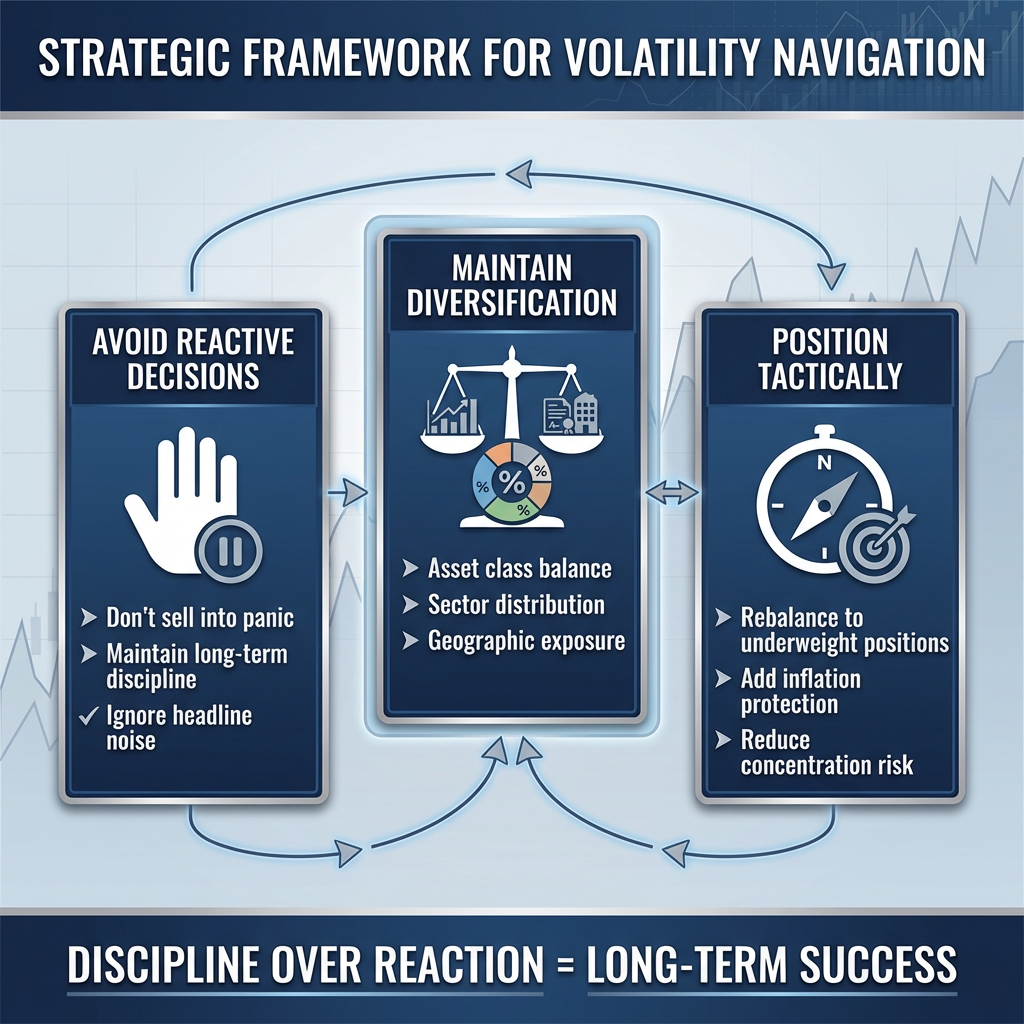
> Reactive investment decisions prompted by news events are consistently flagged by financial professionals as harmful to sustained wealth-building goals. The differentiator between successful and unsuccessful volatility navigation is maintaining strategic discipline whilst others succumb to emotional decision-making.
Tactical rebalancing during volatility involves using market swings as opportunities rather than threats. When equity prices decline, investors can rebalance toward underweight positions at more attractive valuations. When specific sectors surge (such as energy in the current environment), investors can trim overweight positions and deploy capital elsewhere. This disciplined approach improves long-term portfolio positioning without attempting to predict short-term market movements.
How to Position Your Portfolio for Current Conditions
Many investors in April 2026 face specific allocation challenges that leave portfolios vulnerable to the dual pressures of inflation and energy supply constraints. Common problems include under-allocation to inflation protection, over-allocation to long-duration growth equities, over-allocation to long-duration bonds, and excessive idle cash holdings. If energy constraints persist beyond current expectations, these positioning errors could expose portfolios to stagflation risk (slower growth combined with higher inflation).
| Asset Class | Current Performance | Q2 2026 Outlook | Action |
|---|---|---|---|
| Energy | Up year-to-date | Strong (supply tightness persists) | Consider adding exposure |
| Gold/Safe Havens | Climbing | Sustained (geopolitical demand) | Maintain or add allocation |
| International Markets | Emerging opportunity | Improving (Hormuz resolution) | Consider selective exposure |
| Bonds | Stable yields | Opportunities emerging | Evaluate duration positioning |
| Long-Duration Growth | Vulnerable to inflation | Pressured | Consider reducing exposure |
The energy sector represents a direct beneficiary of current supply constraints. Both crude oil and natural gas positions remain favourable as the Strait of Hormuz blockade limits global flows. This recommendation reflects fundamental supply-demand dynamics rather than speculative positioning. Investors under-allocated to energy may consider adding exposure through diversified energy funds or individual holdings in exploration, production, and midstream companies.
Safe-haven assets, particularly gold, have demonstrated strong performance driven by volatility and geopolitical uncertainty. Gold’s role in portfolios extends beyond panic-driven speculation. It provides diversification benefits, inflation protection, and historically low correlation to equities. Quality bonds, including US Treasuries and investment-grade corporate debt, offer portfolio stability and income. These allocations represent strategic diversification, not reactive flight to safety.
5 Common Investor Mistakes to Avoid During Volatility
Whilst many investors are reacting proportionately to current market conditions, specific behavioural and allocation errors can significantly undermine long-term portfolio performance. Identifying these mistakes is the first step toward avoiding them and maintaining disciplined investment practices during turbulent periods.
Common Volatility Mistakes:
- Selling into volatility rather than rebalancing strategically. Panic selling locks in losses and disrupts long-term allocation targets. Instead, use volatility as an opportunity to rebalance toward underweight positions at more attractive prices.
NBER research on panic selling during market volatility quantifies how investors who sell during downturns frequently miss subsequent recoveries and underperform disciplined investors who maintain allocation targets.
- Over-allocation to long-duration growth equities facing inflation pressure. High-growth companies with valuations based on distant cash flows are vulnerable when inflation rises. Energy-driven inflation from the Strait of Hormuz crisis puts additional pressure on these positions. Consider trimming exposure and reallocating to value-oriented or inflation-resilient sectors.
Understanding energy-driven inflation dynamics is essential for evaluating portfolio positioning, as energy price transmission affects not only headline inflation figures but also input costs across manufacturing, transportation, and consumer goods sectors.
- Over-allocation to long-duration bonds facing rate and inflation risks. Long-dated bonds lose value when inflation expectations rise or when central banks maintain higher rates for longer. With the Federal Reserve projecting one rate cut for 2026 (down from prior expectations) and sticky inflation above target, long-duration bonds face headwinds. Evaluate whether your bond allocation matches current conditions.
- Chasing recent performance without considering mean reversion. Sectors that have surged (such as energy) may experience consolidation. Sectors that have declined may offer value. Avoid buying high and selling low by maintaining allocation discipline rather than chasing momentum.
- Ignoring inflation protection despite clear energy-driven risks. The Strait of Hormuz blockade has created tangible inflation risk from energy price increases. Portfolios without inflation protection (commodities, inflation-linked bonds, real assets) are vulnerable if energy constraints persist longer than markets currently expect.
Investors should honestly evaluate their recent decisions. Have portfolio changes been driven by strategic rebalancing or by headline anxiety? Is current positioning appropriate for inflation risk? This self-assessment provides the foundation for corrective action before allocation errors cause lasting portfolio damage.
The next major ASX story will hit our subscribers first
What to Monitor: Key Indicators for Volatile Markets
Staying informed during volatile periods is essential, but not all information carries equal weight for investment decisions. Focusing on meaningful indicators whilst filtering out noise reduces anxiety and improves decision quality. The following framework identifies the data points that matter most for portfolio positioning in Q2 2026 and beyond.
Priority Monitoring Indicators:
- Federal Reserve policy decisions and statements. The Fed held rates steady at the March 17-18, 2026 meeting, with one rate cut projected for the year (down from prior expectations). Key considerations include sticky inflation above target, Iran conflict uncertainty, energy market volatility, and labour market impacts from energy shocks. Watch for policy pivots that could affect bond yields, borrowing costs, and equity valuations.
The dramatic reversal in Fed rate cut expectations from two anticipated cuts at the start of 2026 to just one projected reduction reflects how energy market shocks have fundamentally altered the central bank’s policy calculus and timeline.
- Energy market data and oil supply developments. Oil futures, refinery capacity, strategic petroleum reserve releases, and production data from major suppliers. These metrics signal whether energy constraints are easing or intensifying.
- Strait of Hormuz status and tanker passage. Updates on blockade developments, ceasefire negotiations, and resumed shipping activity directly affect oil supply and price expectations.
- Inflation readings (CPI, PCE, breakeven rates). Headline consumer price index (CPI) and personal consumption expenditures (PCE) will capture the impact of oil price surges. Breakeven inflation rates (derived from Treasury Inflation-Protected Securities pricing) show market expectations for future inflation.
- Labour market data for signs of energy shock impacts. Employment reports, jobless claims, and wage growth indicators reveal whether energy price increases are affecting consumer spending and economic activity.
- Corporate earnings reports for fundamental support signals. Quarterly earnings provide insight into whether companies can maintain profitability despite elevated input costs and economic uncertainty. Strong earnings support equity valuations even during volatile periods.
The Federal Reserve’s March 2026 meeting provides critical context for monetary policy monitoring. With one rate cut projected for the year, down from prior expectations of multiple cuts, the Fed has signalled caution about sticky inflation, geopolitical uncertainty, and energy market volatility. Additionally, leadership transition at the central bank adds an element of policy unpredictability. Investors should track Federal Open Market Committee (FOMC) statements, press conference commentary, and economic projections for signals of policy shifts that could affect portfolio positioning.
The Federal Reserve publishes Federal Open Market Committee statements and economic projections after each policy meeting, including the Summary of Economic Projections that contains interest rate forecasts and inflation targets. These official documents provide the most authoritative view of monetary policy direction.
Building Your Volatility Investment Plan
Current market conditions in April 2026 present a complex but navigable environment for disciplined investors. The Iran conflict and Strait of Hormuz crisis have created real volatility and sector-specific opportunities, yet market signals consistently indicate investors are pricing a manageable, short-duration disruption rather than a catastrophic scenario. Strategic positioning emphasises inflation protection, energy sector exposure, diversification, and disciplined rebalancing over reactive trading.
With oil stabilising around $100 per barrel, the Federal Reserve on hold with one cut projected for 2026, and corporate earnings providing resilience, the foundation exists for Q2 stabilisation and selective opportunity capture across equities, bonds, and international markets. Success in this environment comes from maintaining discipline, ensuring diversification, positioning tactically for inflation, and monitoring meaningful indicators rather than reacting to daily headlines.
Action Summary:
- Review current portfolio for allocation problems, including over-allocation to long-duration growth equities or bonds and under-allocation to inflation protection
- Evaluate energy sector and safe-haven positioning relative to current market conditions
- Establish a monitoring routine focused on Federal Reserve policy, energy markets, inflation readings, and corporate earnings
- Resist reactive decisions driven by geopolitical headlines or short-term market swings
This article is for informational purposes only and should not be considered financial advice. Investors should conduct their own research and consult with financial professionals before making investment decisions.
Frequently Asked Questions
What is market volatility and how does it affect my investments?
Market volatility refers to the degree of price fluctuation in securities over time, meaning larger daily swings in asset values. Elevated volatility creates short-term uncertainty but does not necessarily signal sustained losses or a market crash, and disciplined positioning can mitigate risk and identify opportunities.
How should I position my portfolio during the 2026 Iran conflict and energy crisis?
Investors should consider adding exposure to the energy sector and safe-haven assets like gold, evaluate long-duration bond and growth equity allocations for inflation risk, and ensure portfolios are diversified across asset classes, sectors, and geographies to reduce concentration risk.
What are the biggest mistakes investors make during volatile markets?
The most damaging mistakes include panic selling into volatility, over-allocating to long-duration growth equities vulnerable to inflation, chasing recent performance without considering mean reversion, and ignoring inflation protection despite clear energy-driven risks from events like the Strait of Hormuz blockade.
What key indicators should investors monitor during market volatility in 2026?
Investors should prioritise Federal Reserve policy decisions, energy market data and oil supply developments, Strait of Hormuz shipping updates, CPI and PCE inflation readings, labour market data, and corporate earnings reports as the most meaningful signals for portfolio positioning.
Has the S&P 500 dropped significantly due to the Strait of Hormuz crisis?
Despite the Strait of Hormuz blockade disrupting 20% of global energy supplies and pushing oil prices to around $100 per barrel, the S&P 500 drawdown has remained below 10%, with Treasury yields stable and cross-asset signals indicating markets are pricing the disruption as manageable rather than catastrophic.


