Why Energy Prices Control Inflation in 2026

Key Takeaways
- US headline inflation reached 3.3% year-over-year in March 2026, with energy prices surging 12.5% annually and accounting for nearly three-quarters of that month's total CPI increase.
- The ongoing US-Iran conflict has driven Brent crude oil to approximately $115 per barrel — a 45% year-to-date rise — by stoking fears of supply disruptions through the Strait of Hormuz.
- Energy price inflation transmits through the entire economy via higher transportation, manufacturing, and logistics costs, which is already visible in the Producer Price Index rising 8.5% month-over-month in March 2026.
- The Federal Reserve has pivoted from contemplating rate cuts to a wait-and-see stance, with some officials open to rate hikes, complicating the economic outlook for both businesses and investors.
- Energy sector stocks are outperforming as crude prices remain elevated, while industrial and consumer discretionary sectors face a dual squeeze of rising input costs and weakening consumer demand.
Energy prices have become the dominant force driving inflation in 2026, creating a direct financial burden on households worldwide. In March 2026, US headline inflation surged to 3.3% year-over-year, propelled primarily by energy costs that jumped 12.5% annually. Gasoline prices exceeded $4 per gallon whilst Brent crude oil approached $115 per barrel, levels not seen since the 2022 energy crisis. The connection between what happens in oil markets and what consumers pay at the pump, and increasingly for everything else, has rarely been more visible or more consequential.
This article explains how energy price inflation works, what’s driving current surges, how these increases ripple through the economy, and what this means for households, businesses, and policymakers navigating an uncertain economic landscape.
What Is Energy Price Inflation?
Energy price inflation refers to the rate at which costs for gasoline, natural gas, electricity, and other energy sources increase over time. This is measured within broader inflation indices like the Consumer Price Index (CPI), where energy has its own tracked category. Unlike price changes in most goods, energy affects nearly everything, from transportation and manufacturing to heating and electricity, making it a uniquely powerful inflation driver.
The Bureau of Labor Statistics CPI methodology provides detailed documentation of how energy components are weighted within the broader inflation measurement framework, establishing the authoritative foundation for understanding how energy price changes translate into headline inflation figures.
Economists distinguish between headline inflation, which includes all price changes, and core inflation, which excludes volatile food and energy prices. This separation exists because energy prices can swing dramatically due to external factors such as geopolitical conflicts or supply disruptions rather than domestic economic conditions. In March 2026, headline CPI reached 3.3% whilst core inflation remained at 2.6%, illustrating energy’s outsized impact on overall price pressures.
Economists calculate that the March energy surge added approximately 0.8 percentage points to monthly CPI. This functions like a tax on consumers, representing money that must be spent on energy rather than other goods and services, regardless of income level.
Key components tracked in the energy price index include:
- Gasoline (typically the largest weight due to direct consumer impact)
- Natural gas
- Electricity
- Fuel oil
- Other energy commodities
When big ASX news breaks, our subscribers know first
Current Energy Price Levels: Where Things Stand in April 2026
Energy prices have spiked dramatically in early 2026, with crude oil approaching $115 per barrel and US gasoline exceeding $4 per gallon. These represent the steepest increases in over two decades, driven by specific geopolitical events. Brent crude oil prices have risen approximately 45% from the start of 2026, reaching the highest levels since the 2022 energy crisis.
| Energy Metric | Current Level | Change |
|---|---|---|
| Brent Crude Oil | ~$115/barrel | +45% YTD |
| US Gasoline | >$4/gallon | +21.2% MoM |
| Energy Index (MoM) | March 2026 | +10.9% |
| Energy Index (YoY) | March 2026 | +12.5% |
| Producer Energy Prices | March 2026 | +8.5% MoM |
The 21.2% month-over-month gasoline increase in March accounted for nearly three-quarters of the entire CPI increase that month. April data is not yet available as of mid-April reporting, so these March figures represent the most current official data from the Bureau of Labor Statistics, released on 10 April 2026.
What’s Driving Energy Prices Higher?
The ongoing US-Iran conflict is the primary driver of current energy price inflation, creating supply disruption fears that have pushed crude oil to elevated levels. This conflict, which escalated around March 2026, has created persistent concerns about oil supply stability in global markets. The market prices not just current supply conditions but anticipated risks, and Middle East tensions historically trigger significant risk premiums in oil markets.
The US-Iran conflict driving unprecedented energy supply concerns has created the most significant energy security challenge since the 1970s oil shocks, with implications extending far beyond immediate price volatility to fundamental questions about global supply chain resilience.
The Strait of Hormuz, a narrow waterway through which approximately 20% of global oil supply flows, has been a central market concern. Fears about potential blockage or disruption have contributed to price pressures. Whilst progress toward reopening has been reported, conditions remain uncertain with no rapid resolution in sight and no ceasefire progress reported through 14 April 2026.
Key supply-side factors driving prices include:
- Geopolitical conflict and supply disruption fears
- Strait of Hormuz transit risks affecting global oil flows
- Market risk premiums on Middle East instability
- Slow-moving ceasefire negotiations offering only partial relief
- Ongoing uncertainty about conflict duration
Adding complexity to the picture, the International Energy Agency forecasts the first annual oil demand decline since the pandemic, announced approximately 14 April 2026. This apparent contradiction, high prices despite expected demand decline, reflects supply fear premiums and potential demand destruction where high prices reduce consumption. The market is pricing both supply risks and economic slowdown concerns simultaneously.
The International Energy Agency’s oil demand projections provide comprehensive analysis of global consumption trends, offering critical context for understanding why prices remain elevated despite forecasts of declining demand through 2026.
How Energy Prices Transmit Through the Economy
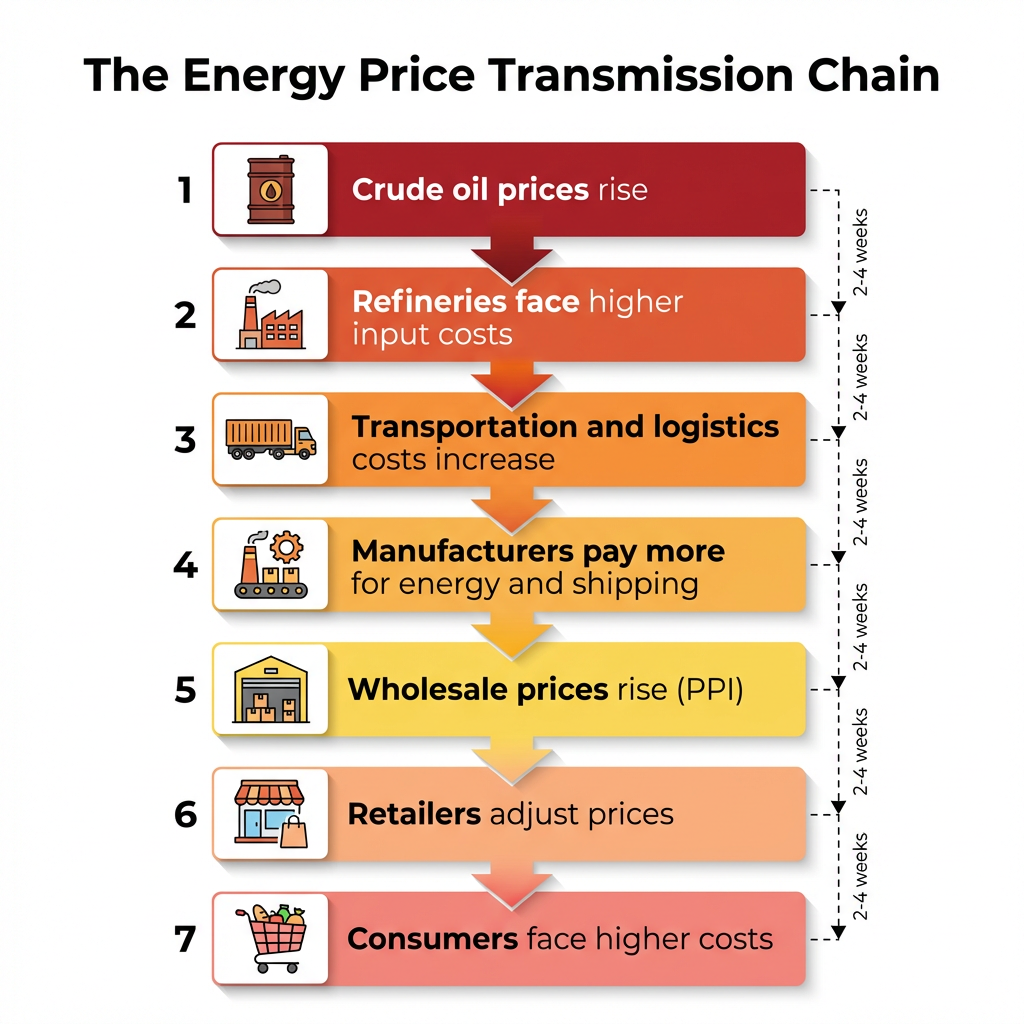
Energy price increases ripple through the economy via multiple channels: direct consumer costs, transportation and logistics expenses, manufacturing input costs, and eventually retail prices for goods and services. Consumers pay more at petrol stations and for utilities, but the indirect effects are equally significant. Higher transportation costs raise prices for shipped goods, higher energy costs increase manufacturing expenses, and these upstream pressures eventually flow to consumer prices.
The Producer Price Index provides evidence of this transmission mechanism in action. In March 2026, PPI rose 0.5% month-over-month and 4.0% year-over-year, with the energy component surging 8.5% in a single month. PPI measures wholesale or producer-level prices, representing what businesses pay. When these rise, businesses eventually pass costs to consumers, creating a lag between oil market spikes and supermarket price increases.
The transmission chain follows this sequential progression:
- Crude oil prices rise
- Refineries face higher input costs
- Transportation and logistics costs increase
- Manufacturers pay more for energy and shipping
- Wholesale prices rise (reflected in PPI)
- Retailers adjust prices to maintain margins
- Consumers face higher costs across categories
This transmission explains why core inflation, whilst lower than headline, also ticked up slightly from 2.5% to 2.6% year-over-year in March. Even excluding direct energy costs, the indirect effects seep into other categories. Energy-intensive industries face particular pressure, whilst less energy-dependent services are more insulated from immediate impacts.
Impact on Households and Businesses
Families face the highest utility and gasoline bills since the 2022 energy crisis. With gasoline exceeding $4 per gallon and overall headline inflation at 3.3%, purchasing power is eroding. The energy tax concept means households must allocate more of their budgets to non-negotiable energy costs, leaving less for discretionary spending.
As energy consumes a larger budget share, consumers pull back on non-essential purchases. This creates a dual impact: direct financial pressure from energy costs plus reduced spending in other economic sectors. Lower-income households face the sharpest burden since energy represents a larger proportion of their total spending.
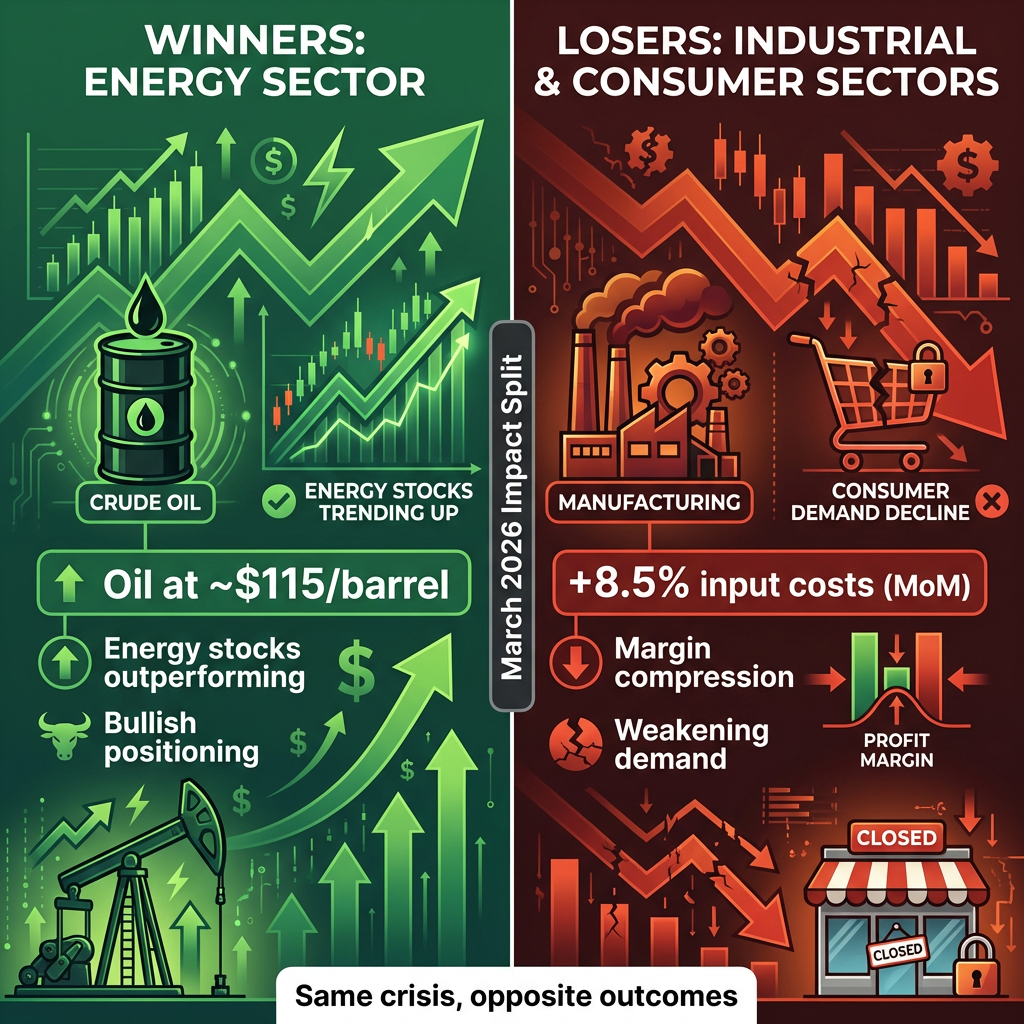
Sectoral Impact Comparison:
Energy Sector: Companies in the energy sector benefit from elevated crude prices near $115 per barrel, with energy stocks outperforming broader market indices. The sector is positioned bullishly amid high price environments.
Industrial and Consumer Sectors: Industrial and consumer-facing businesses face the opposite dynamic. Rising input costs, reflected in the 8.5% month-over-month producer energy price increase, compress margins. Simultaneously, weakening consumer demand limits pricing power, creating a squeeze on profitability.
The combination of reduced consumer spending and pressured business margins cools overall economic activity. Analysis from Wedbush describes this as halting previous soft landing narratives, identifying a renewed inflationary environment that creates clear sectoral winners in energy and losers in industrials and consumer discretionary categories.
Understanding how technology spending supporting equity valuations despite sectoral headwinds explains why market indices can reach new highs even as energy-intensive industries face margin compression and consumer discretionary sectors struggle with weakened demand.
The next major ASX story will hit our subscribers first
Policy Responses and Economic Outlook
The Federal Reserve faces a complex dilemma as energy’s outsized role in inflation complicates the planned trajectory toward rate cuts. March FOMC minutes indicate the Fed has shifted to wait-and-see mode, with some officials open to rate hikes if inflationary pressures persist. The central bank must balance inflation concerns against a still-functioning labour market that added 178,000 jobs in March.
> Policy Shift
> Economists note the Fed’s focus has shifted from contemplating rate cuts to managing rising cost concerns. This represents a significant policy pivot driven specifically by energy price dynamics, as the core inflation story of 2.6% year-over-year would support different policy than headline inflation of 3.3%.
Broadening to global implications, the International Monetary Fund has warned that continued conditions could reduce global growth to pandemic-era levels. Financial markets have shown resilience, with the S&P 500 recovering and reaching new highs, but risks remain if oil spikes further or central banks respond too aggressively to inflation fears. The rate of change in prices matters more than absolute levels for policy responses.
The apparent market resilience despite energy shocks has surprised many analysts, with equity indices compartmentalizing inflation concerns from broader performance trends, though this disconnect may not persist if oil prices continue their upward trajectory.
The outlook depends heavily on geopolitical developments, whether the Iran conflict moves toward resolution or escalation. Ceasefire negotiations, whilst fragile, have provided some market reassurance, but no rapid resolution is expected. Persistent upside inflation risks remain as long as Middle East tensions continue.
Looking Ahead: What to Watch
Energy price inflation in 2026 stems from a specific geopolitical shock with real and measurable economic consequences. The ongoing US-Iran conflict has driven crude oil prices to elevated levels, which then transmit through the economy via multiple channels, creating divergent impacts on households (financial burden), businesses (sectoral splits), and policymakers (complicated choices). This isn’t abstract theory, it’s visible in petrol prices, utility bills, and grocery costs.
Key indicators to monitor include:
- Crude oil price movements (currently approximately $115 per barrel for Brent)
- Progress on Middle East ceasefire negotiations
- Federal Reserve communications and rate decisions
- Monthly CPI releases (next data will show April figures)
- Strait of Hormuz transit status
Whilst the situation remains uncertain, understanding the mechanisms behind energy price inflation helps readers make informed decisions about their own finances and interpret economic news. The story is still developing, but the fundamentals of how energy prices drive inflation remain constant regardless of which direction prices move next.
This article is for informational purposes only and should not be considered financial advice. Investors should conduct their own research and consult with financial professionals before making investment decisions.
Frequently Asked Questions
What is energy price inflation and how is it measured?
Energy price inflation refers to the rate at which costs for gasoline, natural gas, electricity, and other energy sources rise over time, tracked within broader indices like the Consumer Price Index (CPI) where energy has its own weighted category.
Why are energy prices so high in 2026?
The primary driver is the ongoing US-Iran conflict, which escalated around March 2026 and created fears of supply disruptions through the Strait of Hormuz, a waterway carrying roughly 20% of global oil supply, pushing Brent crude up approximately 45% year-to-date to near $115 per barrel.
How does rising oil price inflation affect everyday consumers?
Higher energy prices act like a tax on households, forcing more budget towards non-negotiable costs like gasoline and utilities — with US gasoline exceeding $4 per gallon in March 2026, lower-income households face the sharpest burden as energy represents a larger share of their total spending.
What is the difference between headline inflation and core inflation?
Headline inflation includes all price changes including volatile food and energy costs, while core inflation excludes these categories — in March 2026, headline CPI was 3.3% versus core inflation of 2.6%, illustrating how energy prices were adding approximately 0.8 percentage points to overall inflation.
How is the Federal Reserve responding to energy-driven inflation in 2026?
The Fed has shifted to a wait-and-see mode, with March FOMC minutes showing some officials are open to rate hikes if inflationary pressures persist, representing a significant pivot away from the previously anticipated rate-cut trajectory.


