
Most investors have felt it. Some days the market moves like everyone is sprinting for the same exit at once, and other days capital pours into the riskiest corners of the globe as if fear had never existed.
What you are watching is not chaos or coincidence. It is a structured shift in how global capital gets allocated, a pattern professionals call the risk-on/risk-off cycle, and it moves currencies, bonds, commodities, and equities together in ways that become readable once you know the logic.
This is why the Japanese yen surges on days when US equities collapse, why gold can climb while copper falls, and why the Australian dollar often tracks global growth expectations more closely than anything happening inside Australia. None of these are accidents. They are the same underlying force expressed across different asset classes at the same moment.
Here is what you get from the next few sections: a working map of how capital actually moves under stress and under optimism, so that the next time sentiment turns, you can read the signals instead of being caught off guard by them.
What risk-on and risk-off actually mean for capital flows
The framework rests on two regimes, and both are simpler than they sound.
In a risk-on environment, investor optimism pushes capital toward higher-yielding, higher-volatility assets. Equities rally, industrial and agricultural commodities firm up, cryptocurrencies attract inflows, and the currencies of commodity-exporting economies strengthen.
In a risk-off environment, fear, geopolitical uncertainty, or economic instability sends capital rotating the other way, into defensive positions. Major government bonds get bid, gold catches a flight-to-safety bid, and a small group of safe-haven currencies absorb the demand.
The important thing to hold onto is that this is not a switch that flips between two settings. It is a spectrum of sentiment that shifts in degrees, sometimes over weeks, sometimes within a single trading session. The 5 August 2024 global equity selloff, driven largely by a rapid unwinding of leveraged positions rather than fresh economic data, showed how violently a regime can transition in hours.
The currencies sort into two clear camps:
- Commodity-linked (risk-on beneficiaries): Australian Dollar (AUD), Canadian Dollar (CAD), New Zealand Dollar (NZD), South African Rand (ZAR), Russian Ruble (RUB).
- Safe-haven (risk-off beneficiaries): US Dollar (USD), Japanese Yen (JPY), Swiss Franc (CHF).
Here is the full pattern at a glance before we get into why it works.
| Asset class | Risk-on behaviour | Risk-off behaviour |
|---|---|---|
| Equities | Strong inflows, prices rise | Outflows, prices fall |
| Government bonds | Sold in favour of riskier assets | Bought as flight-to-quality |
| Commodity-linked currencies | Strengthen | Weaken |
| Safe-haven currencies | Weaken or drift | Strengthen |
| Gold | Often lags | Frequently rallies |
| Industrial commodities | Rise on growth demand | Fall on demand fears |
What this two-column structure really tells you is that every asset sits somewhere on a single risk spectrum. Once you know where an asset sits, you know which direction it is likely to move when sentiment turns, and correlated moves stop looking like noise and start looking like signals.
When big ASX news breaks, our subscribers know first
Why the yen, franc, and dollar become magnets during market stress
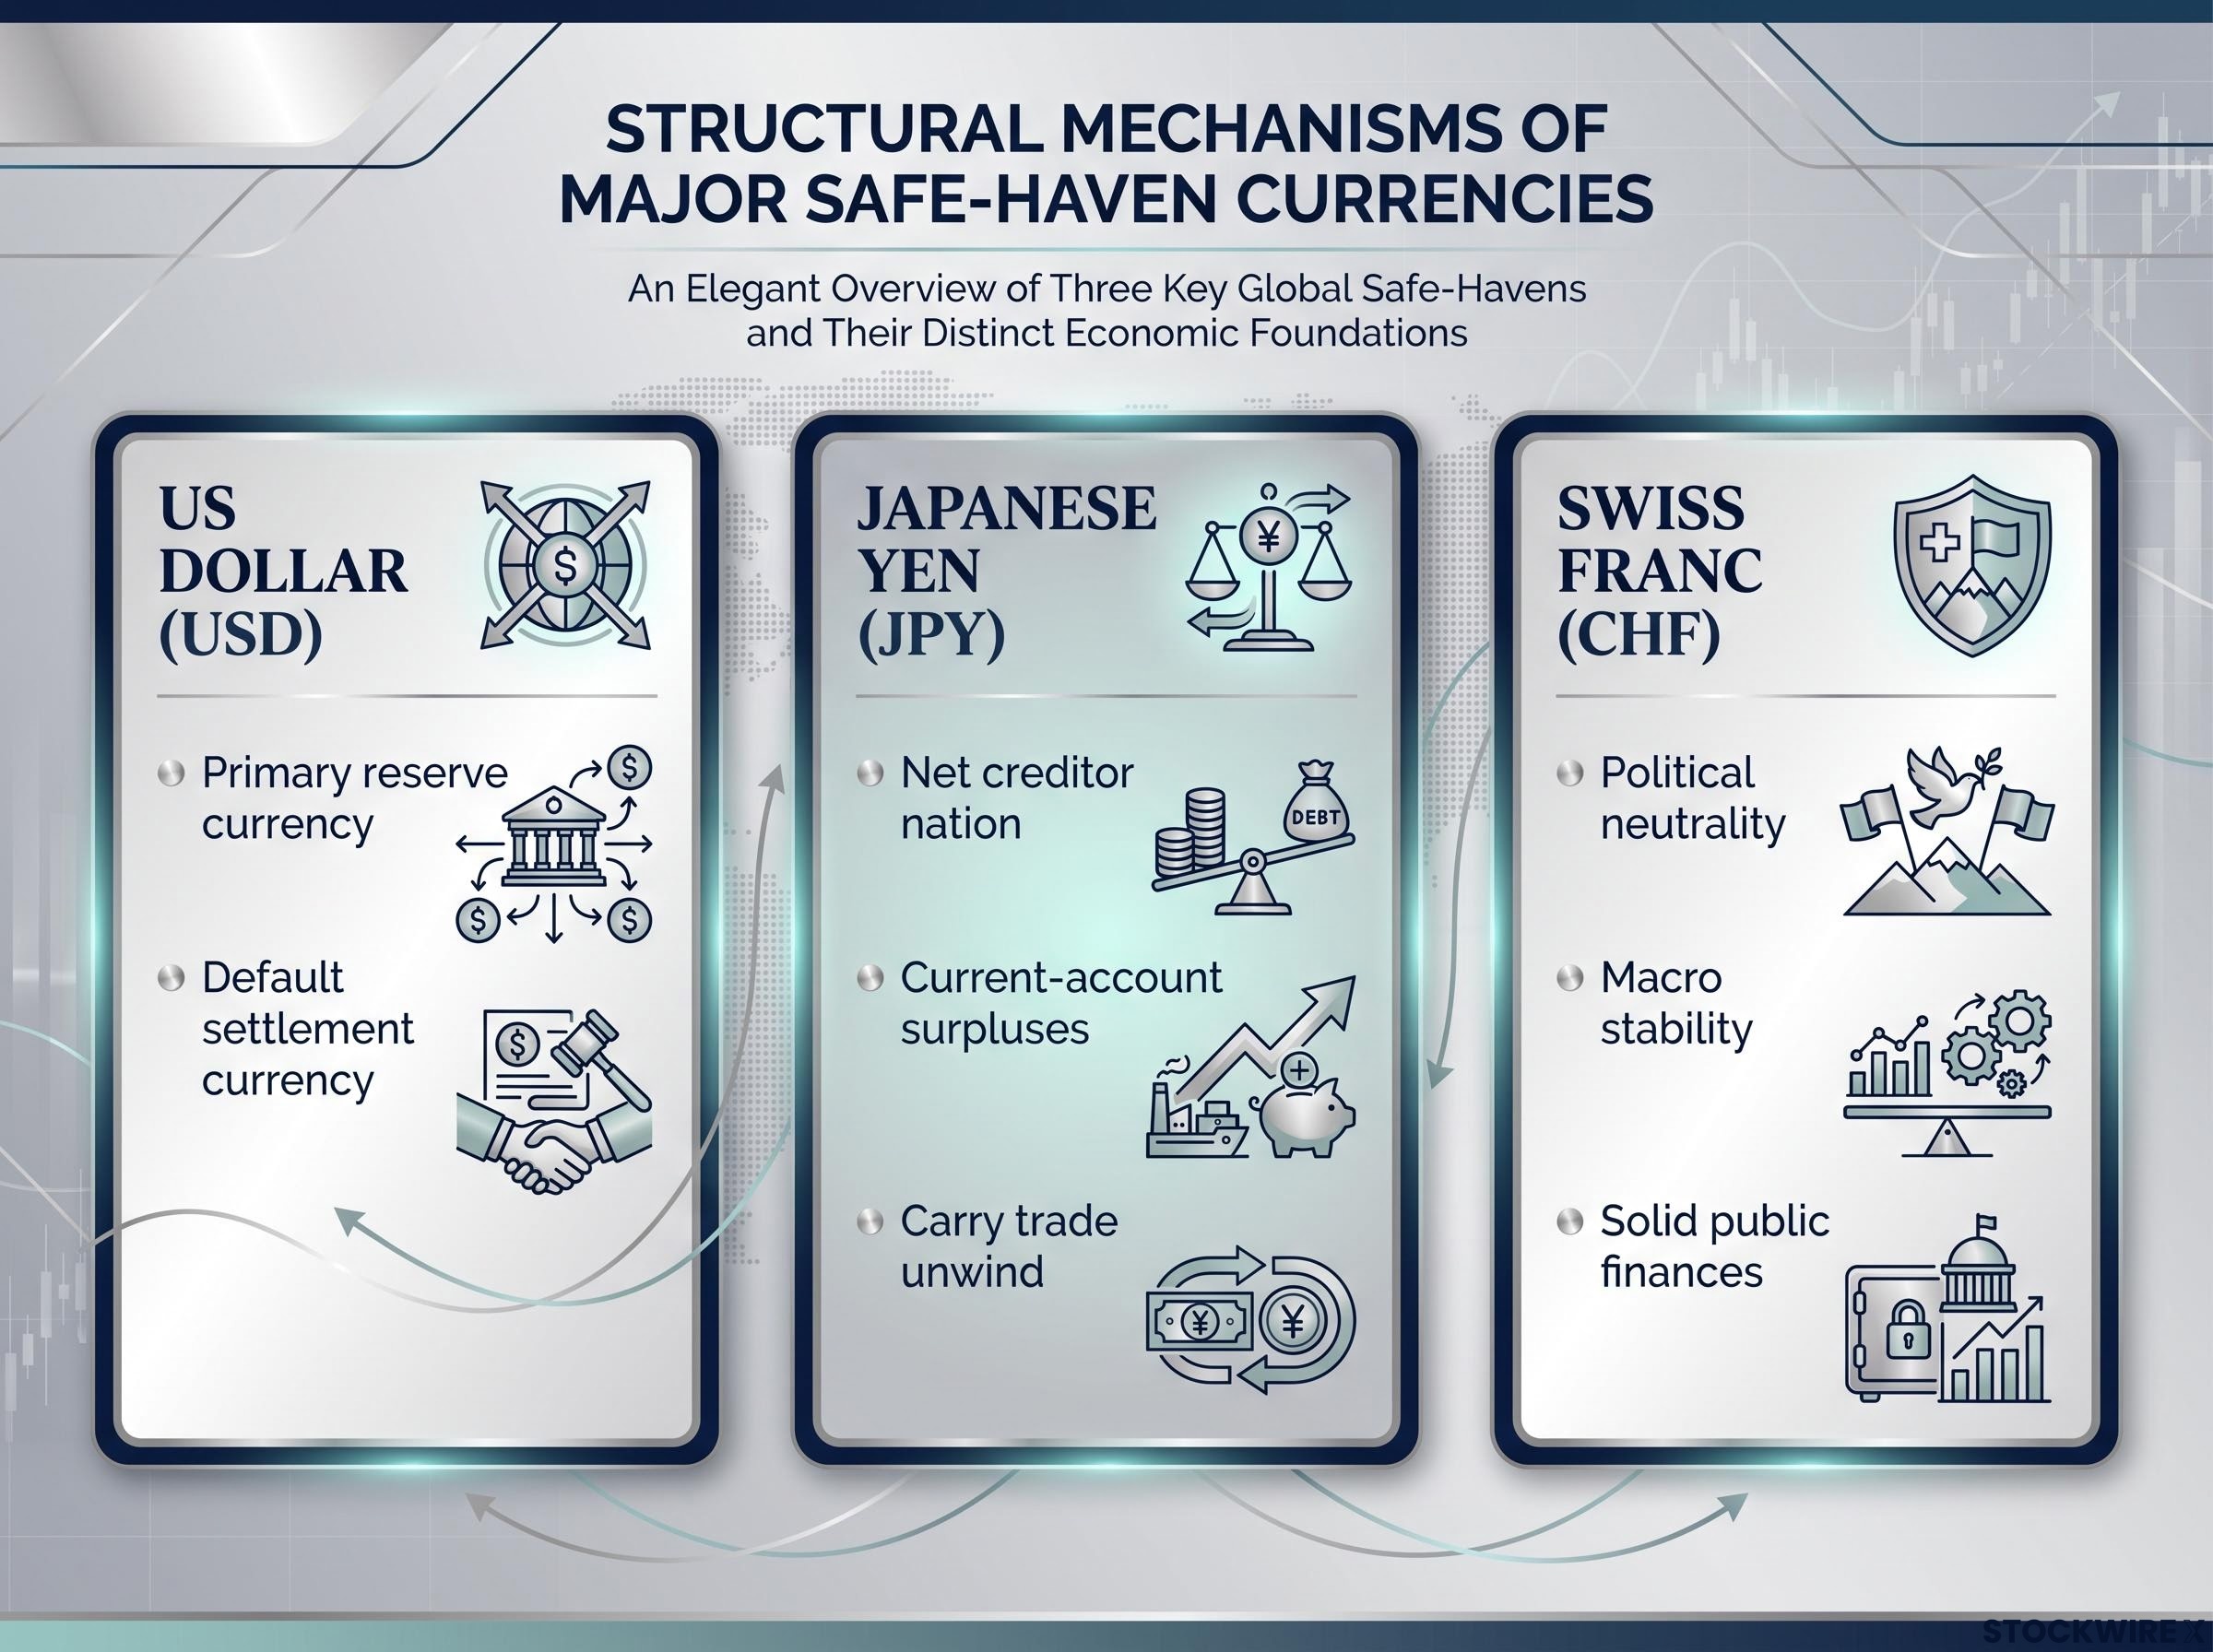
The surface observation is easy to make: these three currencies tend to rise when equity markets fall. What is less obvious is that each earns its safe-haven status through a completely different structural mechanism. Understanding those mechanisms is what lets you read a currency move correctly rather than guessing at its cause.
The US Dollar
The dollar’s role is the most straightforward of the three. As the world’s primary reserve currency, it functions as the default settlement currency for international trade and debt.
When stress hits, global demand for dollar-denominated assets rises, because so many obligations and transactions across the world are priced in dollars in the first place. Investors do not have to believe anything specific about the US economy to reach for the dollar in a panic; they simply need liquidity in the currency everything else is measured against.
The Japanese Yen
The yen’s safe-haven behaviour rests on Japan’s position as a persistent net creditor nation, backed by decades of current-account surpluses. When global risk sentiment sours, Japanese investors frequently sell overseas holdings and bring the proceeds home, generating automatic demand for the yen.
The more powerful driver, though, is the carry trade. In calm periods, investors borrow cheaply in yen and use the proceeds to buy higher-yielding assets around the world. That works beautifully until volatility spikes.
The yen safe-haven mechanics described here operate across three distinct time horizons, with carry-trade positioning governing short-term surges while Japan’s net creditor position and current account surplus shape the longer-term structural floor beneath the currency.
The carry-trade unwind mechanic When markets turn, those leveraged positions are closed in a hurry. Investors must sell the higher-yielding assets and buy back yen to repay what they borrowed, mechanically forcing the yen higher within days, regardless of what Japanese interest rates are doing.
The 5 August 2024 selloff was a live demonstration. As carry trades were slammed shut across the market, the yen surged to a seven-month high, not because of any positive news out of Japan, but because of the sheer scale of positions being unwound at once.
The Swiss Franc
The franc draws safe-haven demand from Switzerland’s political neutrality, macro stability, and solid public finances relative to the broader euro area. Persistent global uncertainty tends to keep a floor of demand under the currency.
It also shares the yen’s funding-currency dynamic. The franc is popular in leveraged strategies, so when risk-off conditions force investors to cover franc-short positions, the resulting short squeeze pushes the franc higher even without any domestic catalyst.
Here is the practical read for you. A yen or franc surge during a selloff is rarely a signal about Japan or Switzerland at all. It is a signal about how large the leveraged positions were that just got closed, which is really a measure of how much fear entered the market. Mistake it for a Japan-specific event and you misread the whole picture.
Gold, copper, and oil: why commodities do not all behave the same way
Here is where a lot of retail investors get tripped up. The word “commodity” covers assets that can move in opposite directions during the same crisis, and gold is the reason why.
Gold is best understood as a monetary and reserve asset. Its price reflects institutional confidence, central bank behaviour, and macro fear far more than any physical consumption demand. When investors doubt the institutions charged with controlling inflation, they reach for gold.
Copper and oil are the opposite. They are industrial inputs, tied directly to production needs, supply-chain conditions, and the operational demands of the global economy. They thrive when growth is strong, which means they are risk-on beneficiaries, not risk-off hedges.
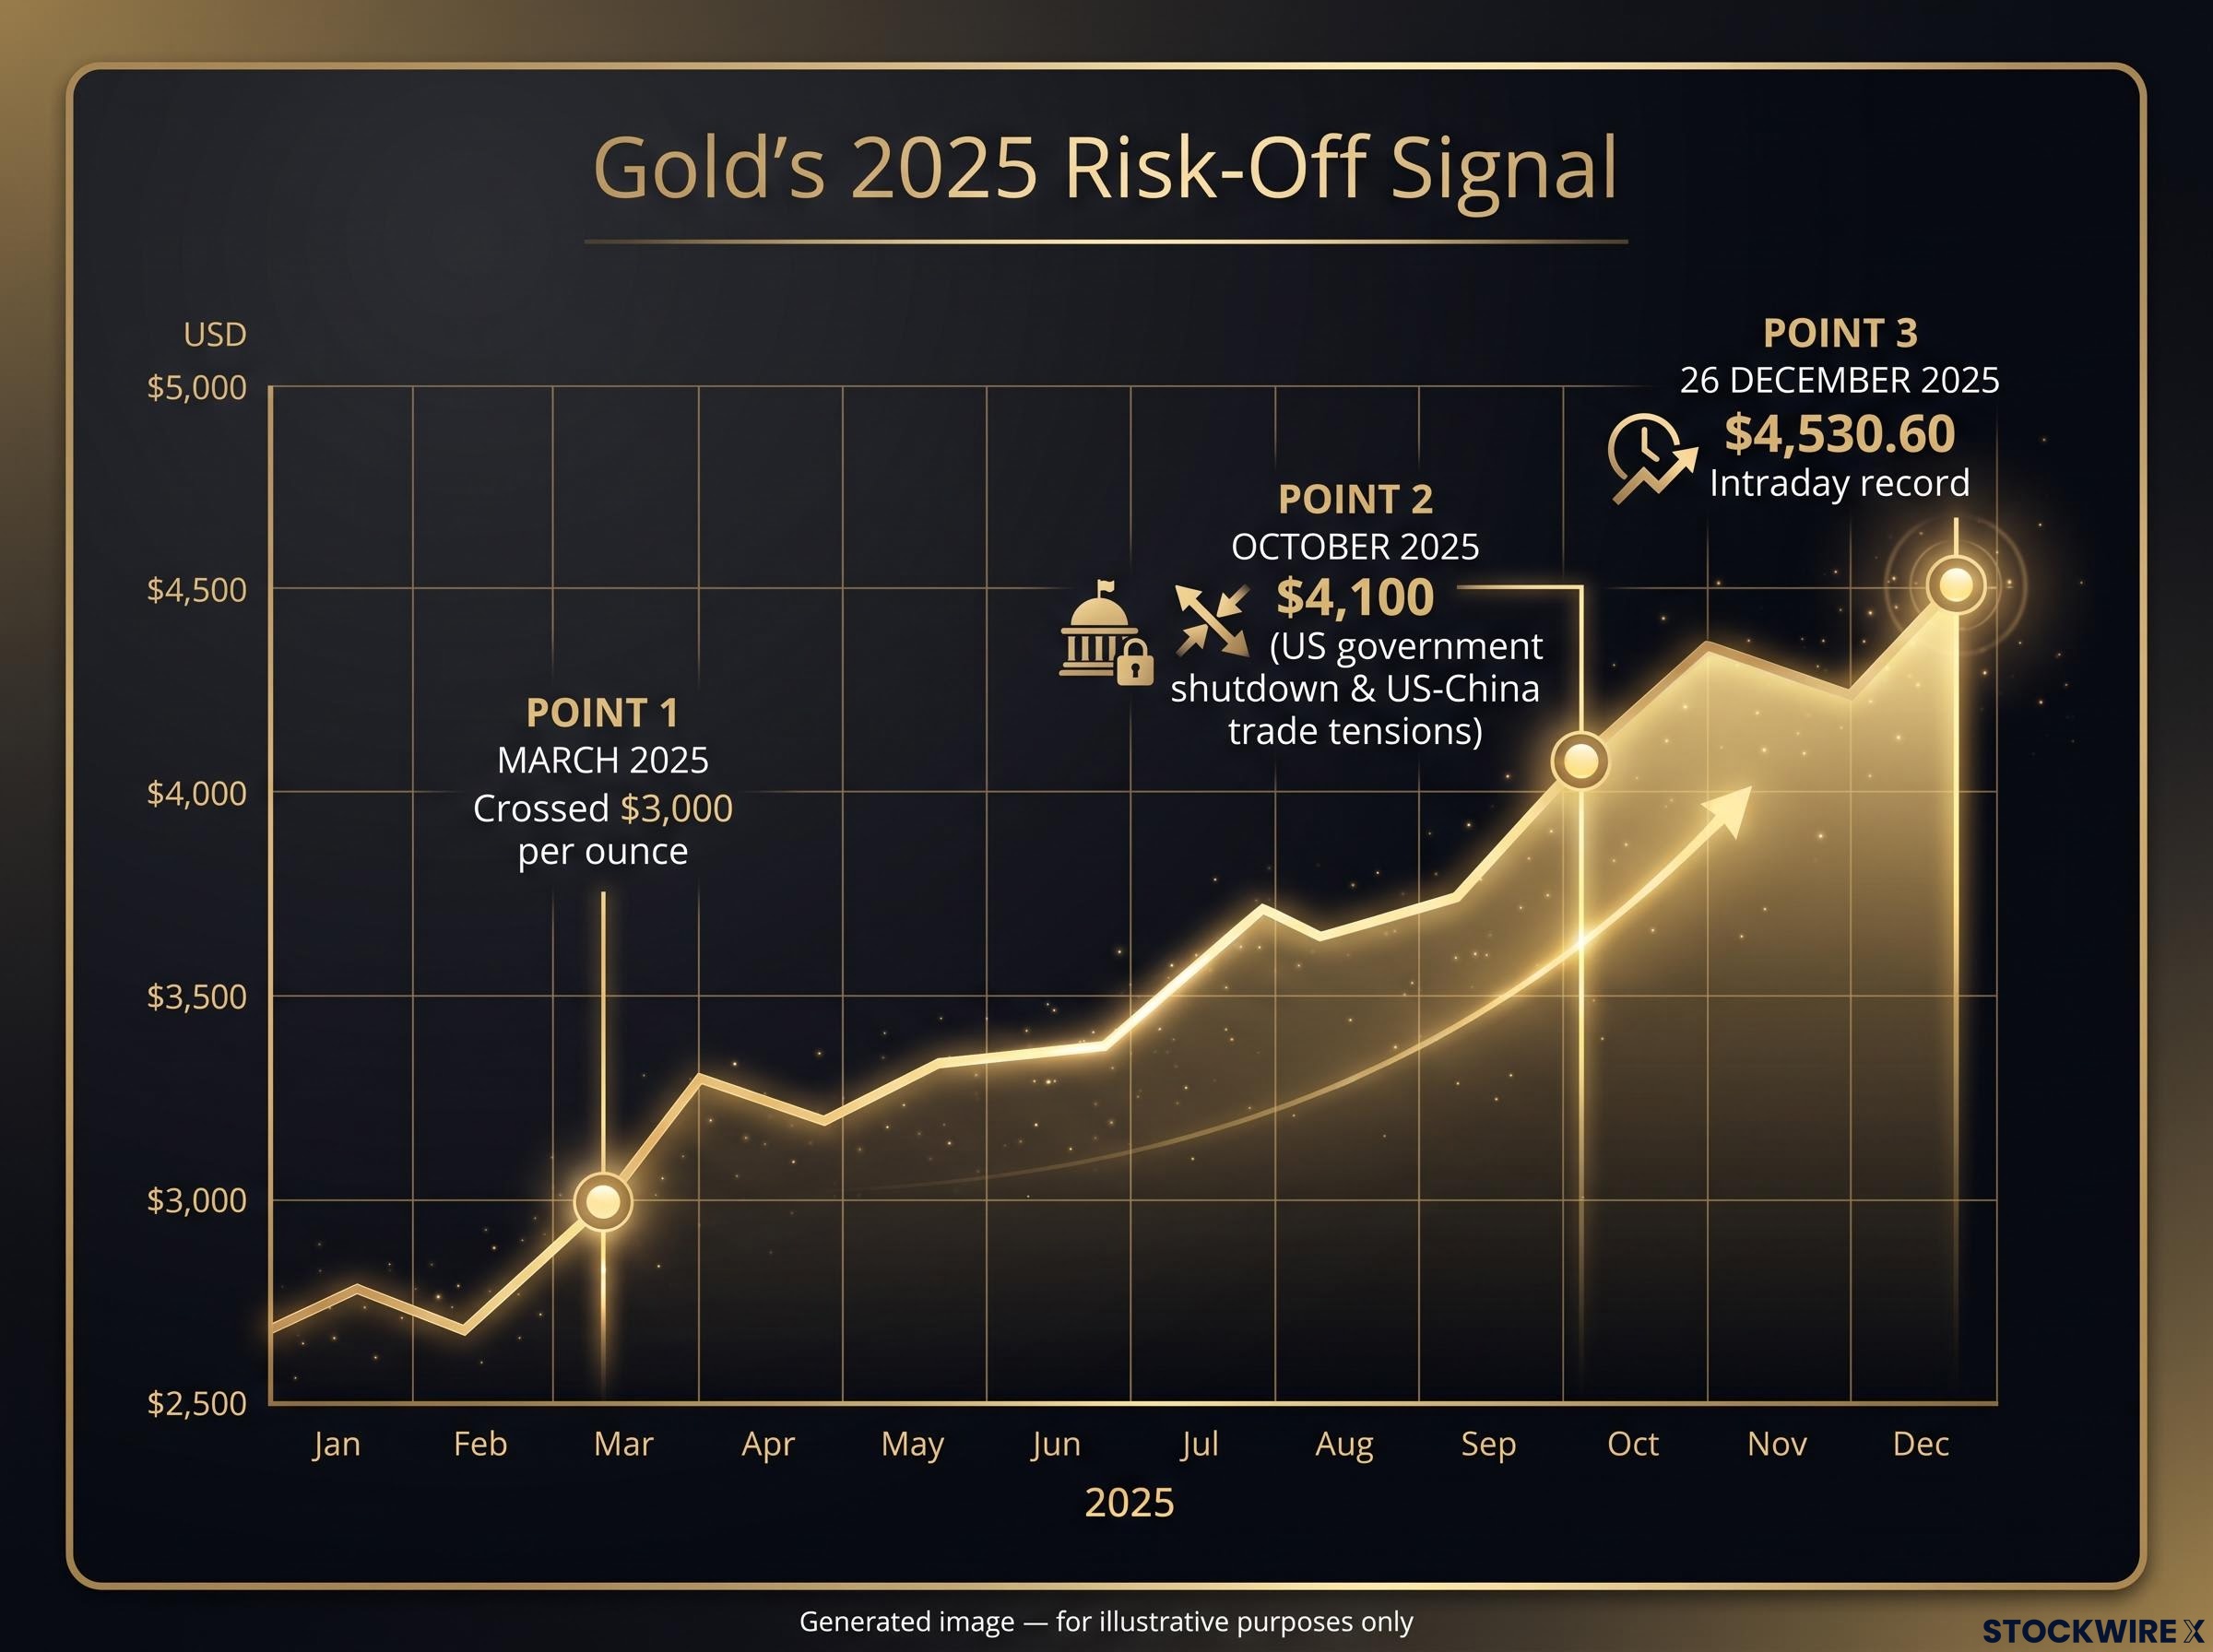
Gold spent much of 2025 acting as a sustained risk-off signal rather than a single-session panic trade. It crossed $3,000 per ounce for the first time in March 2025, climbed to $4,100 in October 2025 amid a US government shutdown and renewed US-China trade tensions, and reached an intraday record of $4,530.60 on 26 December 2025. These figures are drawn from unverified research and are best treated as illustrative rather than confirmed, but the direction of travel makes the point: risk-off episodes can run for months.
| Commodity | Primary price driver | Risk regime beneficiary | Volatility in geopolitical stress |
|---|---|---|---|
| Gold | Monetary conditions, central bank confidence | Risk-off | Relatively stable |
| Copper | Industrial and construction demand | Risk-on | Elevated with growth fears |
| Oil | Energy demand, supply conditions | Risk-on | Sharply higher |
There is one more wrinkle worth knowing. Gold does not rally uniformly during every risk-off event. Its behaviour depends on why the shock is happening, and in particular whether oil is falling due to demand destruction rather than a supply disruption.
The hedge distinction During acute geopolitical stress, gold’s volatility has historically stayed relatively contained while crude oil volatility surges. That makes oil an amplifier of geopolitical risk, not a shelter from it. Gold hedges against the failure of monetary institutions; oil hedges energy-price inflation directly at the source.
For you, this means reaching for oil as a geopolitical hedge is a fundamentally different bet from reaching for gold. One captures the inflation that a disruption produces; the other reflects doubt about the institutions managing that inflation. Treat both as a single “commodity” trade and you will systematically misread what the market is telling you.
For readers wanting to understand why gold’s behaviour can confound even well-constructed risk-off theses, our dedicated guide to gold price prediction examines the documented cases where all theoretically gold-positive conditions were present simultaneously yet prices fell.
When the rules break down: the limits of the risk-on/risk-off framework
The framework is powerful, but it is a starting map, not a fixed rulebook. The exceptions are not evidence that the model fails. They are what turn a blunt signal into a nuanced analytical lens, and knowing them is what separates a sophisticated user from a naive one.
The first thing to understand is that safe-haven hierarchies are time-varying. Research indicates the primary safe haven has moved over the years: the US dollar held that role before the global financial crisis, the Swiss franc took over post-crisis, and the Japanese yen emerged as the primary haven during episodes like US-China trade friction and the COVID-19 pandemic. No currency owns the safe-haven crown permanently.
The dollar itself can invert the standard rule. When a selloff is driven by deep US recession fears or a loss of confidence in US institutions, investors may exit US equities and the US dollar at the same time, weakening the dollar in the middle of a broad risk-off move, precisely the opposite of what the textbook pattern predicts.
The RBA analysis of US dollar safe-haven reliability notes that market participants have responded to episodes where the dollar failed to play its usual defensive role by diversifying official reserves away from US dollar assets, a structural shift that reinforces why safe-haven hierarchies should be treated as dynamic rather than permanent.
The yen is a live example of a haven whose behaviour is evolving. As the Bank of Japan began raising rates and the interest-rate gap with the US narrowed, the yen started showing weakness and volatility during some stress events rather than its expected appreciation. The USD depreciated roughly 10.7% against the yen during Q3 2024 amid weak US data, a moment when the carry-unwind dynamic dominated, yet by late 2025 financial commentary was already noting that the yen’s traditional haven behaviour was becoming less reliable.
The documented breakdown scenarios come down to three:
- US-centric shocks inverting the dollar: when the crisis originates in the US, the dollar can fall alongside US equities.
- Time-varying safe-haven hierarchy: the currency that leads flight-to-safety shifts from era to era.
- Policy-driven yen unreliability: narrowing rate differentials can turn the yen from a haven into a source of whipsaw.
What this means in practice
The practical takeaway is that risk-on/risk-off works best as a framework for reading the direction of pressure, not as a mechanical trading rule. The patterns are real, but they require you to assess which type of shock is driving sentiment before you position around them.
Because funding-currency unwinds are rapid, crowded, and highly sensitive to central bank policy, treating any single currency as a permanent risk-off trade exposes you to significant whipsaw. Use the framework as a directional lens. Identify the type of shock first, then read the currencies through it.
For investors exploring whether the yen’s structural safe-haven role is being reinforced or eroded by current Bank of Japan policy, our full explainer on the yen outlook covers the coordinated intervention mechanics, GPIF pension repatriation flows, and the sharply divided institutional forecasts shaping USD/JPY direction through end-2026.
Reading the map, not memorising the route
The real value of this framework is not that it predicts tomorrow’s price with precision. It is that it explains why correlated moves happen across asset classes at all, which is exactly the thing most retail participants never see because they watch each asset in isolation.
You now have a map across three domains. Currencies split into commodity-linked names that track global growth and safe-haven names that absorb fear. Commodities split into gold as a monetary asset and industrials as growth proxies. Bonds offer the most consistent single signal of all, with flight-to-quality buying reliably marking risk-off conditions.
The habit worth building is watching cross-asset moves together rather than fixating on one indicator. The August 2024 carry-trade unwind is the cleanest recent illustration of multiple signals firing at once: a yen surge, an equity selloff, and a gold bid, all in the same window. The 2025 gold run is a reminder that risk-off episodes can stretch across months, not just single-session panics.
Cross-asset divergence signals become most readable when Treasury yields are the connective variable: a rising 10-year yield simultaneously compresses high-multiple growth equities through discount-rate mechanics while gold’s strength signals that inflation and geopolitical hedging demand is overriding the standard opportunity-cost headwind.
Watch for these three observational checkpoints, and treat them as confirmation, not as trade triggers:
- Yen appreciation plus equity declines: a carry unwind is likely in progress.
- Gold bid plus falling Treasury yields: a flight to safety is confirmed.
- Commodity-linked currency weakness plus falling industrial commodity prices: growth expectations are repricing lower.
The edge is in the correlation. When the yen, gold, and Treasuries all move at once, you are seeing a genuine regime shift rather than a one-asset anomaly, and that is far more informative than reacting to any single move on its own.
This article is for informational purposes only and should not be considered financial advice. Investors should conduct their own research and consult with financial professionals before making investment decisions. Past performance does not guarantee future results, and several figures referenced here are drawn from unverified research and should be treated as illustrative rather than confirmed.