For decades, the story of oil prices came down to two things: what happened in the Middle East and what OPEC decided to do about it. That framework is now missing the two actors doing the most to shape where crude actually trades.
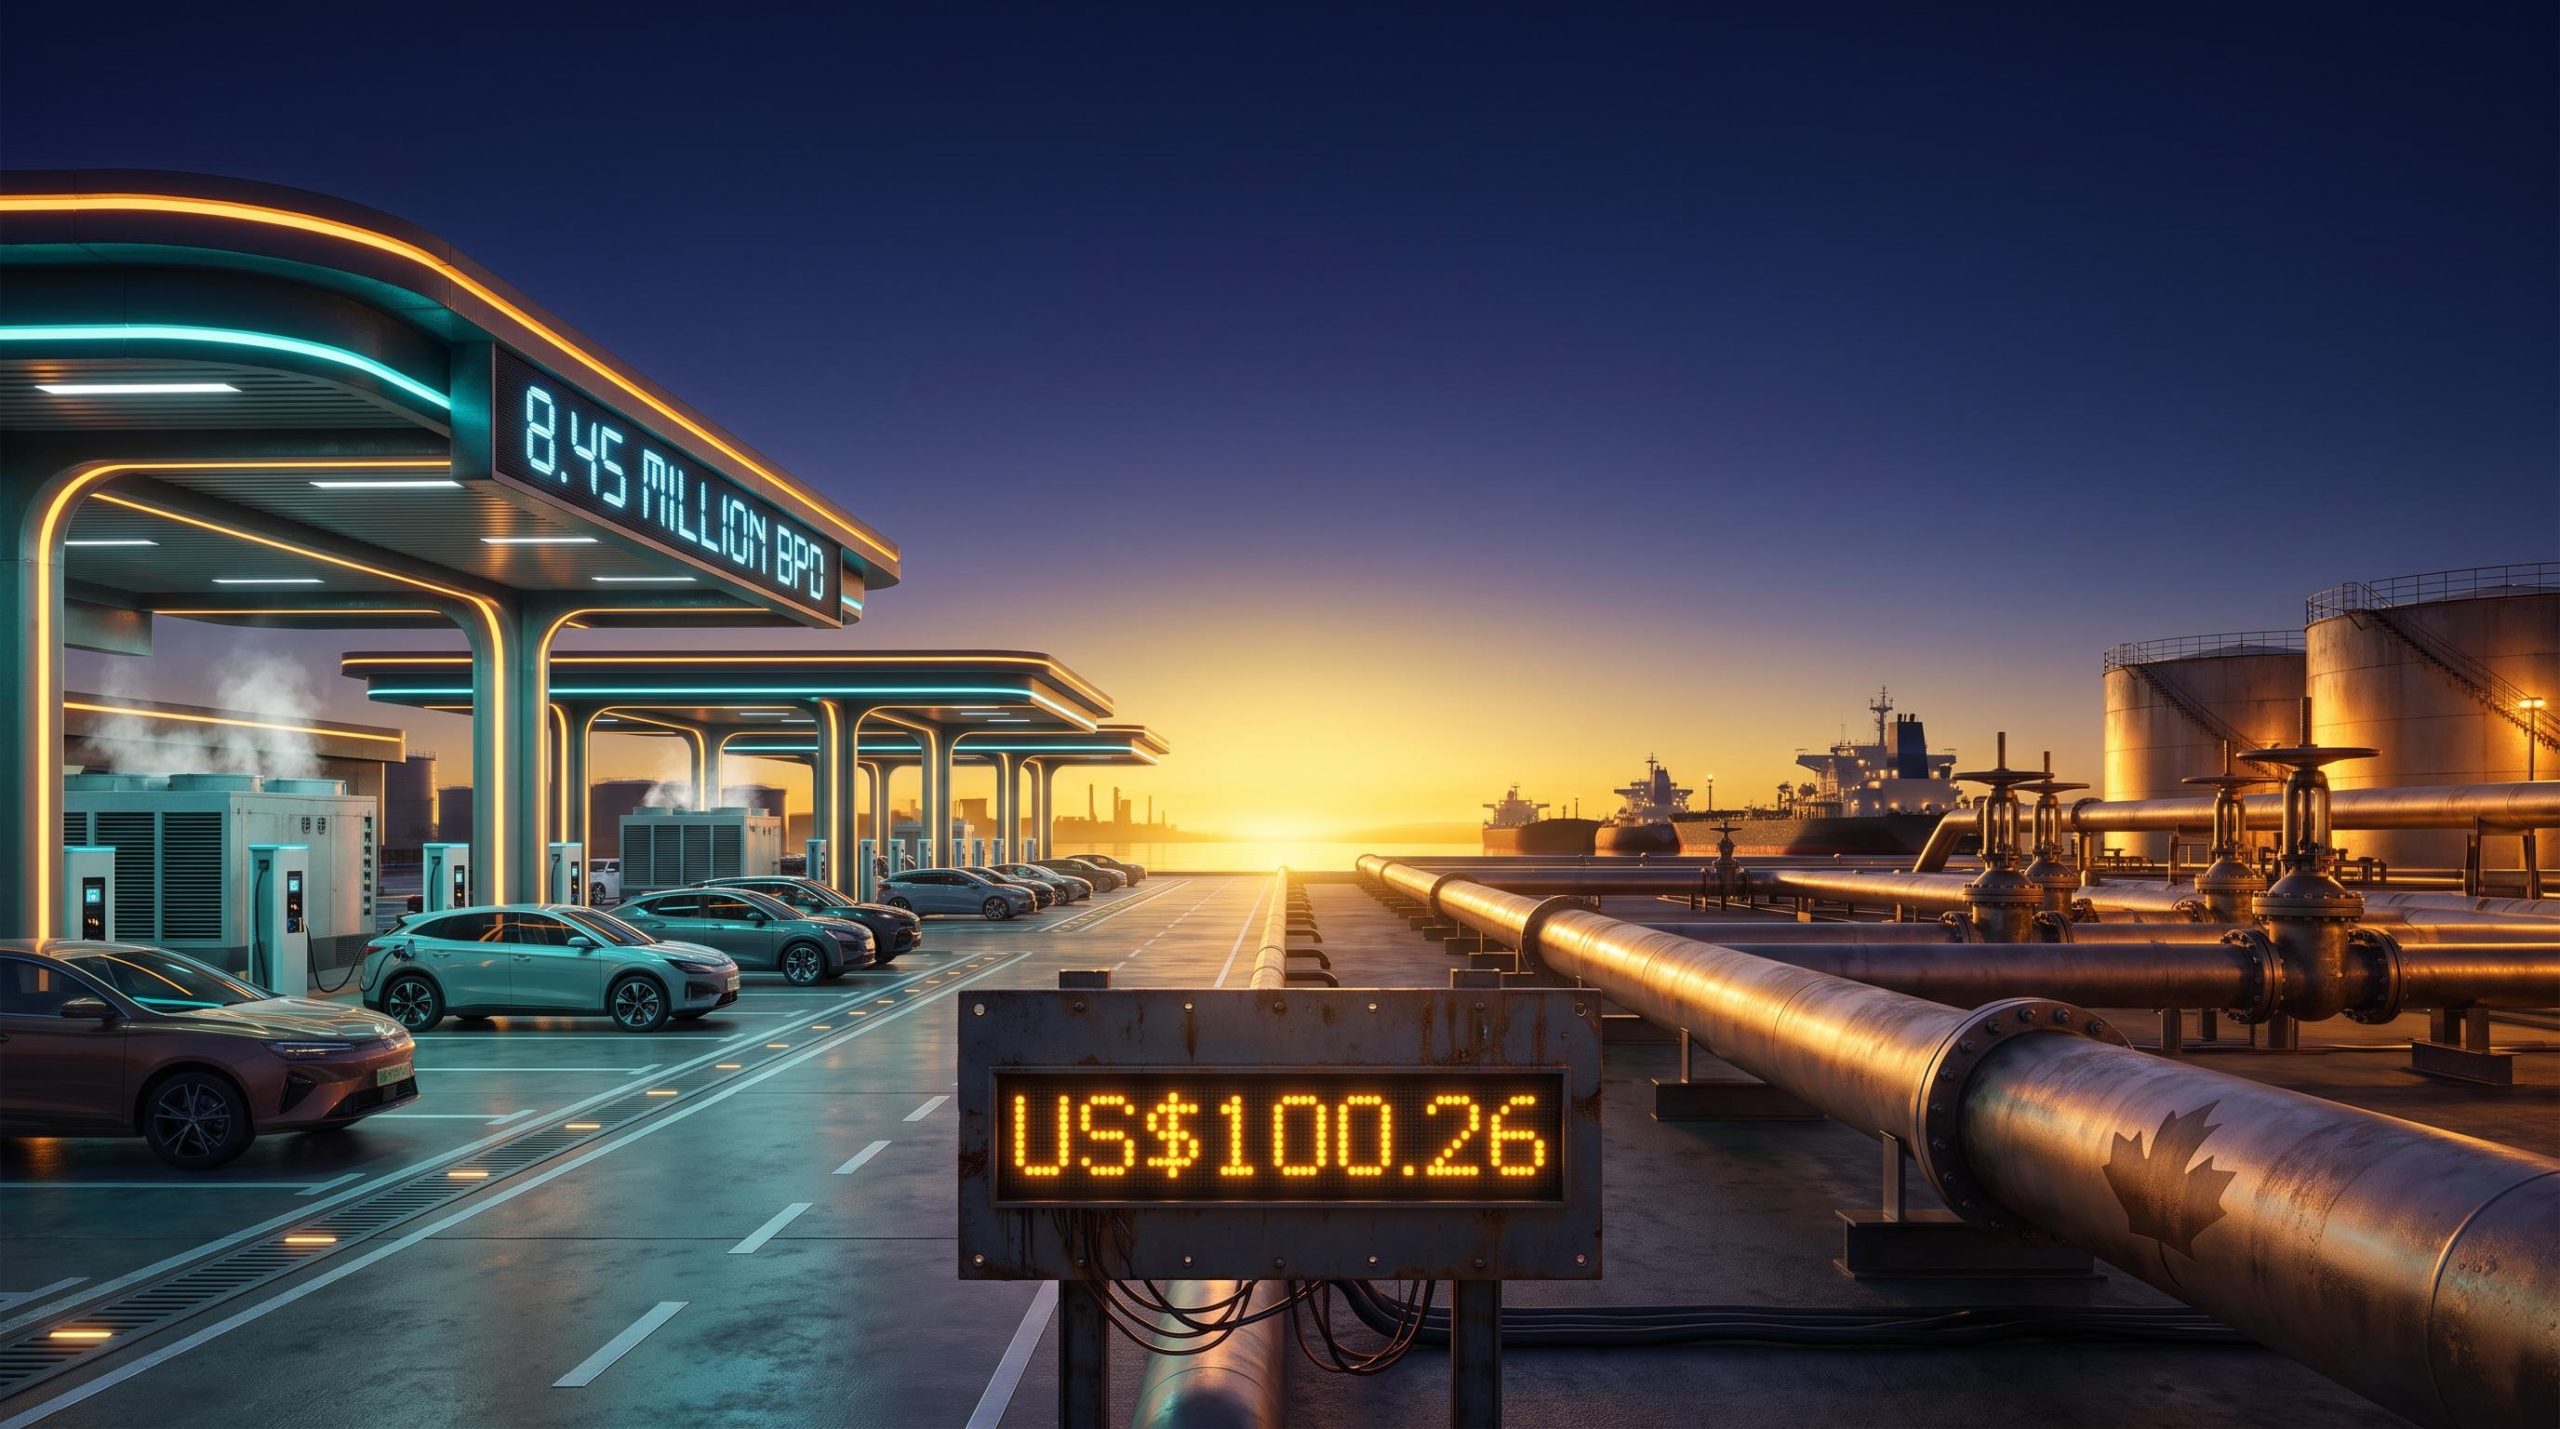
Consider what has not happened in September 2026. Brent crude sat near US$100.26 per barrel on 9 September 2026, elevated but nowhere near the July 2008 record, despite a year that delivered genuine supply shocks including disruption around the Strait of Hormuz.
The price spikes analysts warned about never fully arrived. Something absorbed the shock, and it was not a Saudi production decision.
Here is what the data actually tells you: two non-traditional players, one in Beijing and one in Ottawa, now hold levers over global crude that rival anything Riyadh controls. This explainer breaks down how China’s engineered demand buffer and Canada’s export leverage really work, and what both mean for the way you should read energy markets and position your portfolio.
The educational foundation: how demand and export monopolies set prices
The traditional model is simple enough to fit on a napkin. Oil prices are set by supply, and the supply is controlled by a “swing producer”, a country with enough spare capacity to turn output up or down and move the global price. OPEC, led by Saudi Arabia, has played this role for half a century.
That model still matters. It just no longer explains the whole picture.
OPEC’s structural decline was already well advanced before the UAE’s formal exit in May 2026, with the cartel’s share of global crude production having fallen from more than 50% historically to roughly 27-28%, a shift that reframes the entire old model of supply-side price control.
The first thing it misses is a mirror image on the other side of the equation: a demand-side swing actor. This is a consumer so large that it can deliberately toggle its own consumption up or down, using strategic reserves and domestic substitutes to control how much crude it pulls from the global market. When that buyer steps back, prices soften regardless of what producers do.
The second force is what analysts call escalation dominance. In an allied trade dispute, escalation dominance describes the ability of a captive supplier to hurt its main customer more than the customer can hurt back, because the buyer is structurally dependent on that specific product. A supplier with escalation dominance holds a credible threat it can deploy short of any military action.
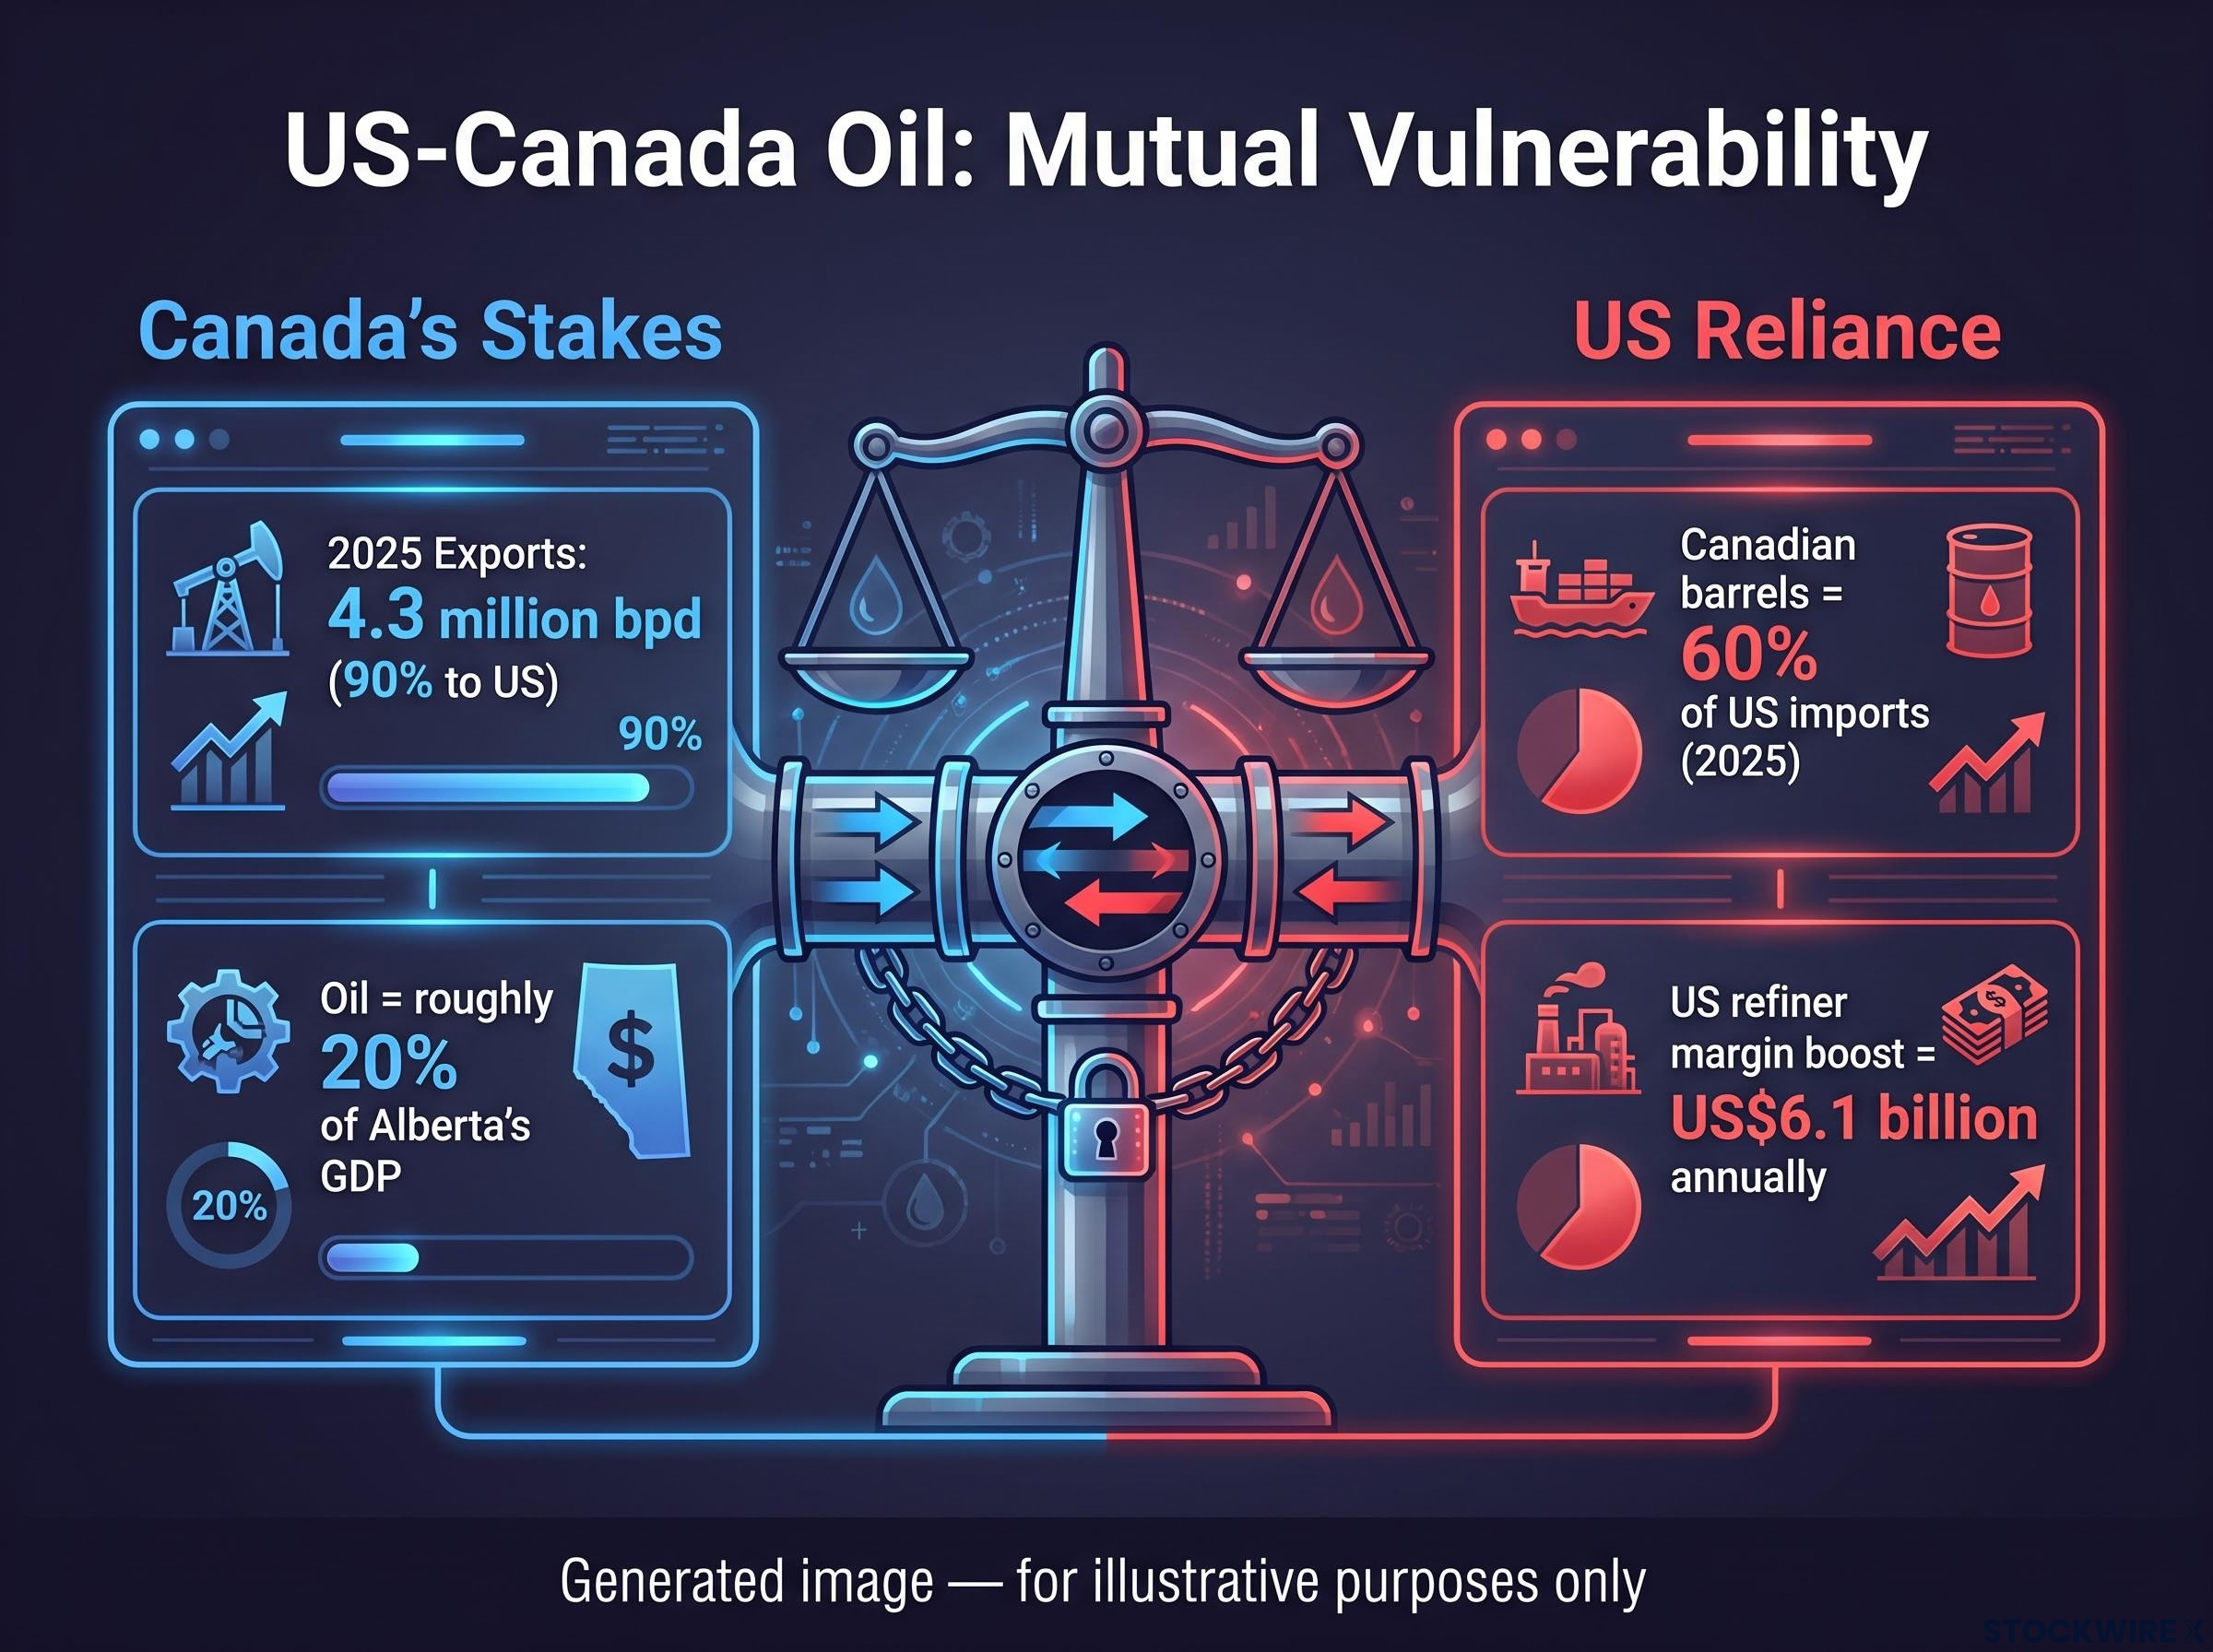
Canada sits in exactly that position. In 2025, Canadian barrels made up roughly 60% of all US crude oil imports, and much of it is a specific grade US refiners cannot easily replace.
Here is the shift you need to internalise:
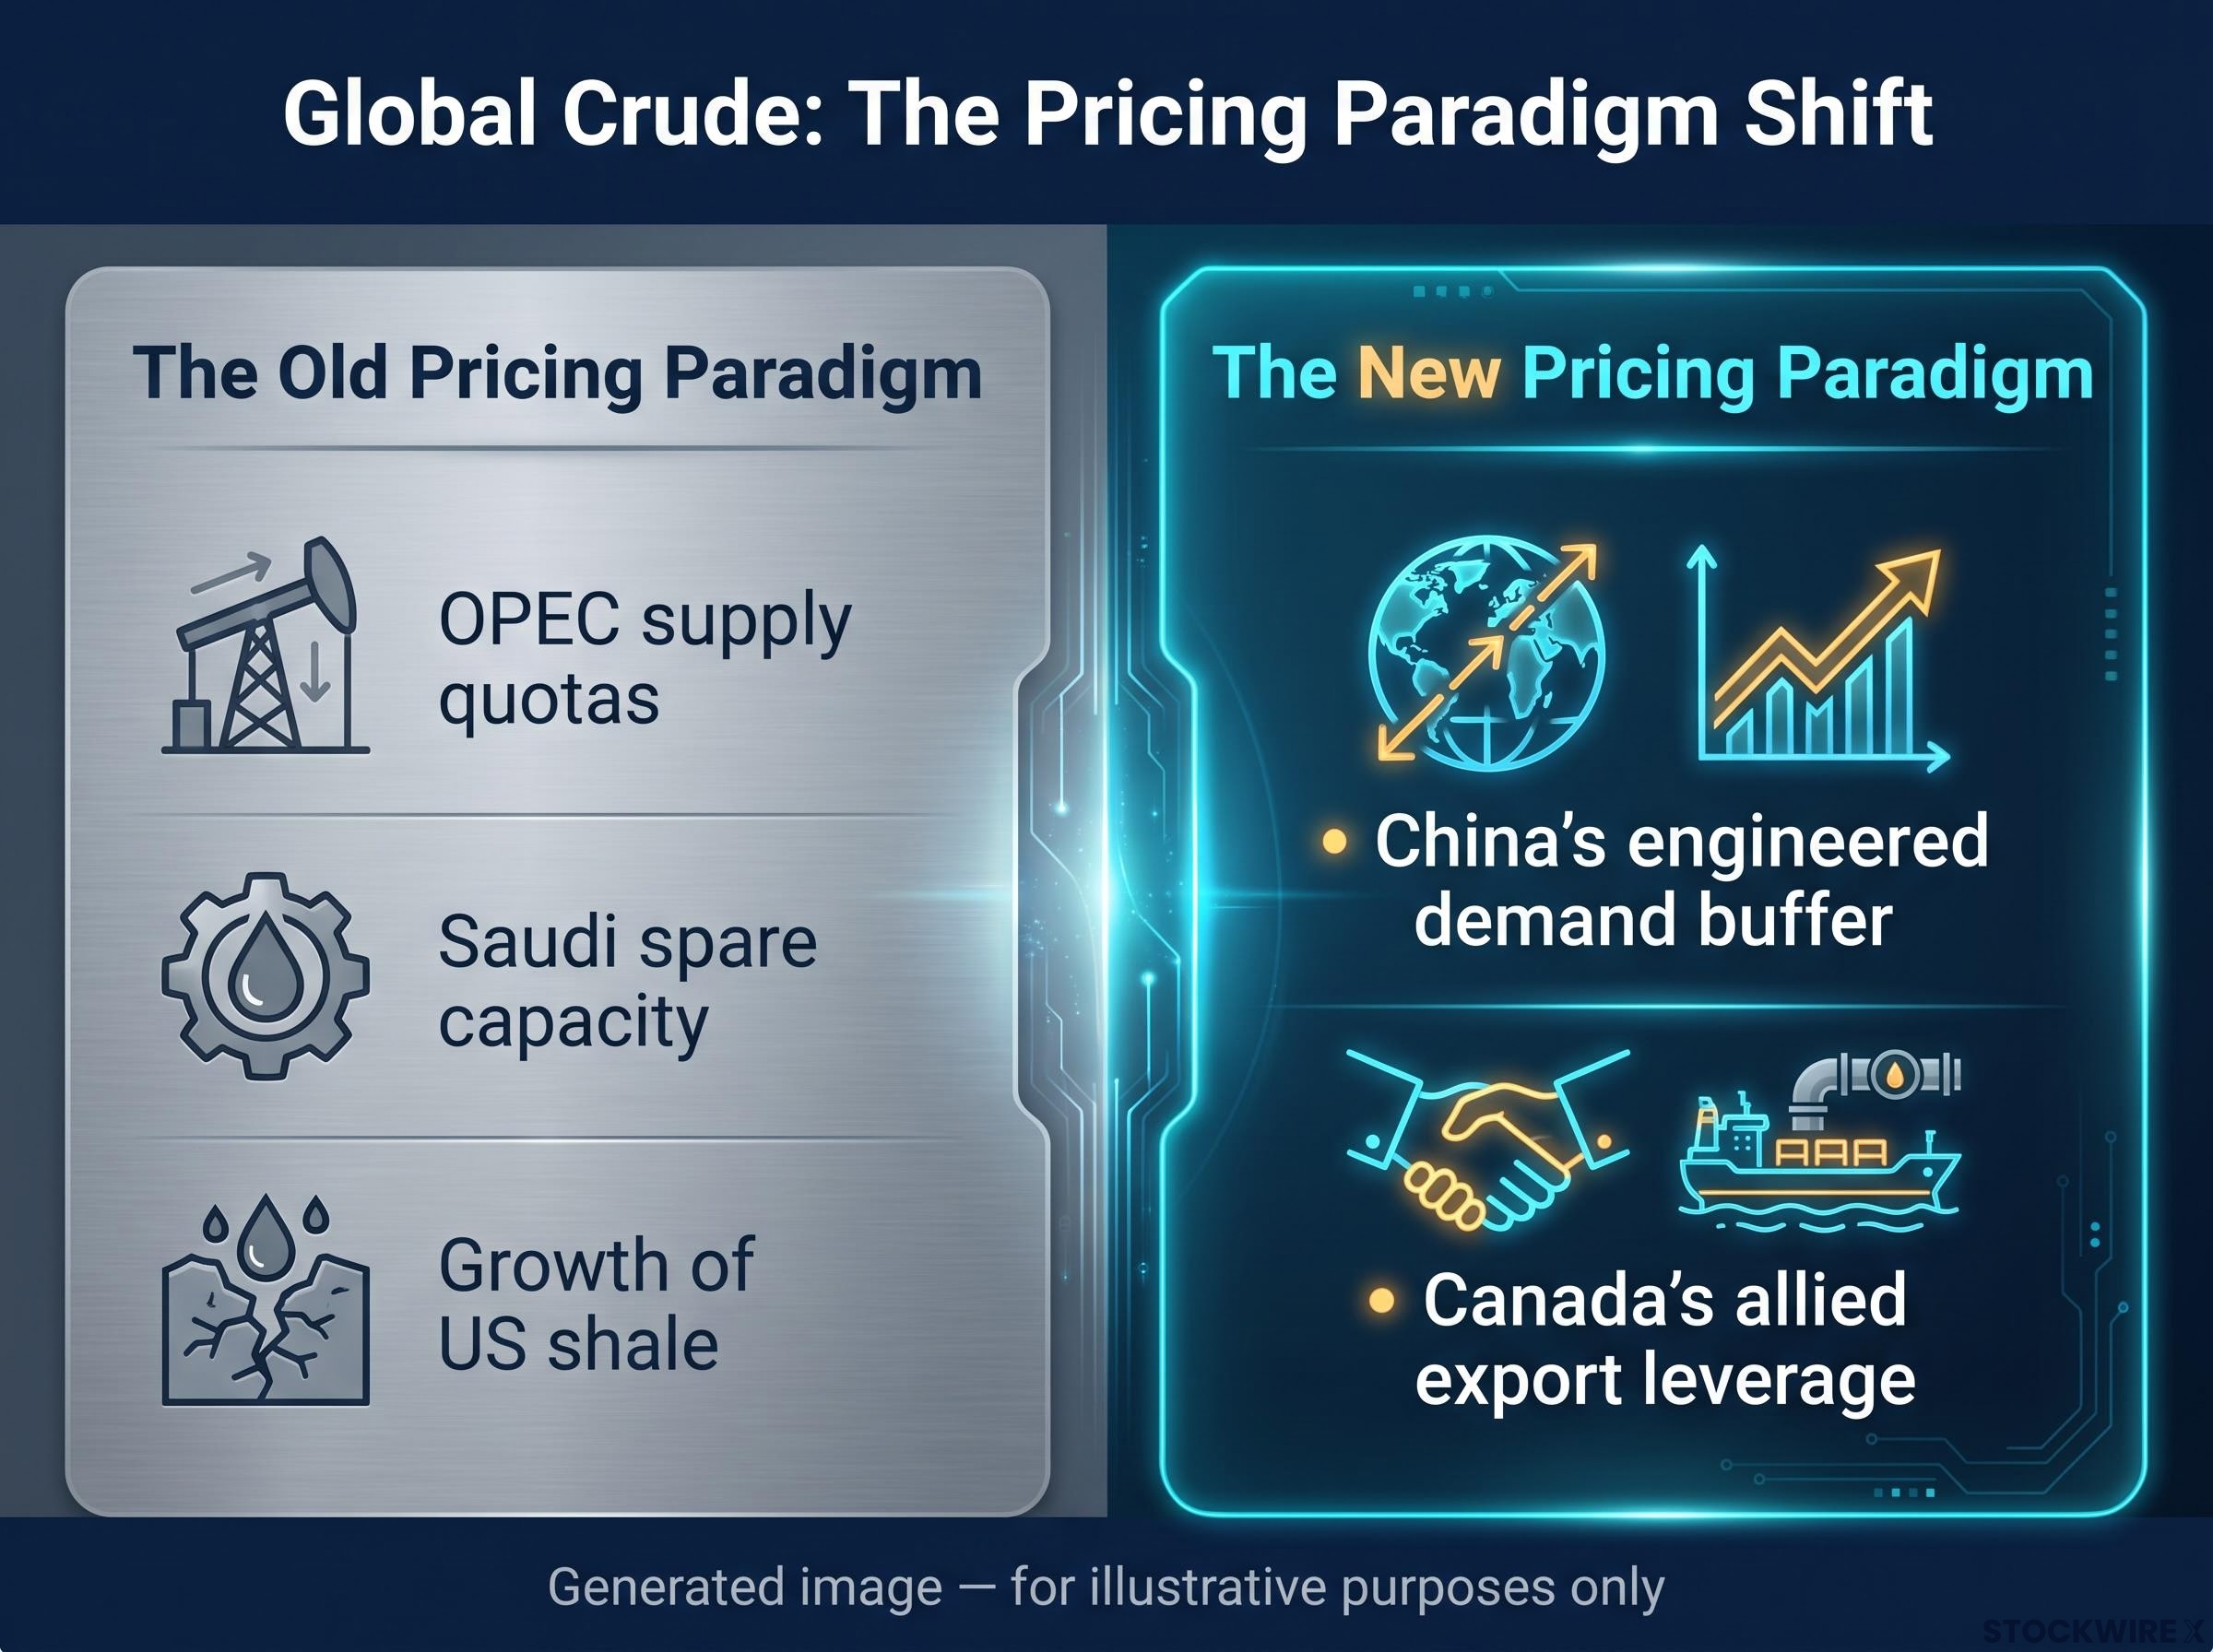
- The old pricing paradigm: OPEC supply quotas, Saudi spare capacity, and the growth of US shale determined the price of a barrel.
- The new pricing paradigm: an engineered demand buffer in China and allied export leverage in Canada now set the ceiling and the floor on where crude can go.
If you are trading energy on Middle East headlines alone, you are reading yesterday’s map. The physical barrels clearing the market are increasingly governed by these two structural forces, and misreading them means misreading the price signal itself.
When big ASX news breaks, our subscribers know first
How China weaponised its energy demand buffer
The numbers are the place to start, because their scale is hard to argue with. Chinese customs data for July 2026 showed crude imports of 35.73 million tonnes, equivalent to about 8.45 million barrels per day. Against a 2025 full-year average of roughly 11.6 million barrels per day, that is a collapse of more than three million barrels a day.
The reflex is to read that as economic weakness and reach for a short. That reflex would be wrong.
The structural supply gap created by the Hormuz closure sits so far beyond the scale of demand destruction that the IEA’s projected 1.6 million barrel per day full-year demand decline cannot meaningfully close it, a mismatch that sets the macroeconomic backdrop against which China’s demand buffer and Canadian export leverage are operating in 2026.
A June publication by Doomberg, the “Flex Capacitor” thesis, identified China as the demand-side equivalent of OPEC, arguing that Beijing has quietly harmonised global hydrocarbon fungibility. A Wall Street Journal article on 28 August 2026 made a related point: Xi Jinping has turned oil from a national vulnerability into a geopolitical instrument.
The “Flex Capacitor” thesis frames China as the effective swing actor on the demand side of oil, analogous to OPEC on the supply side. When Beijing pulls back, the world feels it in the price.
What makes this possible is physical, not rhetorical. China has deliberately overbuilt capacity across domestic energy substitutes, so it can cut crude imports without cutting economic activity. During the 2026 disruptions, it abruptly dropped imports from around 11 million barrels per day into the 8 to 9 million range, drawing down reserves that in 2025 exceeded US stockpiles by nearly 600 million barrels.
Here is where those substitutes sit:
| Pillar of the demand buffer | What it displaces | Key metric |
|---|---|---|
| New Energy Vehicles (NEVs) | Petrol demand from passenger cars | Retail penetration hit 65.1% of new sales in July 2026 |
| Coal-to-liquids and chemicals | Imported crude and gas feedstock | Recent conversion replaced roughly 38.1 million tonnes of oil and gas |
| Combined substitution (EVs, rail, LNG trucks) | Overall oil demand growth | IEA estimates roughly 1.2 million bpd of avoided demand growth since 2019 |
Beijing appears willing to run this lever in both directions. Over the weekend before early September, signs emerged of China re-entering the crude market aggressively, with Shanghai crude futures trading at a premium, potentially to lift prices ahead of the US midterm elections roughly two months out.
What this means for you is direct. China’s import slump is not a distress signal to short. It is a deliberate lever Beijing can pull to cap the upside of any oil rally, which means you can no longer treat Chinese import data as a clean proxy for Chinese GDP.
The threat of permanent demand destruction
Some of this may not reverse. Goldman Sachs estimated that around 10% of the recent demand destruction will become permanent, meaning barrels that simply never come back even when China buys again.
The longer horizon is the sharper point. The IEA projects that total Chinese oil consumption in 2030 will be only marginally higher than in 2024, effectively capping the single largest source of expected demand growth. For your portfolio, that removes the structural tailwind that has underpinned long-term bullish oil theses for two decades.
The IEA oil demand forecast to 2030 projects Chinese consumption rising only marginally from 2024 levels, a finding that effectively removes the single largest source of expected demand growth from the bullish oil thesis that has anchored long-term energy positioning for two decades.
Canada’s heavy crude and the threat of escalation dominance
If China controls a demand lever, Canada controls a supply one, and it is currently pointed at US refiners. Through 2026, the US and Canada have been locked in an intense trade dispute, with Washington imposing tariffs as high as 50% on a broad sweep of Canadian goods including steel, aluminium, dairy, and aerospace products by late August.
One category was conspicuously spared. Crude oil and energy exports were explicitly excluded from those tariffs, which tells you something about who actually holds the leverage.
The reason is grade-specific. US refiners on the Gulf Coast are engineered to process heavy crude, and Canadian heavy barrels arrive at a discount that boosts their output flexibility. A baseline study indicates US refiners enhance their margins by approximately US$6.1 billion annually by running Canadian heavy crude instead of regional replacements.
This is what gives Ottawa a theoretical “nuclear option”: restricting heavy crude exports to the US. Prime Minister Mark Carney has publicly noted that Canada supplies roughly 60% of US crude imports, signalling clear awareness of the leverage while stating that cutting energy flows is not part of current countermeasures.
The reason it stays theoretical is that pulling this lever would inflict serious damage at home:
- Economic self-harm: In 2025, Canada exported 4.3 million barrels per day of crude, with 90% going to the US. Oil extraction accounts for roughly 20% of Alberta’s GDP, so a restriction would strand production and gut provincial revenues.
- Constitutional hurdles: Exports are a federal power, but production is provincial. Blocking crude unilaterally would likely trigger a domestic constitutional fight.
- Energy security blowback: Eastern Canadian refineries lean heavily on US crude and refined products, leaving them exposed to US retaliation.
The template already exists. In February and March 2025, a US tariff threat prompted Ontario to slap a surcharge on electricity exports before both sides quickly backed down, a reminder that allied energy fights tend to be short and resolved by mutual dependence.
The Trans Mountain Expansion wildcard
The picture is shifting because Canada now has an exit. The Trans Mountain Expansion (TMX) pipeline has broken the US monopsony, the situation where a single buyer controls the market, by giving Canadian producers a route to Asian buyers.
Routing barrels to tidewater, meaning ocean-access ports, lets producers price off Brent rather than the discounted Western Canada Select benchmark. That has narrowed the historical WTI-WCS discount from around US$15 per barrel to under US$10, strengthening Canada’s hand without it ever having to touch the export switch.
The oil-to-CAD transmission chain has weakened materially over the past decade, meaning Canadian producers with tidewater access capture improved realised prices without a proportional lift to the broader Canadian dollar, a divergence that matters when sizing exposure to Albertan producers versus CAD-denominated assets.
For your holdings, understand this as a high-impact, low-probability tail risk. If Canada ever did restrict heavy crude exports, downstream refining and transport names would face immediate and severe margin compression, so the structural US reliance on Albertan barrels is a risk worth pricing in even if the trigger rarely gets pulled.
The second-order shockwaves for global portfolios
Put the two threads together and you get a market that no longer moves as one block. China’s engineered demand ceiling and Canada’s constrained export leverage interact to produce highly dispersed energy returns, where the grade and the region matter more than the headline oil price.
The aggregate trend is soft. The IEA forecasts global oil demand will actually decline by 1.6 million barrels per day in 2026, which means the long-term demand story is fading as a driver.
What replaces it is short-term toggling. With China able to suppress structural demand, cyclical price spikes will increasingly be driven by import decisions and inventory draws rather than durable growth, so the volatility becomes tactical rather than trend-based.
Winners and losers separate along specific lines. Canadian producers with tidewater access via TMX capture a US$5 to US$6 per barrel premium, while US complex refiners with heavy-crude capability benefit from discounted Albertan feedstock and any geopolitical security premium.
Here is how to evaluate your own exposure:
- Check whether the refiners you hold are “complex”, meaning built to process heavy crude, because they capture the margin advantage that simple refiners cannot.
- Assess pipeline operators on their tidewater access, since routes to ocean ports are now the difference between Brent and discounted WCS pricing.
- Weight Canadian producers by their ability to reach export markets, not just their reserves, because access now sets realised prices.
This is the blueprint for spotting which assets catch a geopolitical premium and which get caught flat-footed as trade flows redraw themselves.
This article is for informational purposes only and should not be considered financial advice. Investors should conduct their own research and consult with financial professionals before making investment decisions. Past performance does not guarantee future results, and these forward-looking statements are speculative and subject to change based on market developments.
Recalibrating your energy investment framework
The era in which Middle Eastern supply dictated every energy outcome is over. It has not vanished, but it now shares the stage with two structural forces that are, on many days, more decisive.
Political decisions in Beijing and Ottawa now carry the same weight for global crude as anything decided in Riyadh or Washington. China’s demand buffer sets the ceiling on rallies; Canada’s export leverage and tidewater access reshape where the physical barrels flow and at what price.
The practical takeaway is to stop watching only the aggregate oil price and start watching the plumbing. Two indicators tell you where this is heading: the WTI-WCS spread, which signals Canada’s realised pricing power, and sudden premiums in Shanghai crude futures, which flag when Beijing is stepping back into the market to move prices its way.
For investors who want to apply the WTI-WCS spread and Shanghai futures signals in practice, our dedicated guide to reading US oil inventory data shows how to separate crude builds from product draws and why headline inventory numbers routinely point in the opposite direction from refiner margins.