Professional trading desks build structured hours into the working week for something that produces no profit at all: reviewing charts they never traded. Most retail traders do the opposite. They close the platform the second the session ends.
That gap between the two behaviours is not a matter of effort or screen time. It is a matter of method, and the method has measurable consequences.
A 2026 analysis by Traders Second Brain, drawing on more than 8,400 active journal users, found that daily journalers reached 38% profitability against just 19% for those who journaled less than once a week. The desk-trained process is not a nice-to-have. It shows up in the numbers.
Here is exactly how that process works, and what you need to start one. This is the specific method professional desks use to build what traders call a playbook, rendered in enough detail that you can begin constructing your own version this week, without a mentor, a proprietary firm, or expensive software.
Why professional traders review charts they never traded
Picture a trader who has just finished a demanding week. Instead of shutting down, they spend Saturday morning studying setups that produced nothing for their account. No entry, no exit, no P&L. Why would anyone do that?
The answer is that they are not studying trades. They are building a library.
When a young proprietary trader joined SMB Capital, his primary mentorship directive was blunt: conduct daily chart reviews of the best setups, regardless of whether he actually traded them. Observation and documentation came first. Execution came later.
The onboarding rule Review the best setups every day, whether you traded them or not. The archive precedes the position.
That trader, roughly 22 to 23 years old at the time, went further. Over a two-year period he dedicated his weekends to writing personal research reports as a memorisation tool for micro and macro market concepts. Systematic study outside market hours was not an exceptional habit on the desk. It was the norm.
Prop trading desk culture institutionalises the habit-first sequencing that makes the archive method possible: firms like Jane Street and Optiver dedicate four of a trader’s first six months to process formation before any growth in size or complexity is permitted.
The logic underneath this is straightforward. Without an archive of comparable setups, you have no baseline for judging whether the chart in front of you is A-grade or mediocre. And if you cannot grade the opportunity, your position sizing becomes arbitrary and your conviction becomes guesswork.
An archive of historical comparables does three specific jobs:
- It builds a mental library of what similar setups have done before
- It calibrates what an A-grade setup actually looks like versus an average one
- It establishes a baseline for stop placement and position sizing
That last point is where the practice pays off in live markets. Having seen the same structure play out fifty times, you can identify stop levels, size the position appropriately, and judge the relative significance of the opportunity, all before committing capital.
Here is what reviewing untraded setups really tells you. Conviction under pressure is not instinct or nerve. It is pattern recognition, built deliberately over time in low-stakes conditions, so that when the moment arrives, the decision is already obvious.
When big ASX news breaks, our subscribers know first
What a trading playbook actually contains (and how the archive works)
A finished playbook entry does not look like a trade idea. It looks like a map.
A playbook, in professional terms, is a documented catalogue of setups for which a trader has demonstrated a statistical edge. Each entry is logged with context, technical analysis, tape reading, fundamentals, and strict trade management rules. The point is to shift the daily focus away from profit and loss and toward process adherence.
Beneath the playbook sits the chart archive, the database layer that makes it work. It is screenshot-driven, annotated, and organised by setup type rather than by date. When a familiar pattern appears in live trading, you can pull historical comparables within minutes instead of relying on memory.
Reading the SpaceX IPO playbook as a template
The June 2026 SpaceX IPO shows what a playbook entry looks like for a real catalyst event.
On 12 June 2026, SpaceX priced its Nasdaq listing at $135 per share, raising roughly $75 billion in the largest IPO on record. The stock opened around $150, traded into the mid-$170s, and closed near $160.95, a gain of roughly 19% to 20% that pushed the company’s valuation above $2 trillion.
A trader working from a playbook would have documented the catalysts in advance: the opening print, the opening drive, the high-of-day breakout, and the known lockup expiry dates. None of these were discovered reactively. They were mapped before the stock priced.
On 16 June, the launch of exchange-listed options acted as a second-phase catalyst, unleashing record volume and predominantly bullish activity. Then supply concerns arrived. By 23 June, the Los Angeles Times reported the stock had fallen 16% to around $156.11 on unease over debt and looming lockup expirations.
The first lockup expired on 6 August 2026. Roughly 911.5 million shares became eligible to trade, lifting the available float by about 43% to over 1.55 billion shares. Despite the historic supply influx, Reuters reported the stock rose in heavy trading that day. A full 180-day lockup was scheduled to expire on 8 December 2026.
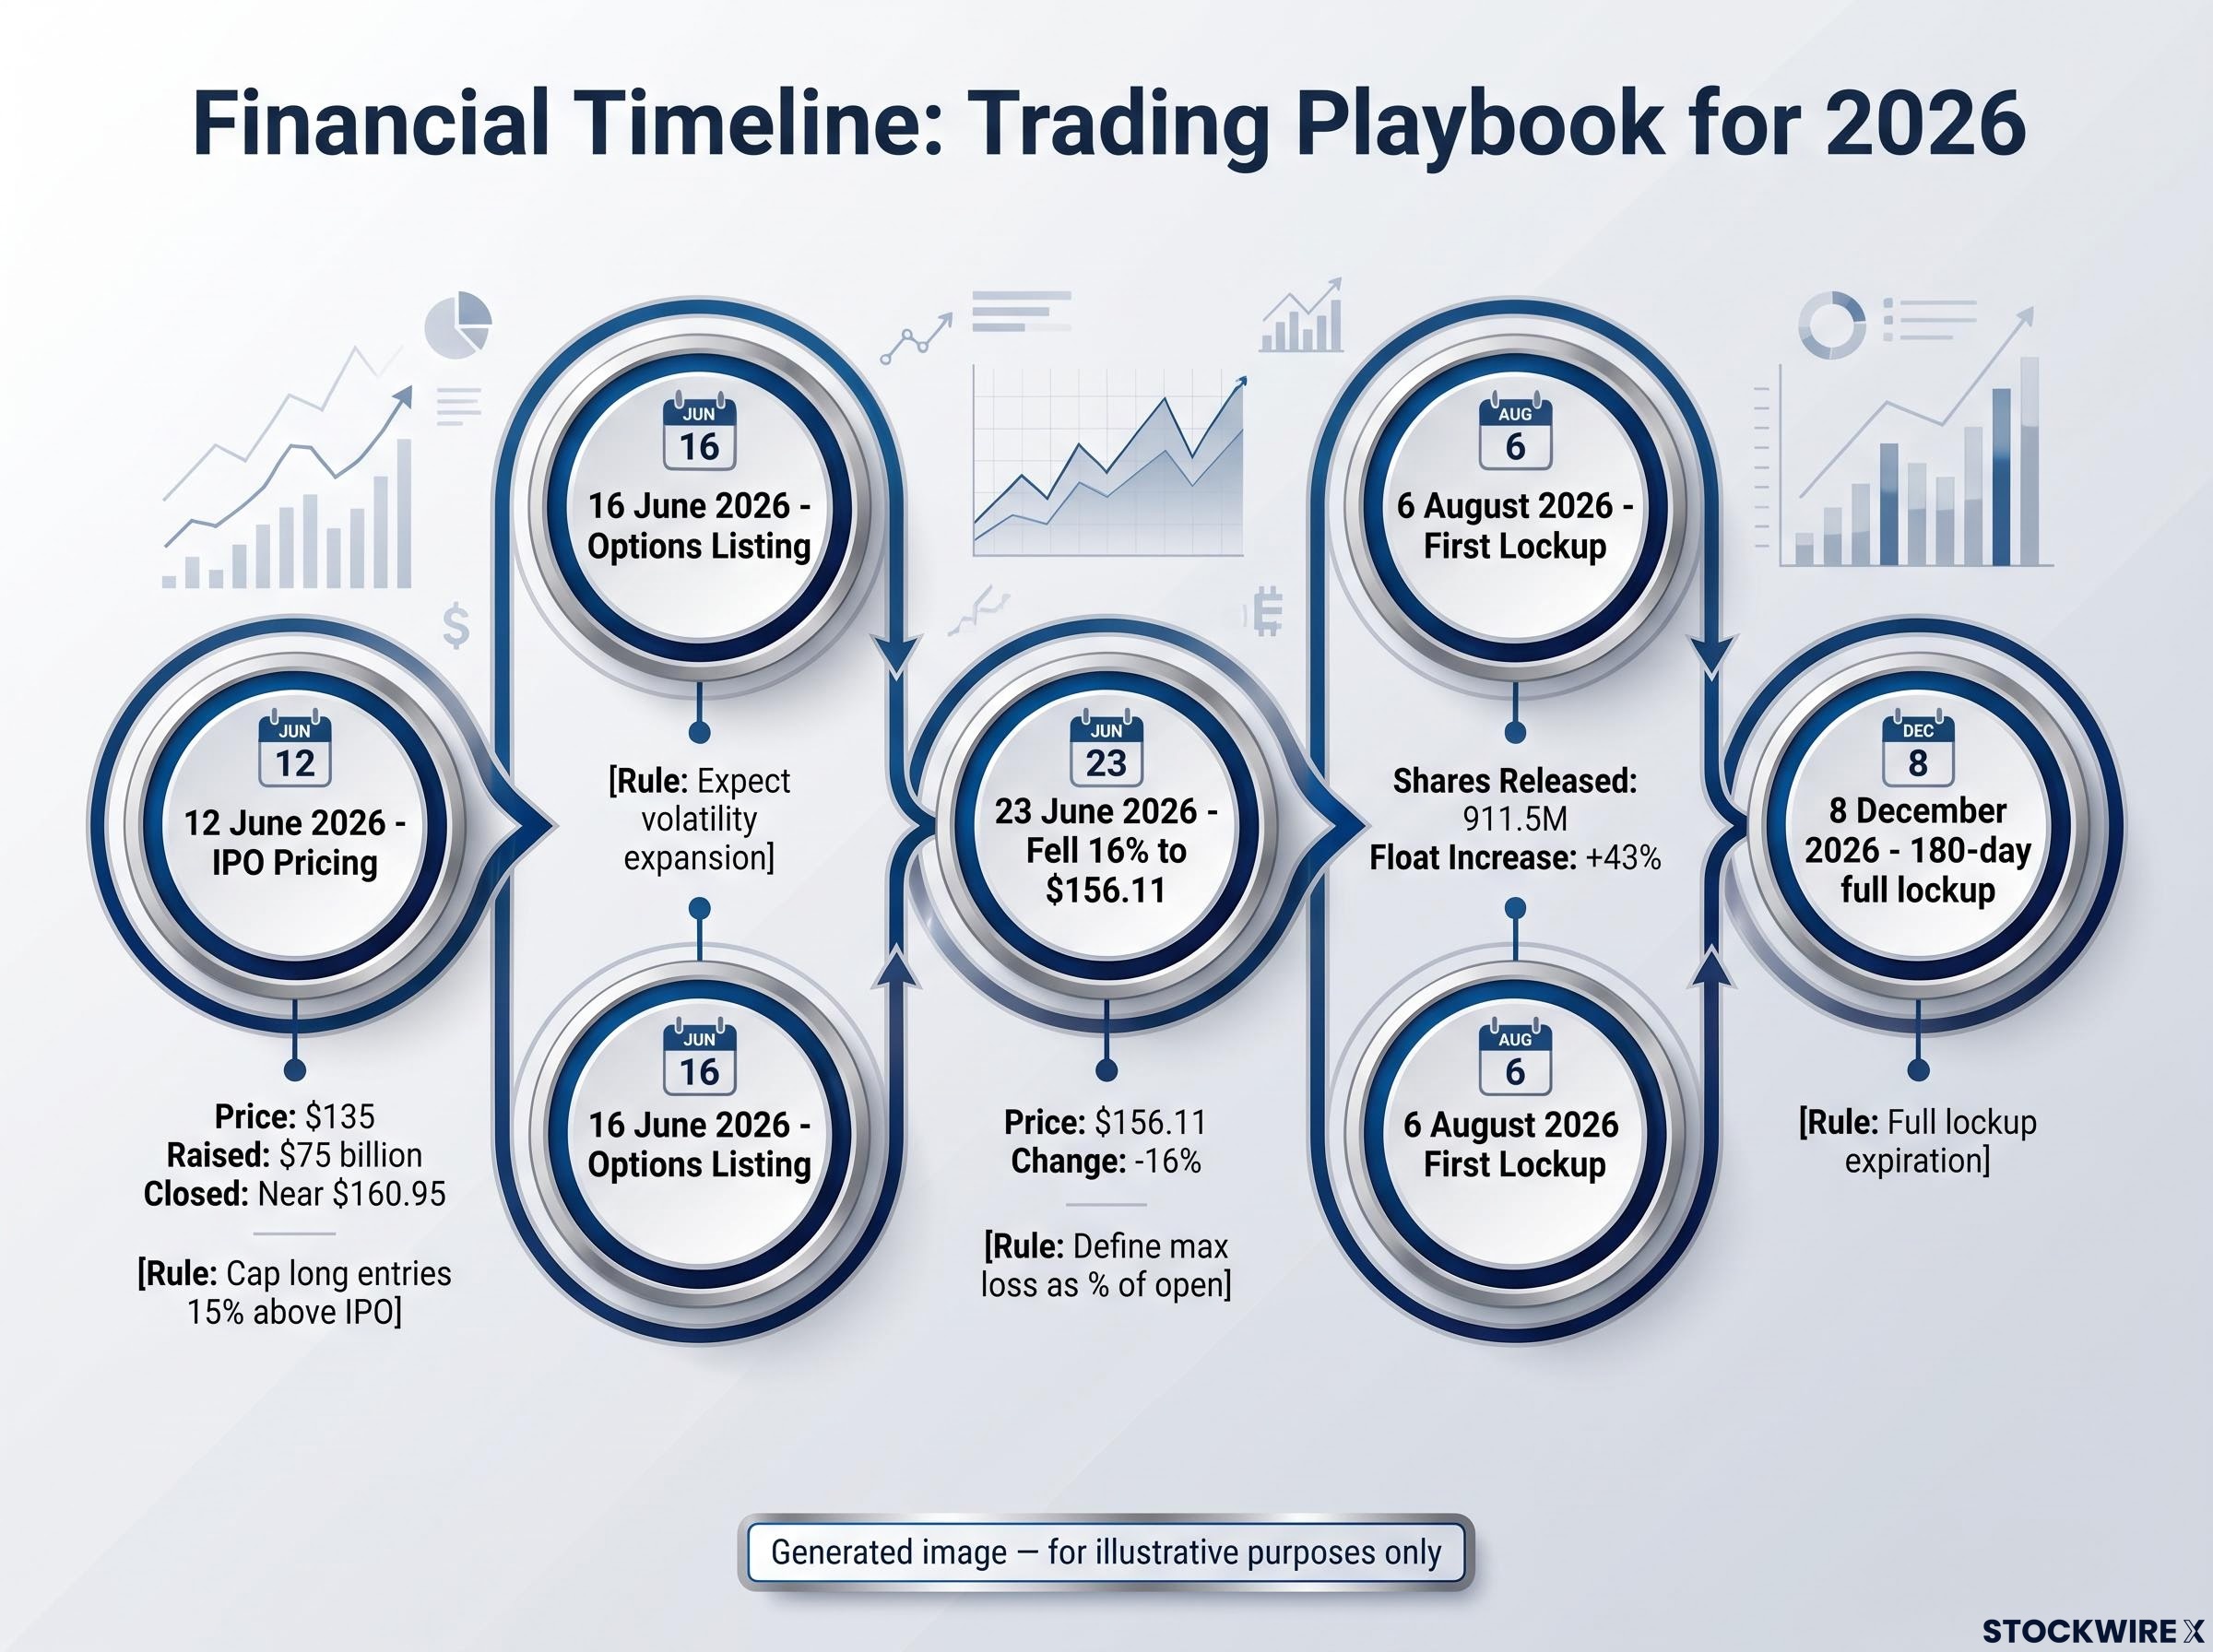
| Catalyst Event | Date | Price Action or Impact | Playbook Rule or Observation |
|---|---|---|---|
| IPO pricing | 12 June 2026 | Priced at $135, closed near $160.95 (approx 19-20% gain) | Cap new long entries at 15% above IPO price |
| Options listing | 16 June 2026 | Record volume, predominantly bullish activity | Second-phase catalyst, expect volatility expansion |
| First supply-concern drop | 23 June 2026 | Fell 16% to approx $156.11 on debt and lockup unease | Define maximum loss as a fixed percentage of opening print |
| First lockup expiry | 6 August 2026 | Approx 911.5M shares eligible, float up approx 43%; stock rose | Documented in advance, not treated as a guaranteed short |
| Full 180-day lockup expiry | 8 December 2026 | Remaining locked shares become eligible | Known marker for supply pressure well ahead of the date |
The IPO-specific risk parameters a trader would pre-define include:
- Cap new long entries at a maximum of 15% above the IPO price
- Define maximum loss as a strict percentage of the opening print, since no historical support levels exist
- Separate allocated IPO shares from post-listing purchases so the two are managed differently
The key thing this example tells you is that a playbook entry is not a trade thesis. It is a structured map of where price is likely to do something and where you must exit if it does not, built before the moment arrives. That pre-commitment is exactly what prevents the emotional override that derails most retail participation in high-volatility IPO conditions.
The tools professional and serious independent traders use to build archives
You do not need specialist software to start. You almost certainly already have access to the right tool.
Think of the tooling in two categories. The first is general-purpose note and screenshot organisers, such as Notion and Evernote, used to build the raw archive. Notion’s marketplace hosts several trading journal templates, and Evernote supports the screenshot-attachment workflow that logging manual trades requires.
The second category is specialist journaling and analytics platforms that add structured performance tracking on top: Tradervue, TradeZella, Edgewonk, TradesViz, TraderSync, and TradeLog. These add broker auto-import, prop-firm presets, and pre-trade checklists.
There is also a purpose-built layer for pattern matching. ChartProj is an algorithmic tool that surfaces structurally similar chart comparables from a ticker or price chart input, automating the scanning that desk traders otherwise do by hand.
Several frameworks show the archive habit in action. The Paper Trading Journal (PTJ) hosts more than 295 documented trade reviews that function as a ready-made comparable library. FXFoundations grades case studies from A to F on process quality rather than outcome. SignalPilot recommends building a 20-trade pattern library alongside a Failed Trade Journal, while Trader Strategy Roundtable practice is to maintain 6 to 12 named setups with strict performance stats, retiring negative expected value setups after around 30 trades.
| Tool Name | Primary Function | Best For |
|---|---|---|
| Notion | Note and screenshot organiser with journal templates | Building the raw archive from scratch, free |
| Evernote | Screenshot attachment and manual trade logging | Simple image-driven archives |
| Tradervue | Structured journaling and performance analytics | Reviewing trade statistics over time |
| TradeZella | Journaling with broker import and analytics | Traders wanting automated data capture |
| Edgewonk | Detailed journaling and behavioural tracking | Diagnosing recurring mistakes |
| ChartProj | Algorithmic discovery of similar chart structures | Finding comparables once a base library exists |
| Paper Trading Journal (PTJ) | Library of 295+ documented trade reviews | Studying pre-built comparables |
| FXFoundations | Case studies graded A to F on process | Learning process-first evaluation |
A sensible progression looks like this:
- Start with a screenshot archive in Notion or Evernote, using a free template
- Add structured journaling with a specialist platform once your trade volume justifies it
- Introduce algorithmic pattern comparison once you have a base library of 20-plus setups
Here is the part that matters most. The tool you choose matters far less than the discipline of using it. A reader who commits to annotating 20 screenshots a month in a free Notion template will build more genuine edge than one who pays for premium software and skips the annotation habit entirely.
Where the playbook method fails and how to keep it honest
The failure modes are not disclaimers. They are the advanced layer of the system, the part that separates traders who build archives from traders who build archives that actually improve their trading.
Three failure modes do the most damage:
- Overfitting: a setup built from historical comparables can capture non-repeatable noise rather than genuine edge
- False conviction: documented setups become expectations rather than hypotheses, and you start seeing patterns that are not there
- Hidden discretion: a supposedly rules-based system quietly relies on skipping setups that do not “look right”
Overfitting is the technical trap. A setup that fits past data beautifully may just be describing random noise. The correction, as noted in trading research, is rigorous out-of-sample validation and walk-forward analysis rather than backtesting on the same data you used to build the setup.
False conviction is the psychological version of the same problem. When expectations tied to a documented setup harden into demands, you develop a rigid mindset and stubbornly insist on a pattern that is not truly present. It is curve-fitting, but in a live market with real money.
The practitioner consensus is that the strongest approach combines systematic foundations with discretionary refinement on timing and sizing. The playbook defines the conditions for entry and exit. Human judgment governs whether those conditions are genuinely met in the current market regime.
The profitability contrast Daily journalers reached 38% profitability with a profit factor of 1.12. Those journaling less than once a week reached just 19% profitability with a profit factor of 0.74. From a 2026 analysis of over 8,400 active journal users.
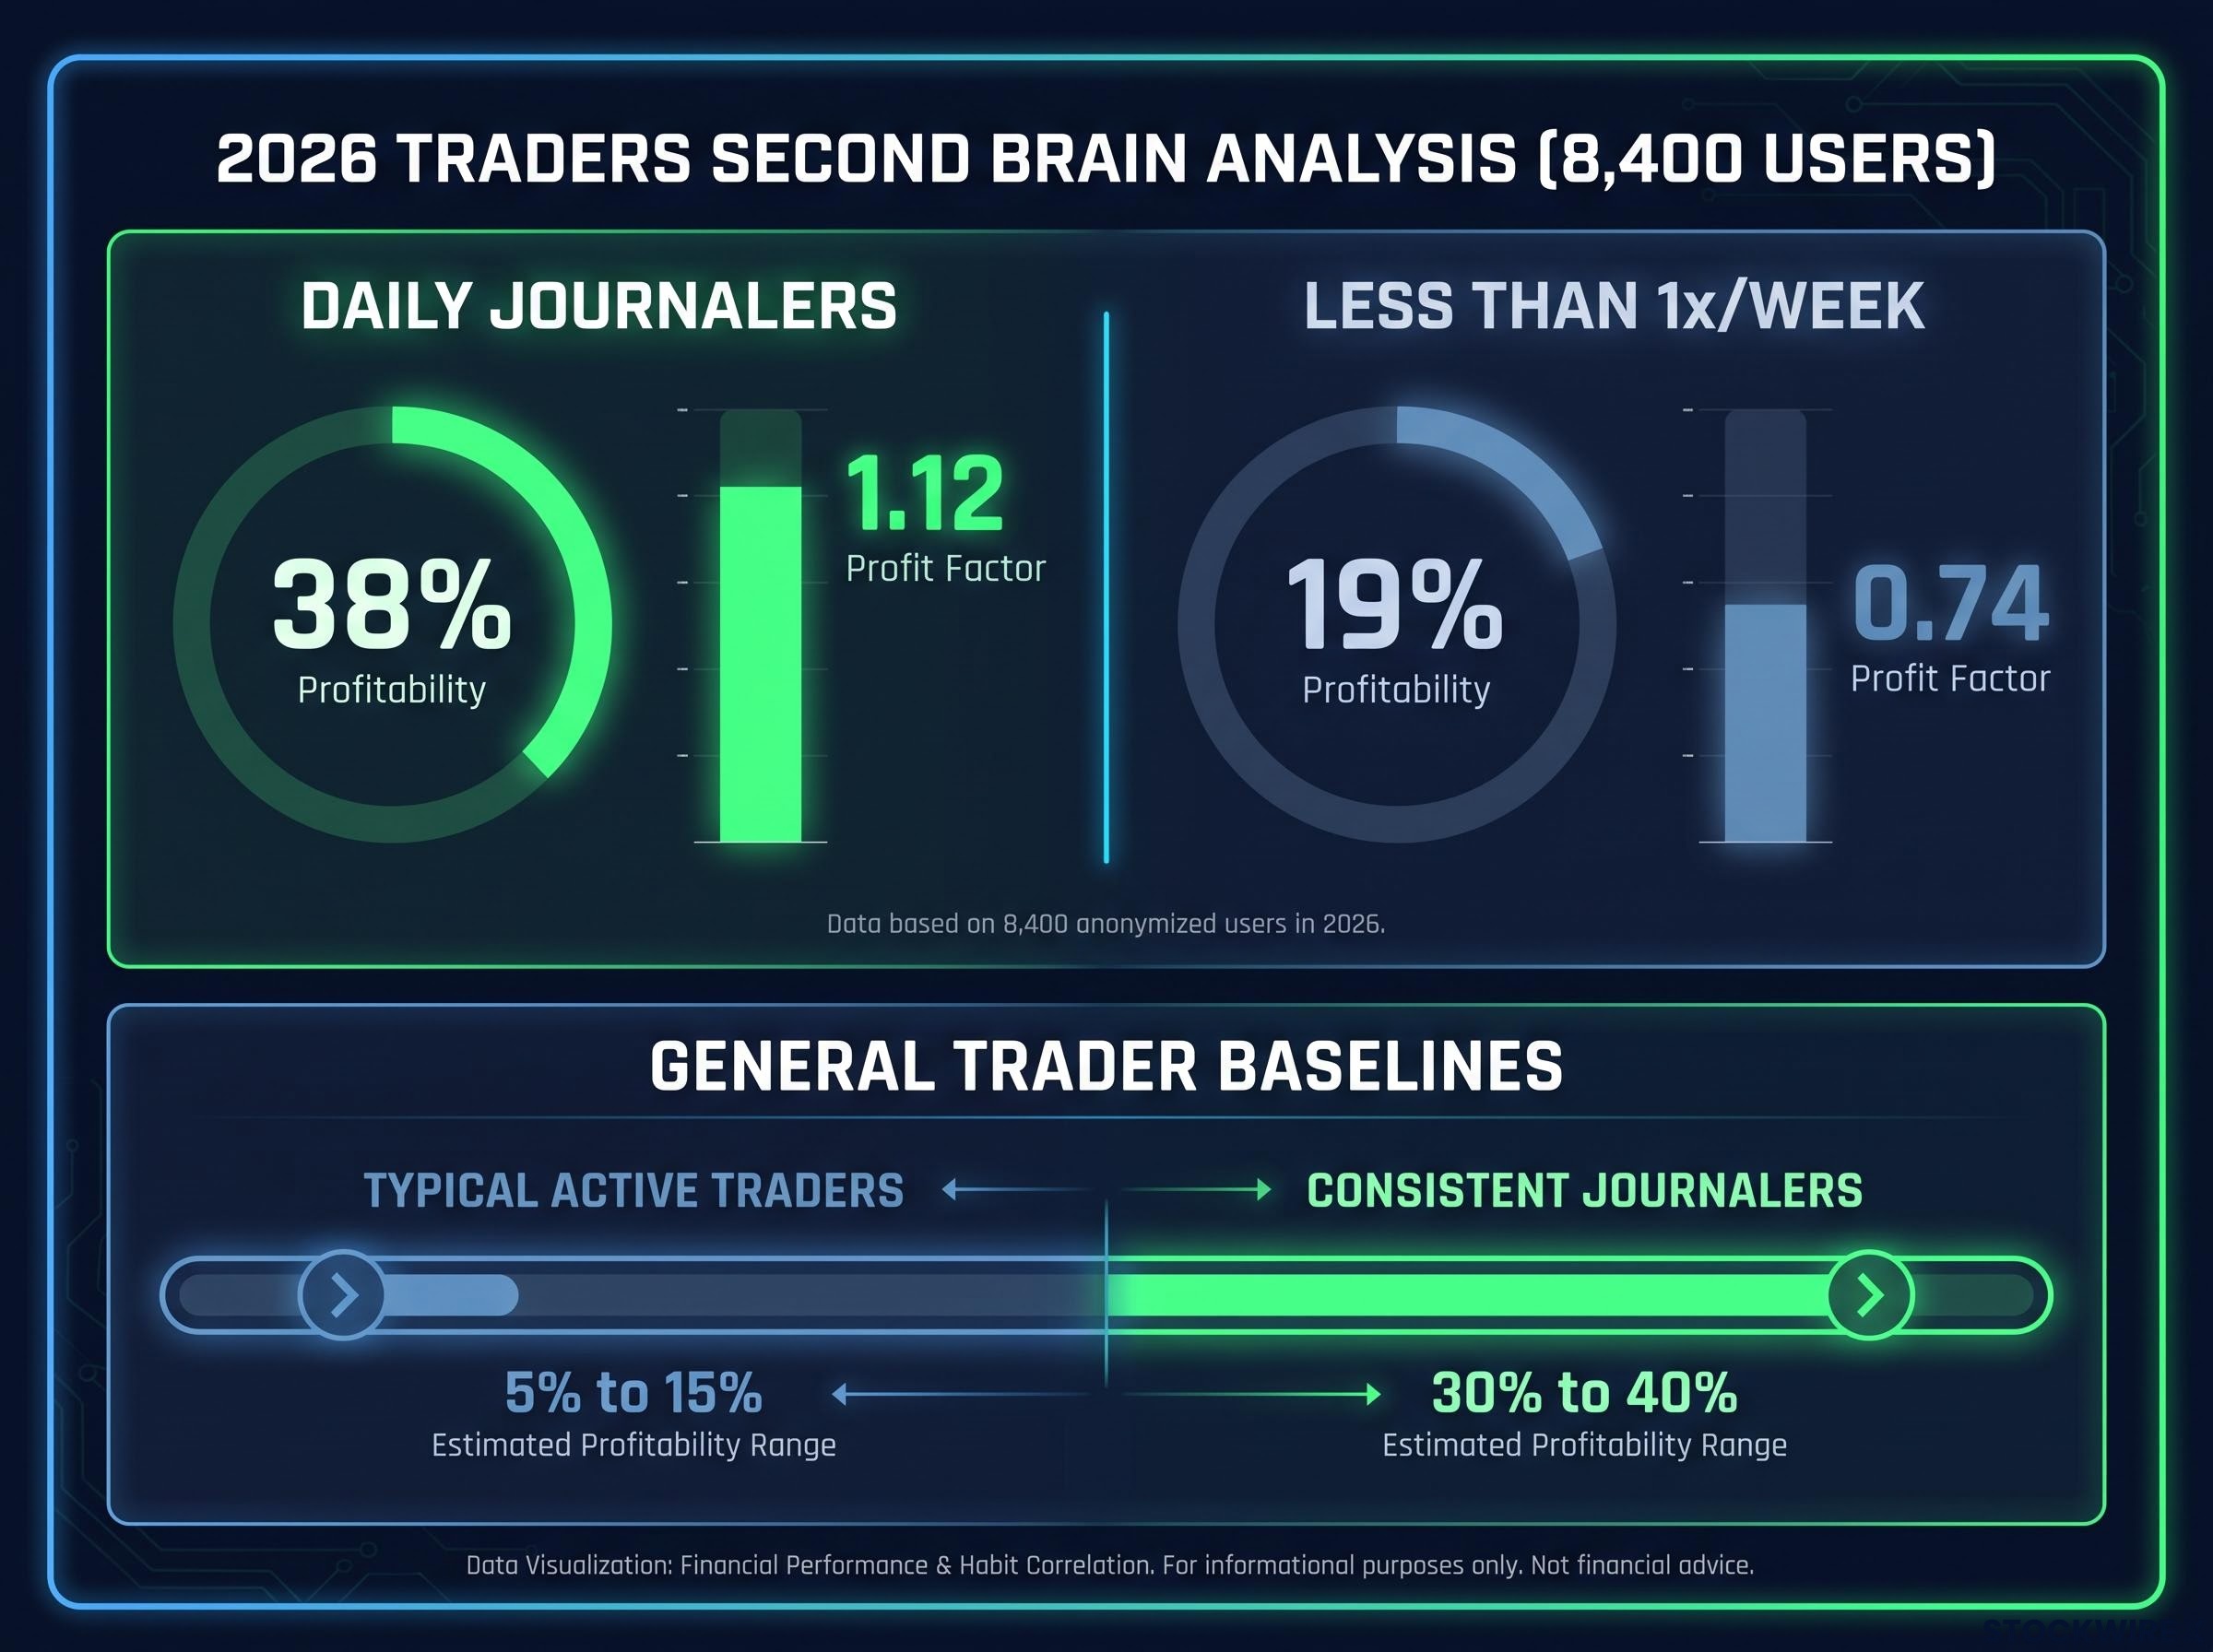
The broader baseline sharpens the point. Typical active trader profitability sits around 5% to 15%, rising to 30% to 40% among those who actively journal.
Contrast that with how most retail traders behave. A November 2024 report from the Commodity Futures Trading Commission (CFTC) found retail futures traders tend to act as contrarians, going long when prices drop and shorting when they rise. The IFEC Hong Kong Retail Investor Study 2025 found that despite nine in ten surveyed investors trading stocks in the prior year, only 7% used explicit stop-loss strategies.
The CFTC retail futures trader report, published in November 2024, documented the contrarian tendencies of retail participants, finding that most go long when prices drop and short when they rise, a reactive pattern that pre-committed playbook rules are specifically designed to counteract.
That stop-loss figure tells you something important. The problem is not a lack of knowledge about risk management. It is the absence of any pre-committed structure that forces discipline before the emotional moment arrives, which is precisely what a well-maintained playbook provides.
The retirement rule and out-of-sample discipline
Keeping the archive honest requires a mechanism to remove what no longer works.
The Trader Strategy Roundtable practice is to retire a setup after roughly 30 trades if it shows negative expected value, rather than preserving it indefinitely because it is a favourite. The archive is a living system, not a permanent collection.
Trading expectancy, the mathematical relationship between win rate, average win size, and average loss size, is the metric that a mature archive makes measurable for the first time; without a logged sample of at least 30 trades in a given setup, any expectancy figure is statistically unreliable.
Out-of-sample validation is the second safeguard. After building a setup from historical examples, test it on a later period it was not built on before you treat it as a live candidate. If the edge survives data it has never seen, it is more likely to be real.
Starting your archive this week, not next quarter
You do not need a larger trade history to begin. You need one weekend of structured review.
Your minimum viable archive is 20 annotated chart screenshots, organised by setup type. Each one carries a written note on the trigger condition, the stop level, the target, and the outcome. That is the whole starting point, before any specialist tooling enters the picture.
Reading chart structure accurately is the prerequisite skill the archive depends on: candlestick formats reveal open, high, low, and close relationships that a line chart hides entirely, and volume confirms whether a price move had genuine market participation behind it rather than thin-market noise.
The independent equivalent of the SMB Capital weekend habit is modest. Allocate one to two hours per week outside market hours to review setups you traded and ones you only watched, write a one-paragraph note on each, and file them by setup type.
Then grade them. Borrowing the FXFoundations framework, give each logged setup a grade from A to F based on how well it met your pre-defined entry criteria, not on whether it made money.
Here is the five-step process:
- Choose a note tool, Notion or Evernote
- Review the past week’s best setups, whether you traded them or not
- Screenshot and annotate each with trigger, stop, target, and outcome
- Grade each on process quality using A to F
- File by setup type rather than by date
The evaluation standard Grade on process quality, not outcome. A losing trade executed perfectly is more valuable to your development than a winning trade taken impulsively.
That grading principle is the mindset shift that makes the whole method work. SignalPilot’s recommended 20-trade library gives you an independently validated threshold to aim for, and the 38% versus 19% profitability gap is the reason to start now rather than wait.
Building the habit that separates consistent traders from perpetual beginners
The archive is not a project you finish. It is an asset you compound.
Professional desk traders have structured study time built into their development path. As an independent trader, you have to create that structure yourself, but the outcome difference is large enough to justify it: profitability of 5% to 15% for typical active traders against 30% to 40% for consistent journalers.
The structural odds facing retail traders explain why the profitability gap between daily journalers and non-journalers is so large: SPIVA data show 85-90% of actively managed funds underperform their benchmark over 15-year periods, and the information and cost disadvantages retail participants face are greater still.
Each setup you log improves the quality of your next decision. The pattern library grows richer and more discriminating over time, which is why the archive becomes more valuable the longer you maintain it.
The SMB Capital trader spent two years of weekends building his fluency. Meaningful archives take months, not sessions, to build, and that is the honest timeframe to hold in mind.
The compounding payoff Traders who journal losses and build pattern libraries improve three to four times faster than those who simply move on after a loss.
The signal of a mature system is the retirement-and-replacement cycle. When you start retiring underperforming setups and swapping in higher-conviction patterns, the archive is doing its job. Starting this week with 20 screenshots is not a small step toward the system. It is the system beginning.
This article is for informational purposes only and should not be considered financial advice. Investors should conduct their own research and consult with financial professionals before making investment decisions. Past performance does not guarantee future results. Financial projections are subject to market conditions and various risk factors.