The US government now spends more than $1 trillion a year servicing its debt, and that figure is still rising. For anyone holding housing-related equities, that is not a distant fiscal headline. It is the force currently dismantling earnings estimates, breaking topping patterns, and rewriting balance sheet assumptions across the sector.
Treasury yields have been grinding higher for years, not weeks, pushed by structural forces that monetary policy cannot easily undo. As of 9 September 2026, the 30-year yield sat at 5.13%, and the long-duration ETF TLT traded near $81.57, well off its highs with no credible base beneath it.
The connection between weak sovereign bonds and damaged housing stocks is not speculation. It runs through mortgage rates, discount rates, margin compression, and builder guidance, and it is now clearly visible in charts and estimate revisions. This piece walks through each link, from the fiscal arithmetic driving Treasury supply to the specific stocks already pricing in the pain, plus the cases where the bearish thesis does not hold cleanly. By the time you finish, you will have a framework for judging how much more pressure housing equities face and which variables signal a genuine turn.
The fiscal math that explains why bonds cannot catch a bid
Start with the number that anchors everything else. As of early September 2026, total gross national debt stands at $40.10 trillion, split between $32.42 trillion held by the public and $7.68 trillion in intragovernmental holdings.
That debt does not sit quietly. The Congressional Budget Office (CBO) projects net interest outlays will hit $1.0 trillion in 2026, equal to 3.3% of gross domestic product.
The interest bill has crossed a threshold CBO projects $1.0 trillion in net interest outlays for 2026, roughly 3.3% of GDP. Interest is now competing with core government functions for the same dollars.
The pace confirms it. Through the first ten months of fiscal year 2026 (October 2025 to July 2026), interest outlays reached $963 billion, which works out to more than $3 billion every single day.
Now layer in the deficit. Persistent fiscal shortfalls, projected at roughly 6.4-6.6% of GDP for 2025-2026, force the Treasury to issue ever more coupon-bearing debt. Each new auction adds to the supply the market must absorb.
Here is where the trap closes. The buyer base for that supply is shrinking at the exact moment supply is climbing.
Foreign ownership of US Treasuries has fallen by nearly 20% since 2020. As foreign official demand retreats, a larger share of new debt must be absorbed by price-sensitive private investors, households and hedge funds who demand a higher yield to hold it.
That shift is the difference between a cyclical rate view and a structural one. If yields were only high because the Fed is restrictive, a rate cut would fix them. The declining foreign buyer base tells you something more permanent is happening: the market is repricing what it costs to lend to the US government, and that floor stays elevated regardless of Fed action.
The 30-year yield repricing that pushed the benchmark to 5.33% in August 2026 was accompanied by a simultaneous G10 sovereign sell-off, confirming that the pressure is not uniquely American and that no obvious flight-to-quality alternative exists to redirect institutional demand back toward Treasuries.
The long-term picture only reinforces it. CBO projects debt held by the public will climb from 101% to 120% of GDP by 2036, pushing interest costs toward 4.6% of GDP.
| Period | Debt Held by Public (% of GDP) | Net Interest Cost (% of GDP) |
|---|---|---|
| Current (2026) | 101% | 3.3% |
| CBO projection (2036) | 120% | 4.6% |
For investors in rate-sensitive equities, this is the governing thesis. The supply side, not the Fed, is setting the floor under yields.
When big ASX news breaks, our subscribers know first
How sovereign debt dynamics transmit into housing sector damage
Bond weakness does not stay in the bond market. It travels, and housing is where it lands hardest.
The chain is mechanical. Long-dated Treasury yields set the reference rate for the mortgage market, so the 6.5-7% mortgage environment is not an independent variable. It is a downstream consequence of what is happening in the sovereign bond market, with the 30-year fixed hovering around 6.75% in mid-2025.
Follow the links in order:
- Treasury yields rise as supply overwhelms a shrinking buyer base.
- Mortgage rates track those yields higher.
- Affordability falls as monthly payments climb.
- Existing homeowners refuse to sell and give up cheap loans, freezing resale supply.
- Buyers who must transact shift toward new builds.
- Builders cut prices and offer rate buydowns to close deals.
- Margins compress under the weight of those incentives.
- Analysts cut earnings estimates to reflect thinner margins.
- Stocks reprice to the new estimates.
The demand distortion in step four is what makes this cycle structurally different. Over 80% of current homeowners hold mortgage rates that are out-of-the-money by more than 100 basis points, meaning refinancing or moving would force them into a far costlier loan.
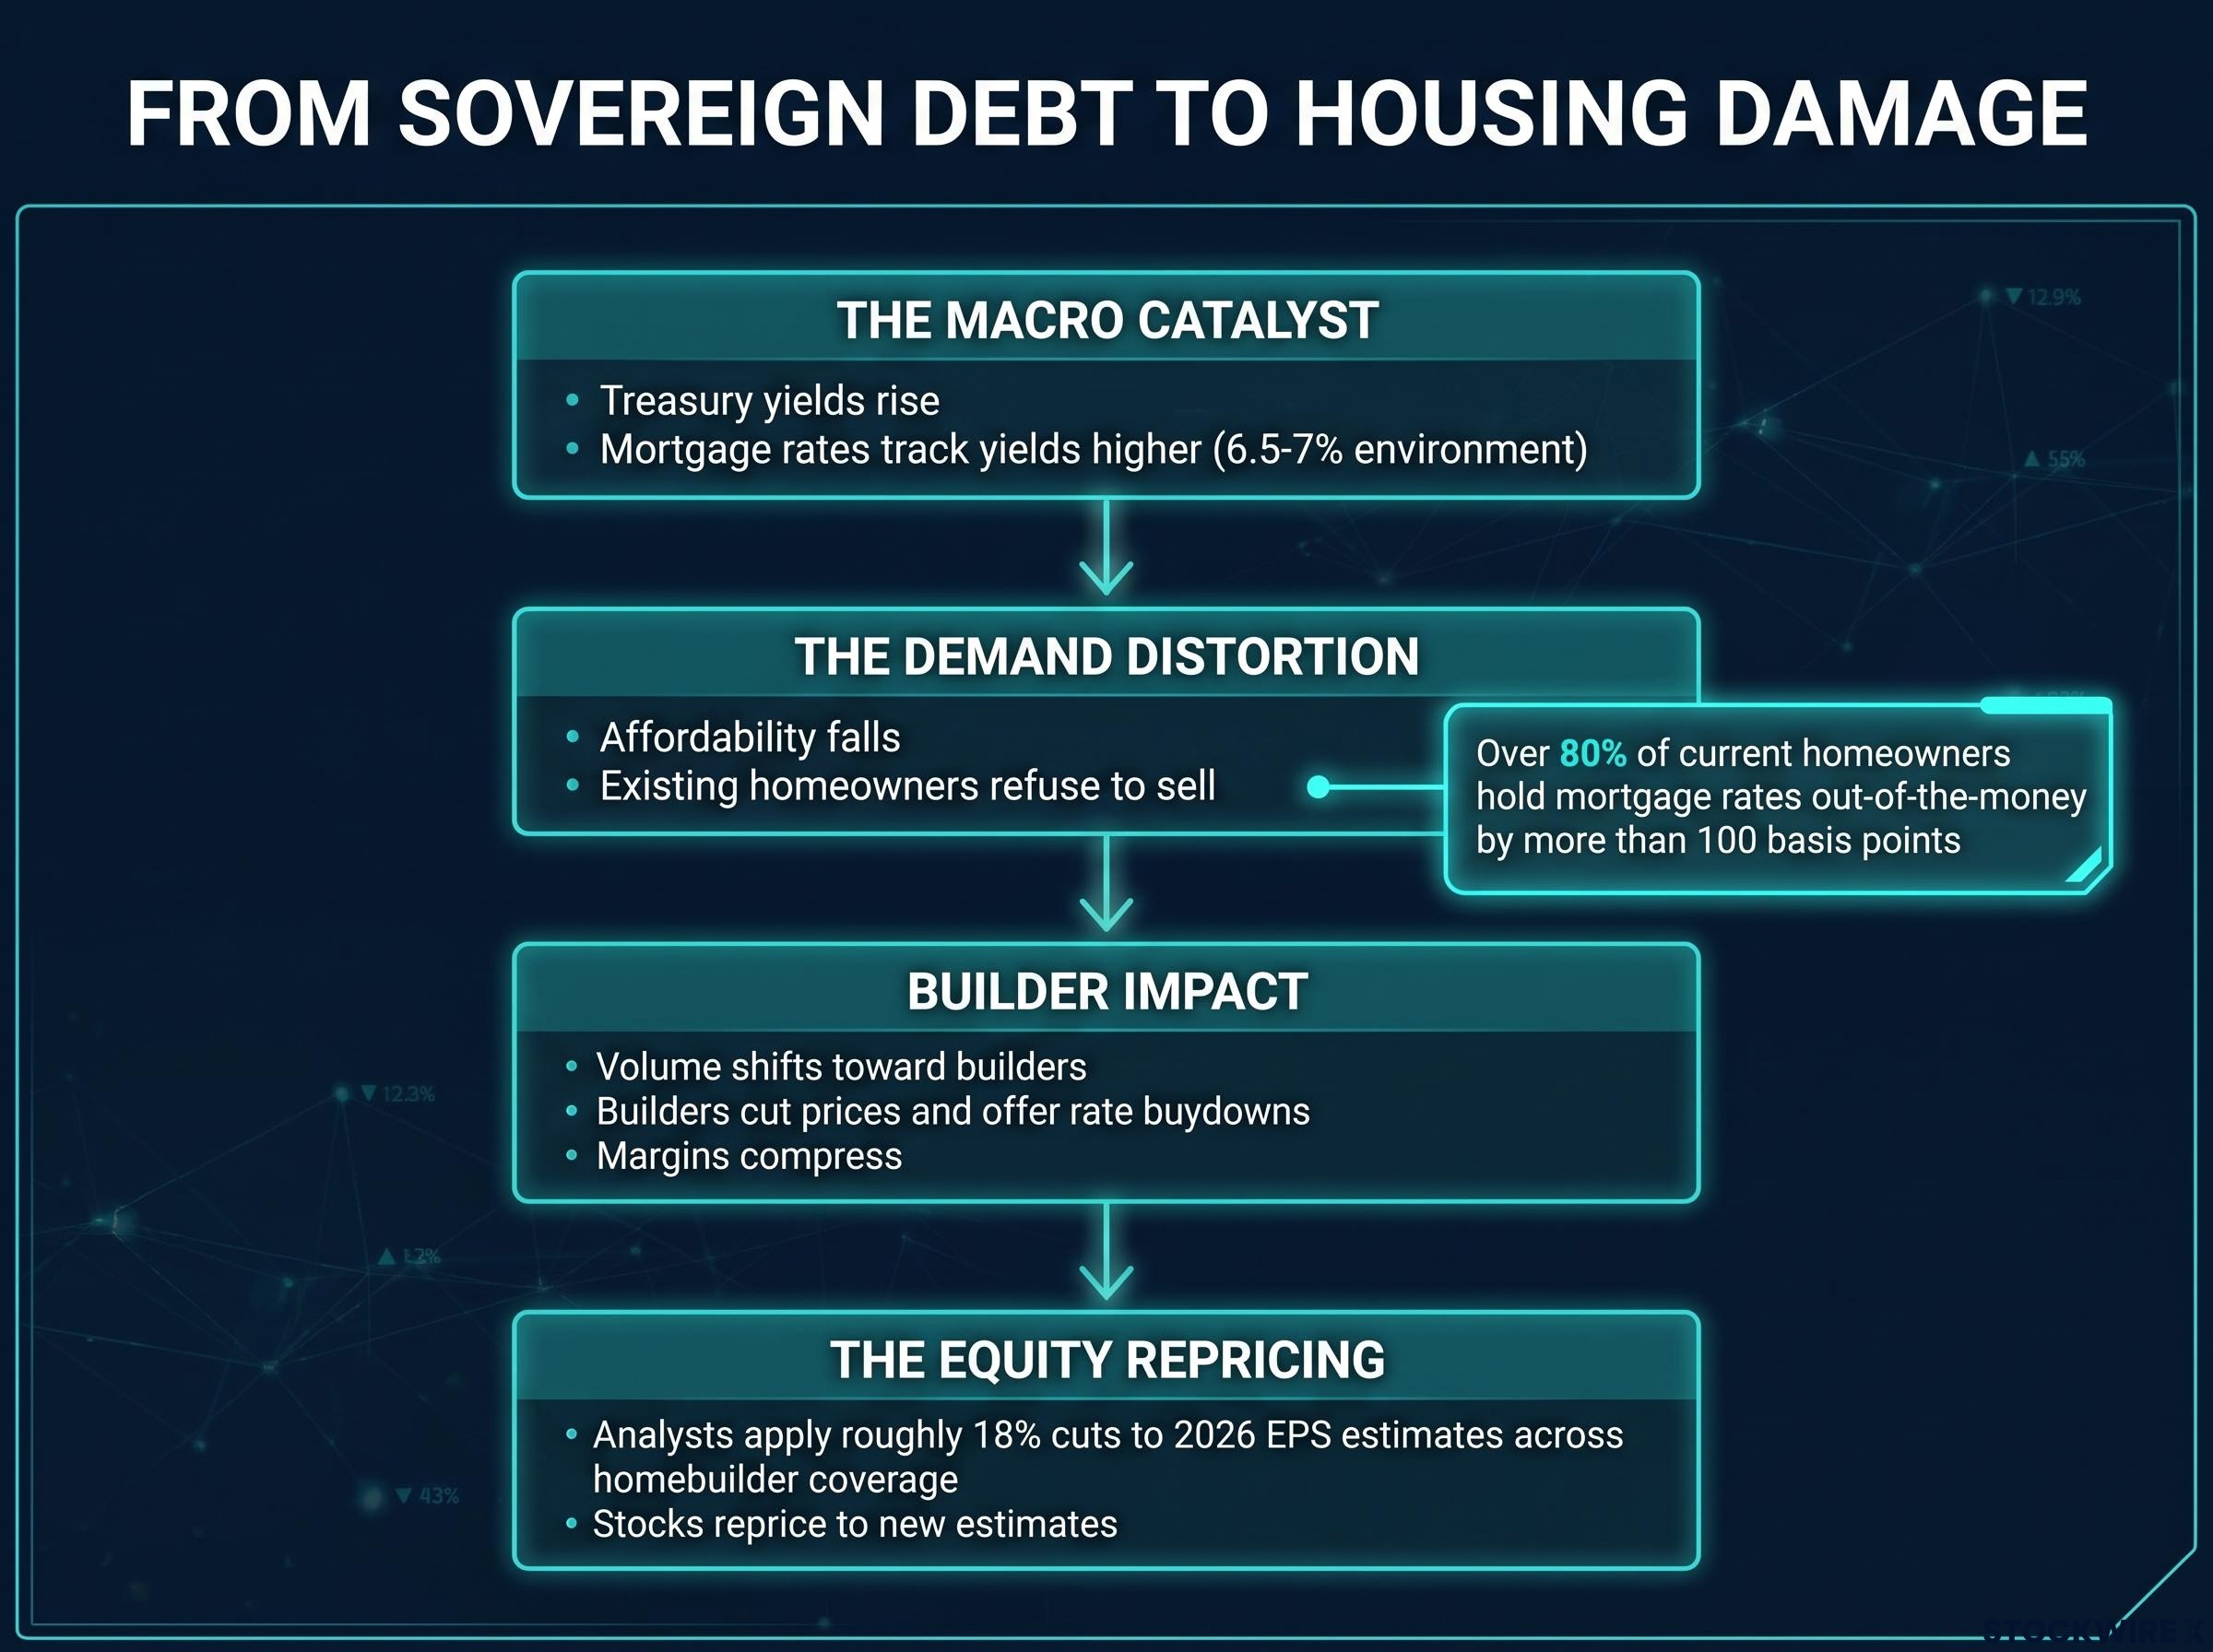
That lock-in effect pushes transaction volume toward builders, which sounds like good news for them. It is not, because the same rate environment forces those builders to buy the demand back with incentives.
From margin compression to earnings estimate cuts
Every buydown, closing-cost credit, and price reduction comes straight out of gross margin. This is the underappreciated part of the cycle: the damage is not only about weaker volumes, it is about the profitability of each sale eroding.
The quantified result is stark. Analysts have applied roughly 18% cuts to 2026 EPS estimates across homebuilder coverage universes.
That 18% figure is not a rounding error. It tells you that analyst models have fundamentally reset their earnings assumptions for the sector, which means some current stock prices are still anchored to projections that no longer exist.
Coverage of homebuilder earnings estimate cuts in 2026 shows the pattern is broad-based rather than confined to one or two companies, with KB Home flagged as carrying the largest negative EPS revision across the sector, reinforcing that analyst models have reset assumptions industry-wide rather than for isolated outliers.
The market is already sensing it. Through 30 June 2026, the S&P Composite 1500 Homebuilding Index rose about 6%, lagging the S&P 500’s roughly 9% gain over the same window. That underperformance is partly the market pricing in the risk that estimates have further to fall.
Where the breakdown is showing up in specific stocks and ETFs
The thesis stops being abstract when you look at individual charts. The same force is acting across different companies at the same time, and the price action confirms it.
Floor & Decor (FND) shows it clearly. The flooring retailer has broken sharply away from a rounded top formation and now trades in the high $40s, around $47.50 to $50, against a 52-week range of $42.64 to $92.41. A stock trading near the bottom of that range has already surrendered most of its prior gains.
Lennar (LEN) tells a similar story with a cautionary note attached. The homebuilder formed a large, long-term top and has gradually broken down from neckline support near $100 to around $80.49 to $80.76.
The original analysis cites a downside target near $30 within a year. Treat that as a stress scenario rather than a base case, because Lennar’s established 52-week low sits far higher, between $79.77 and $141.84, making a $30 print look extreme. What matters is simpler: once a stock breaks its neckline, the burden of proof shifts to the bulls.
The pressure extends across the group. D.R. Horton (DHI) and Smith Douglas Homes (SDHC) have faced analyst downgrades citing higher mortgage rates and declining return on equity, while Toll Brothers (TOL) delivered the clearest corporate confirmation of the macro thesis.
Named corporate confirmation Toll Brothers publicly warned that high rates are crushing demand, a statement that triggered weakness across builder stocks and validated the transmission chain from the company side, not just the chart side.
| Company | Ticker | Recent Price Level | Pattern or Development |
|---|---|---|---|
| Floor & Decor | FND | $47.50-$50 | Broke sharply from a rounded top; near 52-week low |
| Lennar | LEN | $80.49-$80.76 | Broke neckline support near $100 |
| D.R. Horton | DHI | Not specified in research | Downgraded on higher rates, declining ROE |
| Toll Brothers | TOL | Not specified in research | Public warning on demand destruction |
| ETFs: ITB, XHB, VNQ | – | – | Sector-level proxies; see divergence below |
What the ETF divergence between homebuilders and REITs tells you
The exchange-traded funds add a second layer of information. Homebuilder ETFs like ITB and XHB carry operational exposure to housing transaction volume, so their fortunes track demand for new homes.
REIT funds like VNQ and RWX carry a different exposure entirely: their balance sheets are sensitive to financing costs. When mortgage rates neared 7%, ITB and XHB saw sessions where they jumped over 3%, classic short-covering volatility inside a downtrend, while VNQ and RWX stayed largely flat because their pain runs through debt, not transactions.
The divergence sharpens the read. In 2026, REITs have generally outperformed even as the 10-year yield climbed from 4.2% to 4.6%, helped by strong logistics and data-centre fundamentals and by conservative, long-dated fixed-rate debt that insulates their balance sheets. Structure and subsector matter more than the rate headline alone, which tells you not to treat every rate-sensitive name as a single trade.
The REIT valuation channels that explain the ITB/VNQ divergence operate through four distinct mechanics: the economic outlook signal, the discount rate effect on future cash flows, the cost of capital for debt financing, and yield competition with government bonds, making sub-sector structure the decisive variable when the rate headline moves uniformly.
The counterargument: where the bearish rate thesis could be wrong
A one-sided case is a weak case, and there is a credible argument for yield relief that deserves a fair hearing.
Several bond strategists expect slowing growth and Federal Reserve rate cuts to pull the 10-year yield lower. A Reuters poll of over 50 bond strategists in April 2025 projected the 10-year falling to a median 4.21% by end-June and 4.14% within a year.
The forecast dispersion is real, not manufactured for balance.
The forecast spread is wide One camp sees the 10-year yield at 4.14% within a year. One major bank raised its end-2026 forecast to 4.65%. That gap is genuine uncertainty, not consensus.
The Treasury also holds tactical tools. It has leaned more heavily on short-term bills to ease long-end supply pressure, and it doubled the maximum size of its long-term buyback operations to at least $4 billion per operation for 10- to 30-year securities. On announcement, the 30-year yield fell roughly 10 basis points.
Here is the qualification. A 10-basis-point move against a backdrop of $40 trillion in debt is a delay mechanism, not a structural fix. The Treasury can smooth the curve for a quarter; it cannot repeal the arithmetic.
On the equity side, the damage is concentrated rather than universal. Some industry indices lost roughly 17.2% over the prior year, yet not every builder is equally exposed.
The yield relief thesis holds under specific conditions:
- The Fed delivers rate cuts on the expected timeline.
- Treasury supply management genuinely flattens the curve rather than just delaying pressure.
- Inflation expectations reset lower and stay there.
The structural bear case sustains when those conditions fail and coupon issuance keeps climbing into a thin buyer base.
Within housing, the resilient end is identifiable. According to Zacks Investment Research, some homebuilders are positioned for a cautious rebound in 2026 on incremental inventory growth and improved buyer confidence, and entry-level or quick-move-in builders in high-demand regions retain the incentive flexibility to defend margins. Knowing where the bull case is legitimate keeps you from writing off the whole sector when the distress is actually differentiated.
For investors wanting to stress-test how far housing damage can spread before it reaches the broader economy, our full explainer on housing sector decoupling examines why a direct GDP contribution now in the low single digits limits the sector’s capacity to drag the US into contraction even as builder volumes deteriorate.
Reading the next move in a market where the debt math does not resolve
Pull the chain together and the framework is coherent. Fiscal deficits force issuance, issuance meets a shrinking buyer base, yields hold a higher floor, mortgage rates follow, builder margins compress, estimates fall, and stocks reprice. Each link reinforces the next.
The baseline against which any relief scenario must be judged is concrete. As of 9 September 2026, the 10-year yield sits at 4.63% and the 30-year at 5.13%, with TLT at $81.57 as a tradeable proxy for the structural thesis.
There is one genuine timing wrinkle. The research cites a roughly 55-weekday pre-election window where government support for bond and equity markets may intensify, with that motivation fading once the election passes.
Understand what that window is and is not. Any relief produced by political motivation before the election is borrowed from the post-election adjustment that follows. It is a timing consideration, not a structural one, and the CBO’s projection of debt reaching 120% of GDP by 2036 reasserts itself regardless of near-term tactics.
Four variables that will tell you whether this is a pause or a turn
- The 10-year yield level. A sustained break below 4.3% on genuine volume would challenge the structural bear thesis. A grind back toward the 4.5-5% zone reinforces it.
- CBO deficit projections and legislative budget changes. A deficit widening beyond 7% of GDP would deepen the supply problem. Credible fiscal tightening would ease it.
- The Fed’s rate-cut pace and forward guidance. Faster cuts with dovish guidance support the relief case. A cautious, data-dependent Fed leaves the structural floor intact.
- Treasury issuance composition. A continued tilt toward short-term bills can smooth the long end temporarily. A pivot back toward heavy coupon issuance signals renewed pressure.
The burden of proof lies with any bullish scenario, though tactical relief trades can still develop in specific corners of the sector. Watch these four signals to tell a genuine inflection from a relief rally that simply re-establishes the entry point for the structural thesis.
This article is for informational purposes only and should not be considered financial advice. Investors should conduct their own research and consult with financial professionals before making investment decisions.
Past performance does not guarantee future results. Financial projections are subject to market conditions and various risk factors. These statements are speculative and subject to change based on market developments and company performance.