
Why Most Wealth-Building Strategies Aren’t Built for You
4 hrs ago
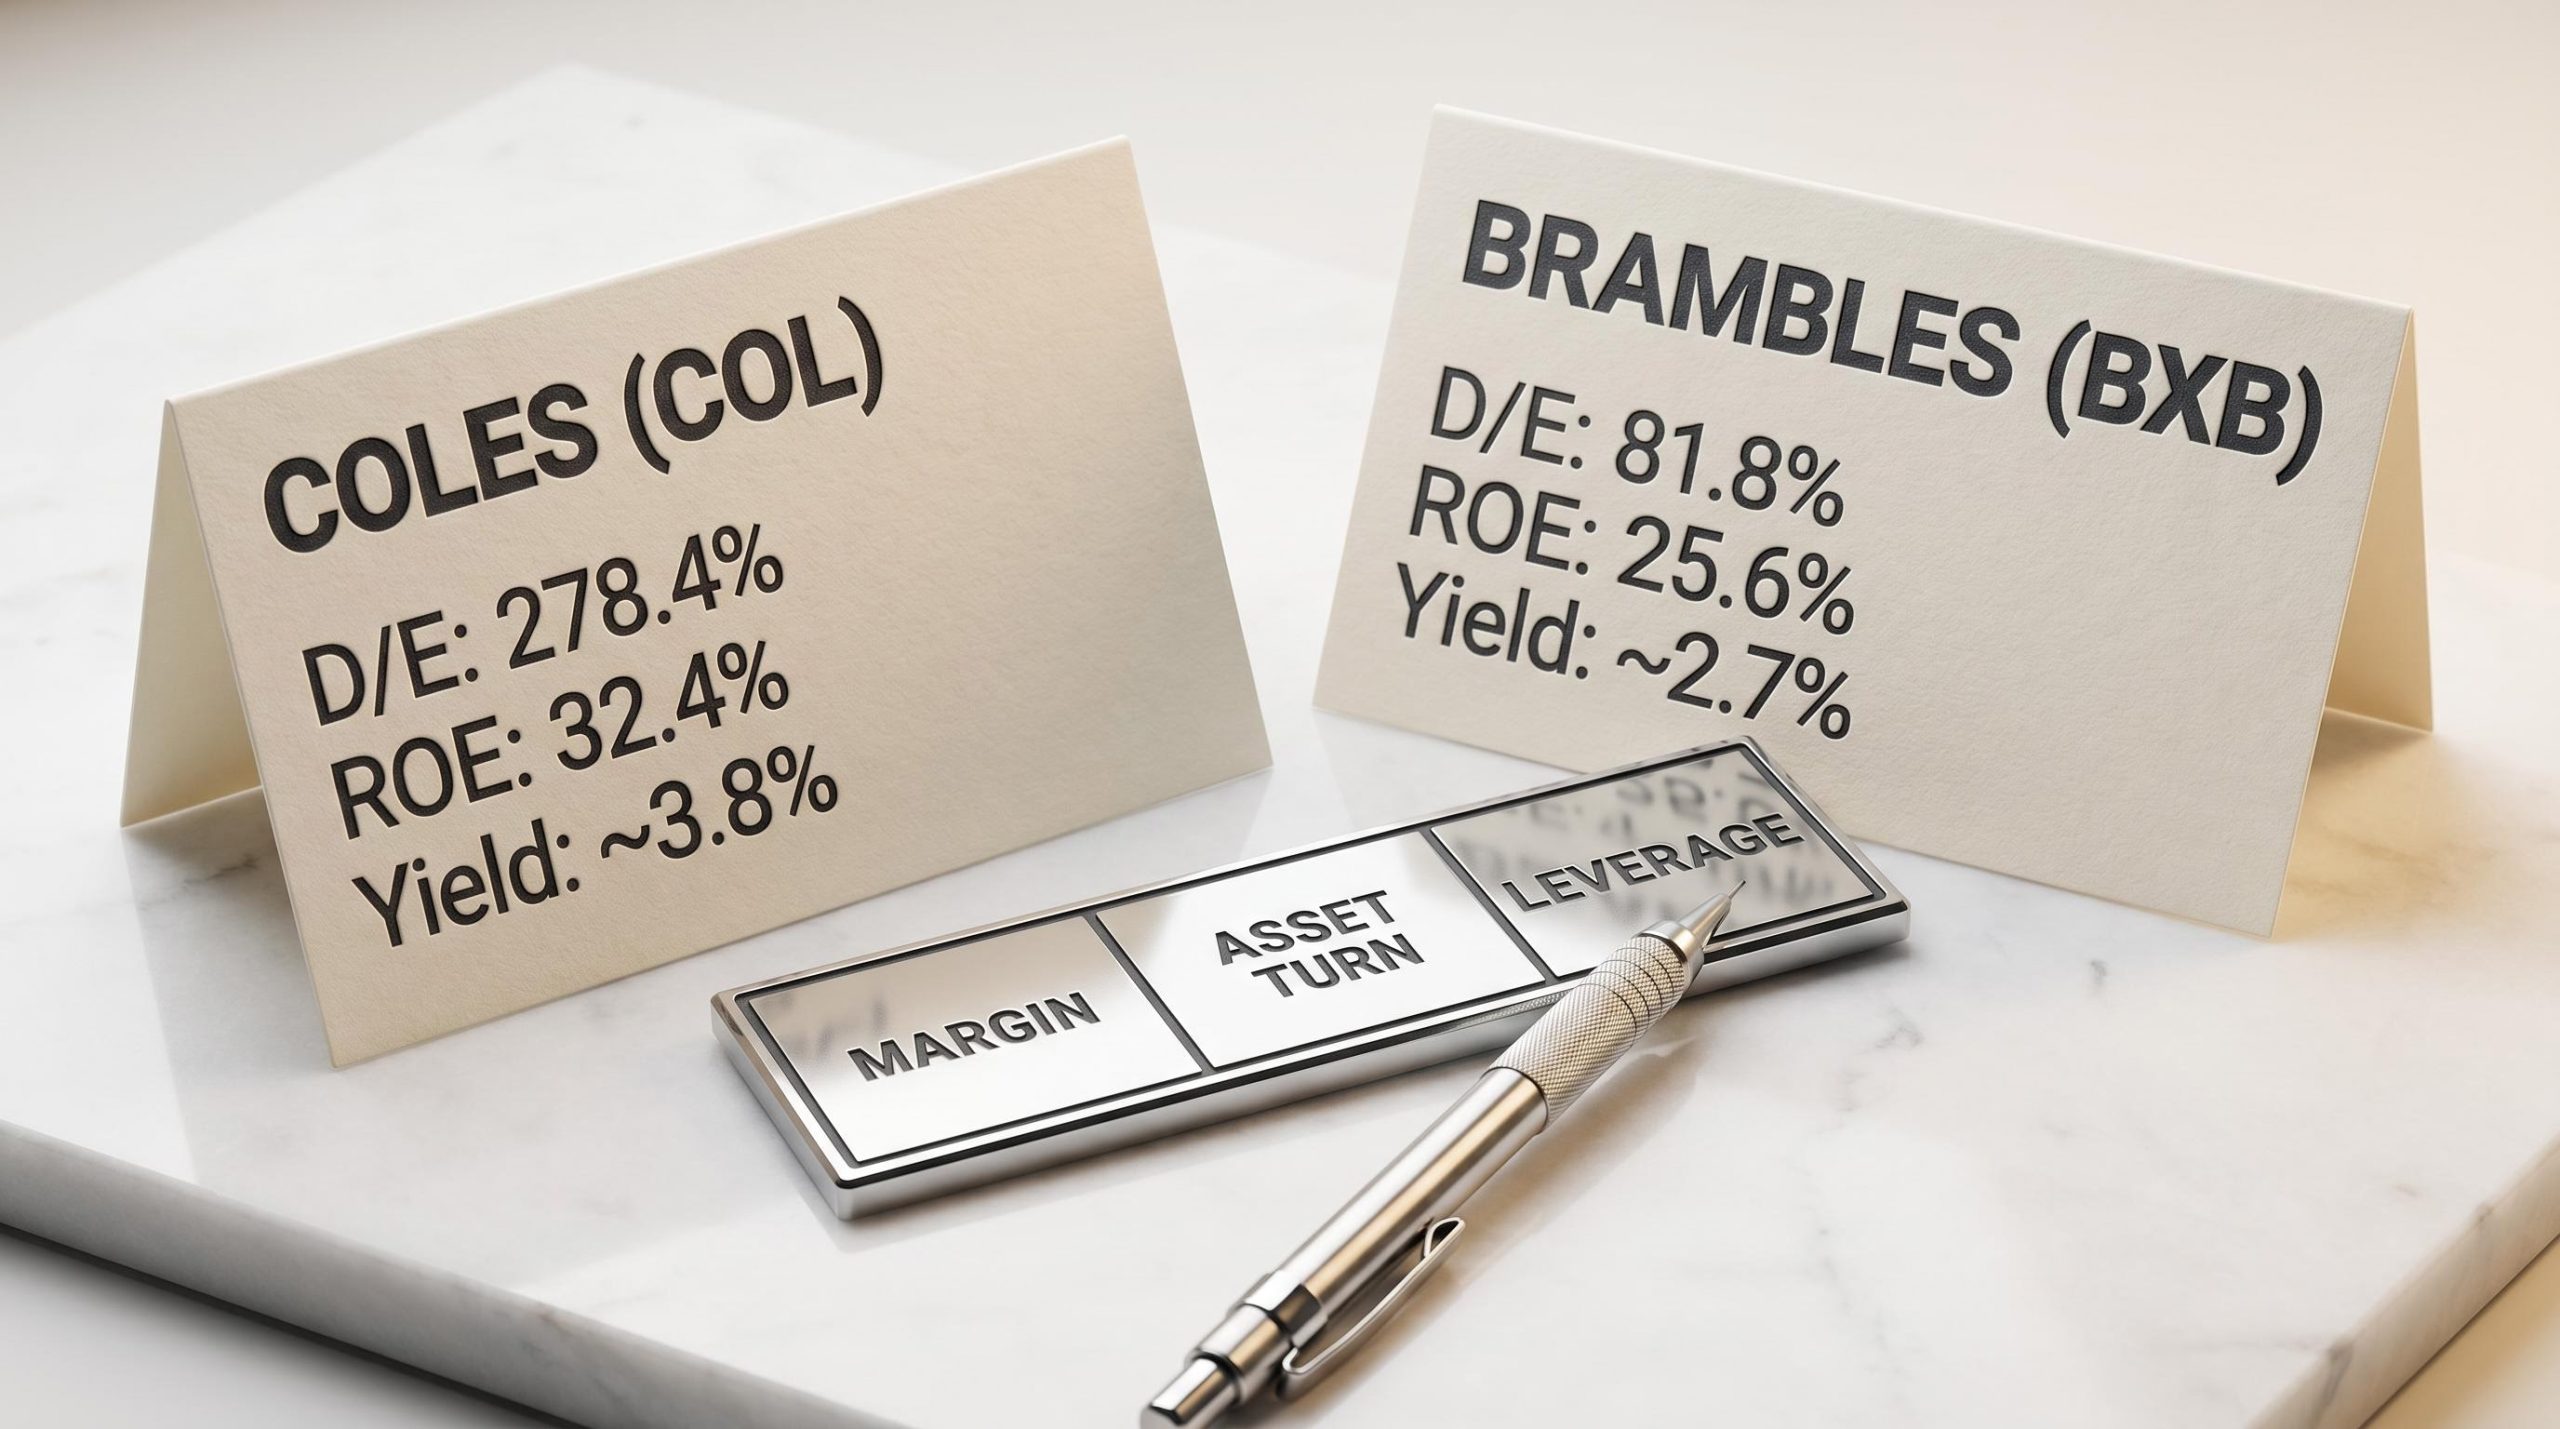
Coles reported a return on equity of 32.4% in FY24. On the surface, that figure looks exceptional for a mature supermarket operator. But Coles also carries a debt-to-equity ratio of 278.4%, and that single detail fundamentally changes what the ROE number actually signals about the business. Both Coles (ASX: COL) and Brambles (ASX: BXB) sit on many Australian investors’ watchlists as mature, blue-chip holdings with long operating histories, predictable cashflows, and regular dividends. Yet their financial profiles look strikingly different when examined side by side. This guide uses both companies as concrete case studies to teach readers how to interpret three core financial metrics: debt-to-equity ratio, return on equity, and dividend yield. By the end, readers will know not just what the numbers are, but what questions to ask before drawing any conclusions from them.
The metrics that reveal quality in a high-growth technology stock are not the same ones that matter for a mature, dividend-paying blue-chip. Revenue momentum and addressable market opportunity dominate the conversation around growth-stage companies. For established businesses, the questions shift: how efficiently is capital being deployed, how sustainable is the debt structure, and how reliable is the income stream?
Conflating the two frameworks leads retail investors to misread perfectly healthy balance sheets as warning signs, or to miss genuine risks hiding behind impressive-looking numbers. For ASX blue-chips like supermarket operators and global logistics companies, three metrics are particularly well-suited to this kind of assessment:
The five core fundamental analysis metrics, P/E ratio, earnings per share, revenue growth, profit margins, and return on equity, each answer a different question about the same business, and the discipline of reading them together rather than in isolation is the same logic that makes the three-metric framework in this article work.
Coles, founded in 1914 and independently listed on the ASX since 2018, holds approximately 28% of the Australian grocery market. Brambles operates a global pallet-pooling business through its CHEP brand across Asia-Pacific, the Americas, and EMEA, generating revenue from daily hire fees. Both remain prominent in analyst commentary as of May 2026. Their contrasting financial structures make them ideal case studies for understanding what these metrics actually reveal.
Debt-to-equity is calculated by dividing total liabilities by shareholders’ equity. A ratio above 100% means the company carries more debt than equity on its balance sheet. At 278.4%, Coles’ FY24 ratio sits well above that threshold. Brambles, by contrast, reported 81.8% in the same period.
The gap is substantial, but the number alone does not determine whether either company’s leverage is problematic. Two conditions make elevated leverage acceptable for a mature business: stable, predictable cashflows that cover interest obligations comfortably, and a business model that does not require sudden large capital raises to survive downturns. Grocery retailing, where consumer demand is non-discretionary, meets both conditions in most market environments.
Analyst consensus frames Coles’ leverage as higher than Woolworths and higher than most ASX consumer staples peers, but broadly manageable given cashflow predictability. The primary effect, according to commentary from brokers including Ord Minnett, is reduced financial optionality: less capacity for large share buybacks, aggressive acquisitions, or balance-sheet-funded expansion, rather than a threat to solvency or dividend capacity.
Brambles’ moderate leverage reflects a different capital allocation philosophy, balancing reinvestment in its global pallet pool with shareholder distributions.
| Metric | Coles (FY24) | Brambles (FY24) |
|---|---|---|
| Debt-to-Equity Ratio | 278.4% | 81.8% |
| Business Model Type | Defensive grocery retail | Global pallet pooling (logistics) |
| Cashflow Predictability | High (non-discretionary demand) | High (recurring daily hire fees) |
| Analyst Leverage Assessment | Elevated but manageable; constrains optionality | Moderate; supports balanced capital returns |
Elevated debt-to-equity is a risk signal in cyclical businesses and a manageable structural feature in defensive ones. The distinction depends on cashflow predictability and interest coverage, not on the ratio alone.
Return on equity is calculated by dividing net profit by shareholders’ equity. When a company has a small equity base, because it carries a lot of debt, even modest profits produce a high ROE percentage. That is exactly what makes ROE misleading in isolation.
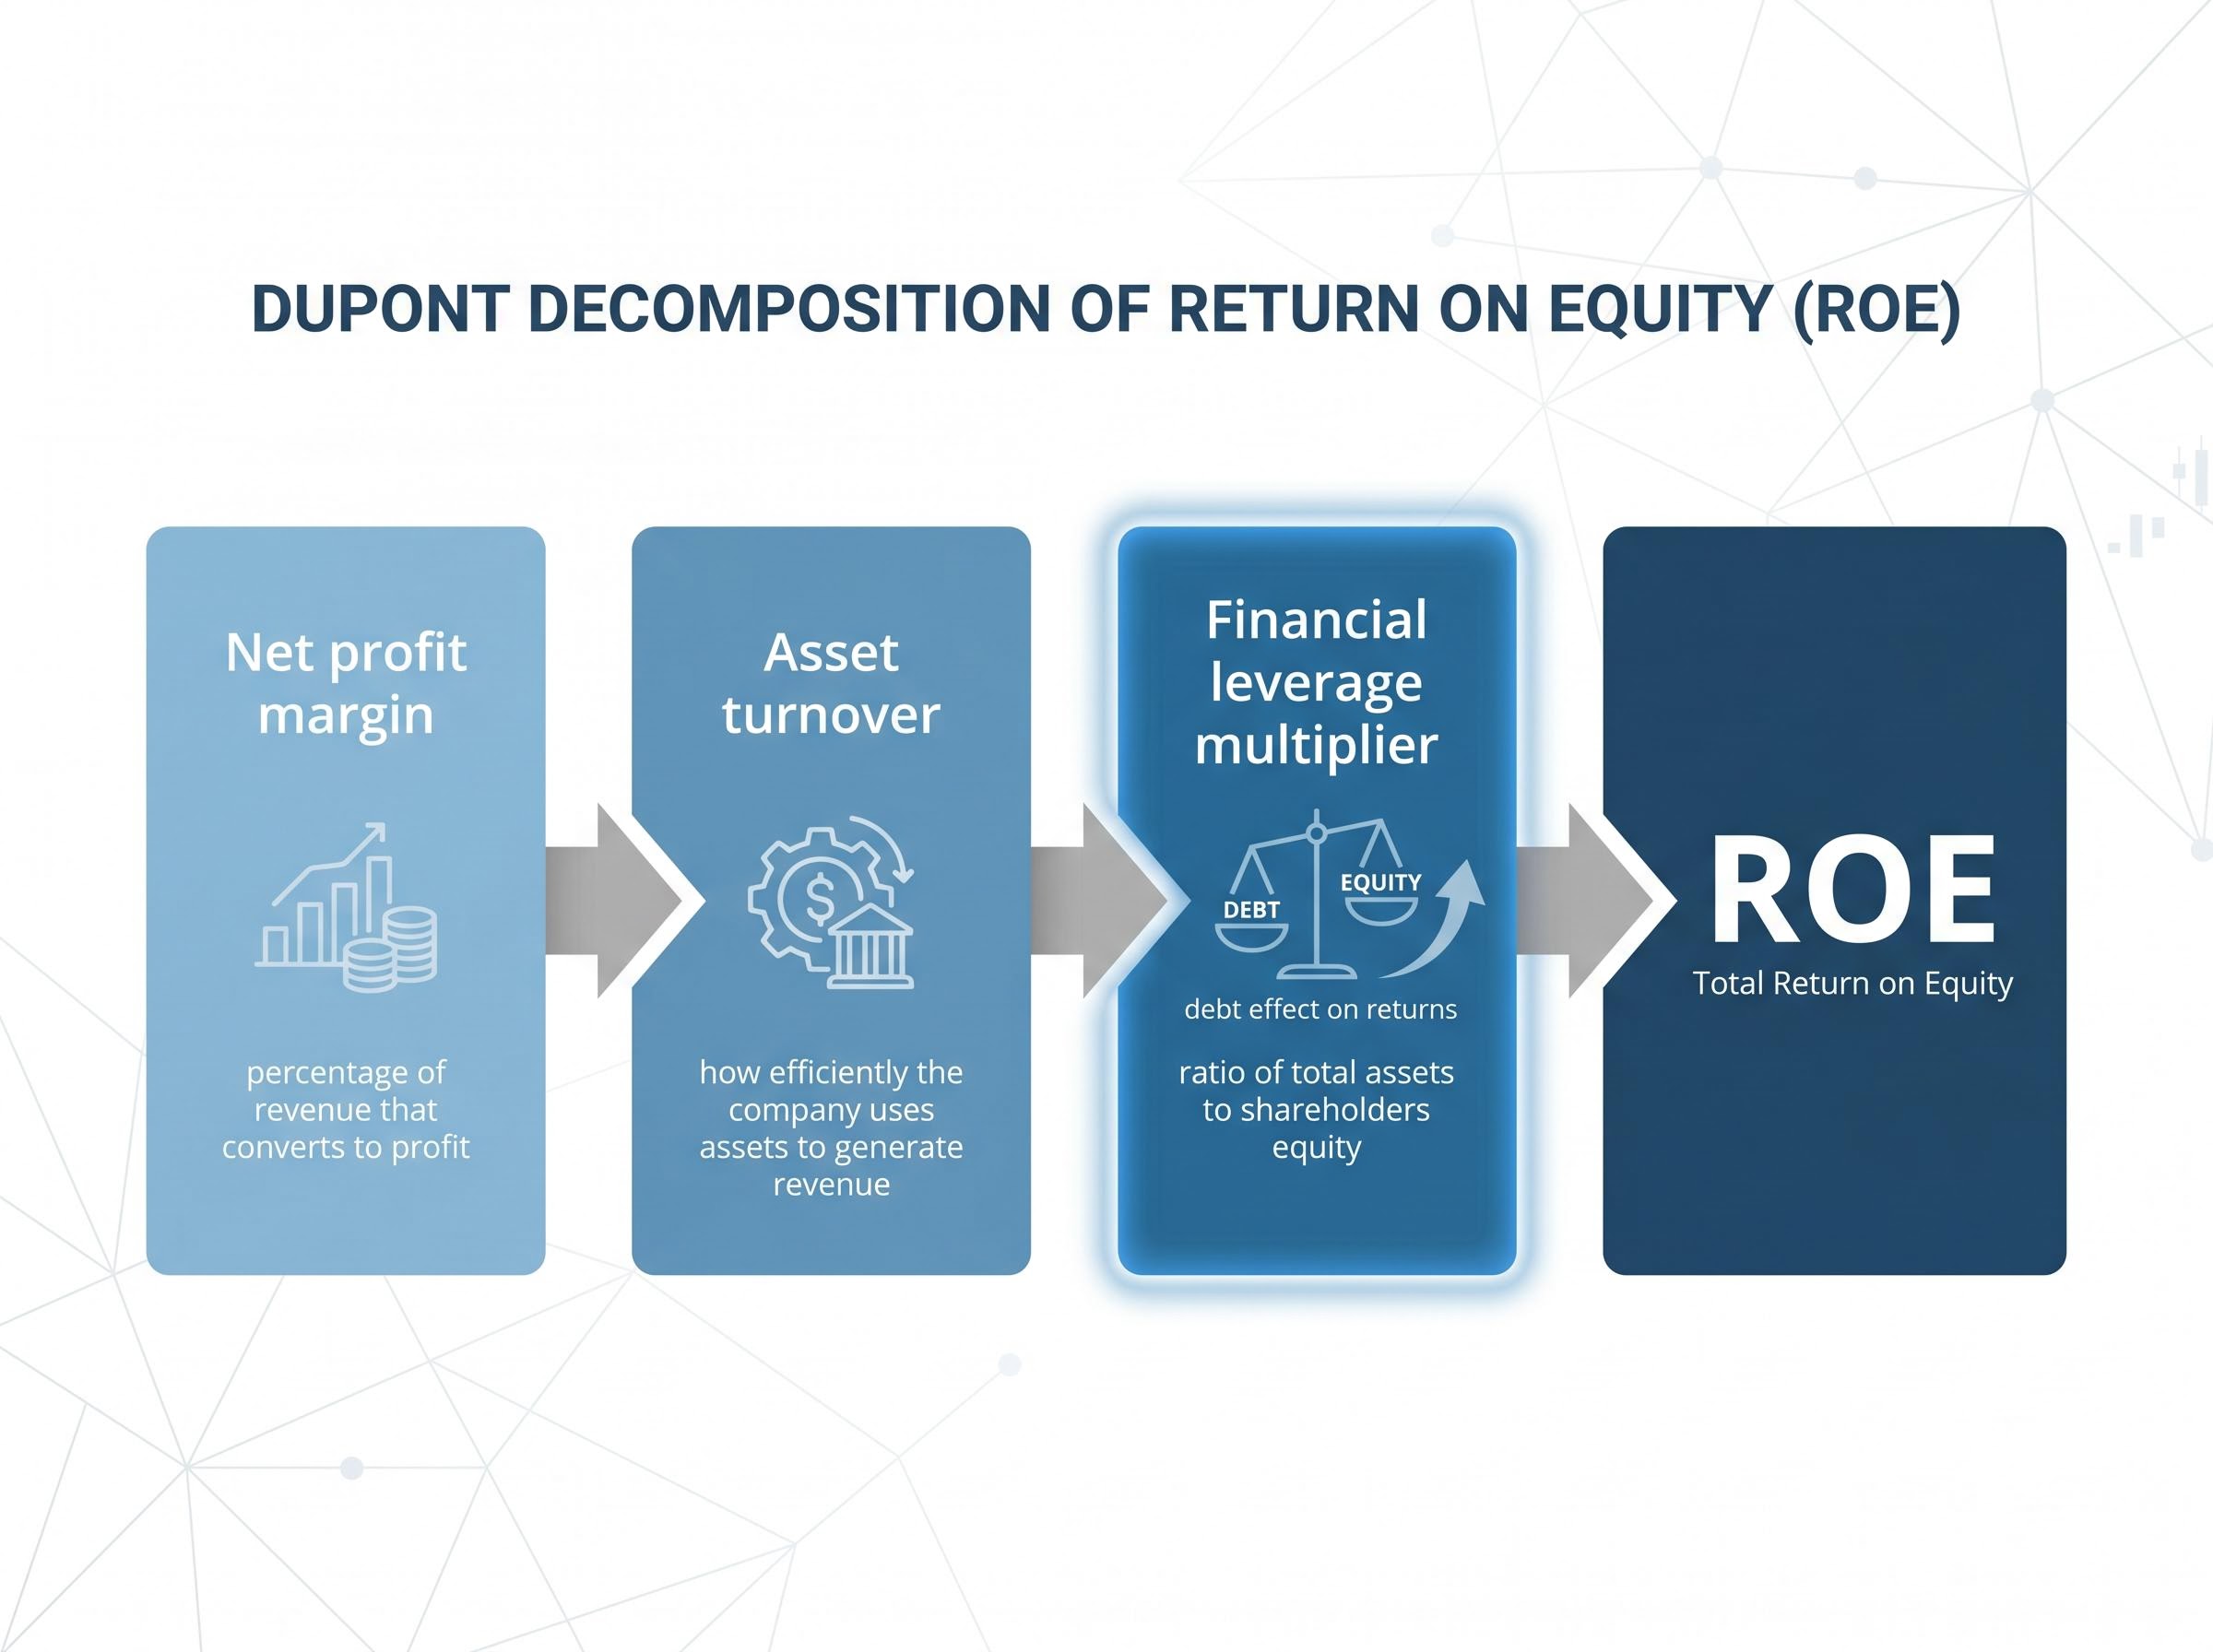
The standard framework for diagnosing what drives a high ROE is the DuPont decomposition. It breaks the single number into three components:
A high ROE driven primarily by the third component, the leverage multiplier, tells a different story from one driven by strong margins or efficient asset use. Supplementing ROE with Return on Assets (ROA) or Return on Invested Capital (ROIC) strips out the leverage effect and reveals the underlying operational quality of the business.
For mature retailers, banks, and infrastructure stocks on the ASX, high payout ratios and buybacks also reduce the equity base. This further inflates ROE independently of operational quality.
Coles reported an ROE of 32.4% in FY24, a figure that looks impressive against a general benchmark where mature businesses are considered strong above 10%. But this must be read alongside the 278.4% debt-to-equity ratio. A compressed equity base inflates the return calculation.
Brambles reported an ROE of 25.6% in the same period, achieved with considerably lower leverage at 81.8% debt-to-equity. That gap suggests a higher proportion of Brambles’ return is driven by operational performance, better margins and asset utilisation, rather than balance-sheet structure.
Investors comparing ROE across companies should always check ROA or ROIC before drawing conclusions about business quality. The DuPont framework transforms ROE from a single number into a diagnostic tool, helping distinguish between genuine operational strength and leverage amplification.
Dividend yield, calculated as annual dividend per share divided by share price, reflects both the income a stock generates and how the market is pricing the business at a given point in time. A rising yield can signal either higher dividends or a falling share price. These have very different implications for income investors.
Using average yield over multiple years smooths share price volatility and gives a better sense of the income a stock typically generates. Point-in-time yield, by contrast, can be distorted by short-term price moves that have little to do with the underlying dividend stream.
Coles’ five-year average annual dividend yield sits at approximately 3.8%, based on company filings and direct calculation. Brambles’ average annual dividend yield since 2019 is approximately 2.7%, reflecting a capital management programme that combines fully franked dividends with on-market share buybacks. Analysts have generally described Brambles’ approach as disciplined and balanced.
The importance of context is visible in recent price movements. BXB shares were trading approximately 17.9% below their 52-week high as of May 2026, which mechanically lifts the point-in-time yield reading without any change in the dividend itself. COL shares declined approximately 2.5% from the start of 2025 over the same period.
| Metric | Coles | Brambles |
|---|---|---|
| Average Dividend Yield | ~3.8% (5-year avg) | ~2.7% (since 2019) |
| Franking Status | Fully franked | Fully franked |
| Capital Management Approach | Dividends; limited buyback capacity | Dividends plus on-market share buybacks |
| Recent Share Price Context | ~2.5% decline from start of 2025 | ~17.9% below 52-week high |
A rising dividend yield is not always good news. It may reflect a declining share price rather than a growing dividend. Always check whether the yield increase is driven by the numerator (higher dividends) or the denominator (lower price).
The dividend mechanics that make yield calculations misleading in isolation include the ex-dividend price drop, which transfers existing equity value rather than creating new wealth, and the sector concentration effect, where high-yield portfolios systematically overweight Financials, Utilities, and Real Estate while underweighting Technology and Communications sectors that have led long-run market returns.
For Australian income investors, assessing yield sustainability matters more than chasing the highest number. A high yield funded by debt or by cutting reinvestment is less valuable than a moderate yield backed by reliable free cashflow.
None of these three metrics means much in isolation. High debt-to-equity compresses the equity base, which inflates ROE. Dividend yield needs to be assessed against payout sustainability, which is itself affected by leverage and cashflow. All three must be read together, and against business-model context.
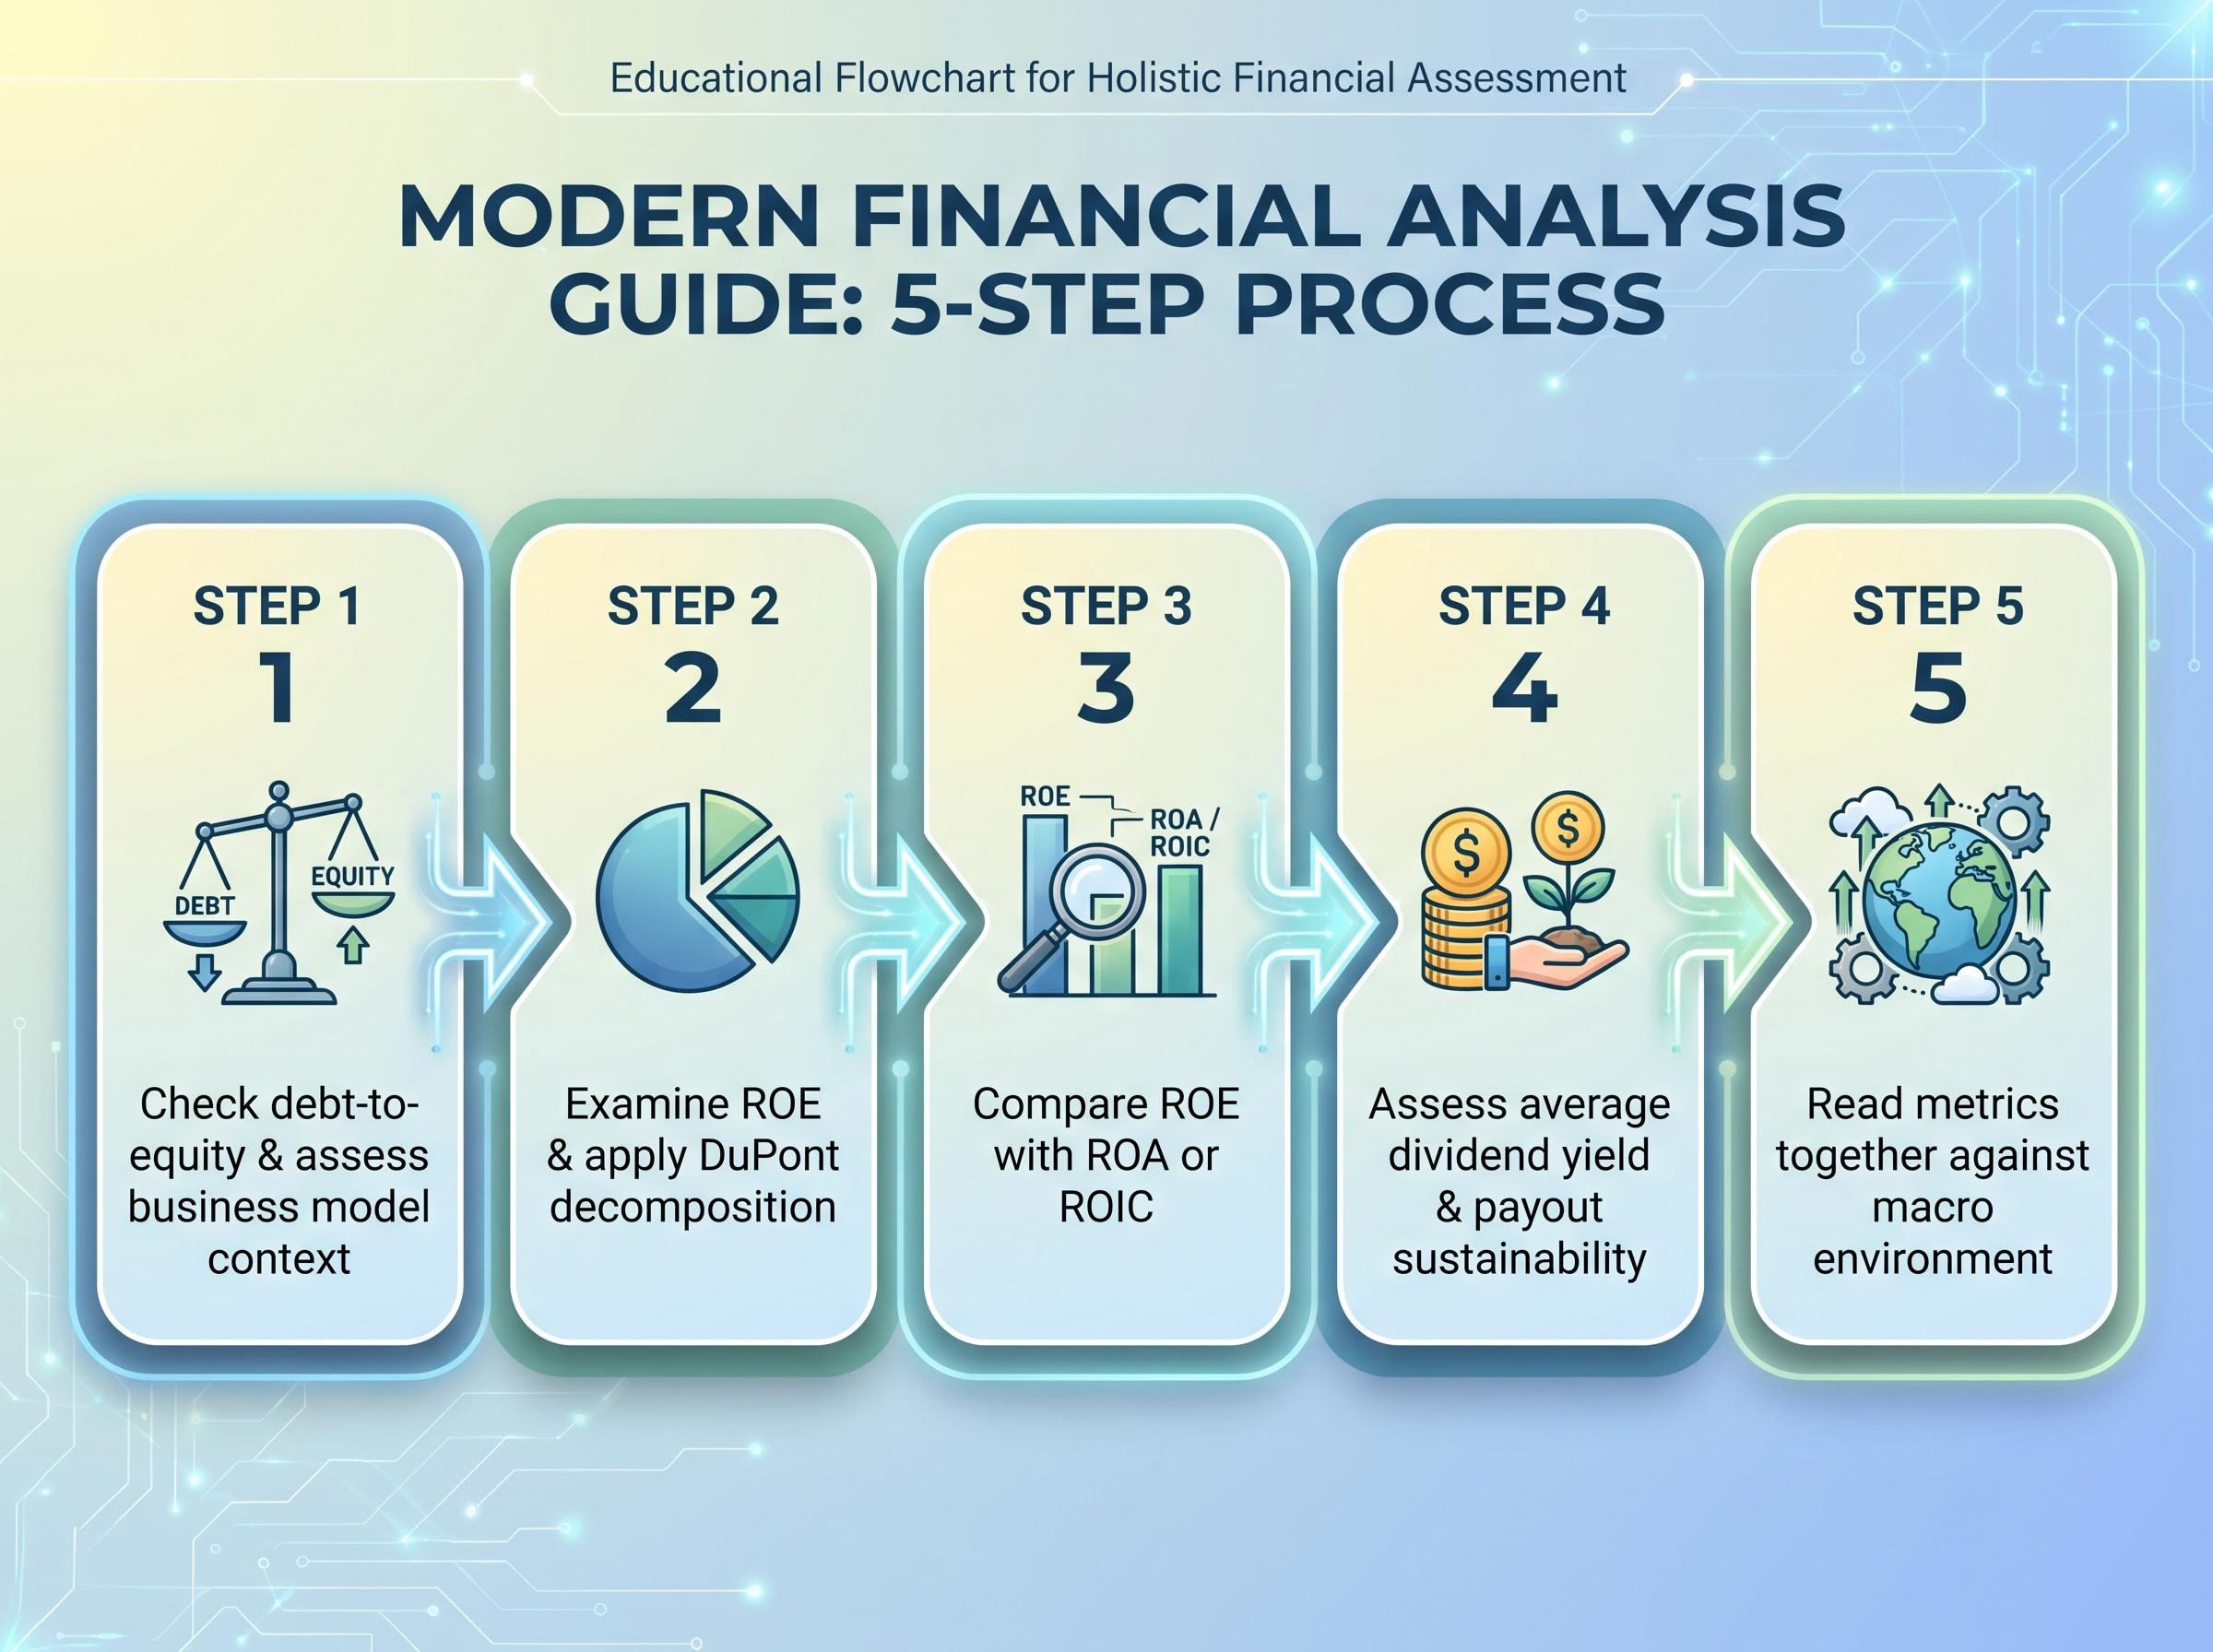
A repeatable diagnostic sequence for any ASX blue-chip looks like this:
The same three-metric sequence applied here to Coles and Brambles extends naturally to other blue-chip ASX stocks, and QBE Insurance demonstrates both the power and the limits of the framework when applied to a globally diversified insurer where partial franking and catastrophe-year volatility add additional interpretation layers.
The macro context matters for both stocks in 2025-2026. Elevated interest rates compress valuation multiples for yield-oriented defensive stocks while making the reliability of cashflow coverage more important for highly leveraged companies.
Coles’ combined profile, a debt-to-equity ratio of 278.4%, ROE of 32.4% (partly leverage-driven), and a five-year average yield of 3.8%, paints a picture of a defensive income stock whose impressive ROE carries a structural explanation. Supermarket margins face ongoing pressure from cost-of-living dynamics, competition from Woolworths, Aldi, and Costco, and regulatory scrutiny of pricing practices.
The ACCC supermarkets inquiry 2024-25 examined pricing practices and competitive dynamics across the Australian grocery sector, establishing a regulatory backdrop that directly bears on how analysts assess margin sustainability and pricing power for both Coles and Woolworths.
Brambles’ profile, with 81.8% debt-to-equity, 25.6% ROE (more operationally driven), and an average yield of 2.7% since 2019, suggests a business generating strong returns with less reliance on leverage. Earnings growth is moderating from the post-pandemic peak but remains positive, and the reusable pallet model carries ESG tailwinds as sustainability regulation tightens.
Neither profile is automatically better. The goal of this kind of analysis is not to reach a verdict but to ask better questions about what the numbers reveal.
Debt-to-equity, ROE, and dividend yield are starting-point filters. They narrow the field and surface the right questions, but they do not substitute for deeper analysis of earnings quality, competitive position, and valuation.
After running this three-metric check, the natural next steps include:
Precise forward-looking ROE projections and broker-level earnings models sit behind paywalls. Retail investors should treat their own metric analysis as a screening tool that identifies candidates for deeper research, not a substitute for it.
For readers who are earlier in their journey and want to start investing in Australia before working through analytical frameworks like DuPont decomposition, our dedicated guide to building investment habits covers realistic first-year expectations, compounding mechanics, and the free tools available through ASIC MoneySmart and the ASX Education platform.
This article is for informational purposes only and should not be considered financial advice. Investors should conduct their own research and consult with financial professionals before making investment decisions.
Financial metrics are interpretive tools, not verdicts. Their value lies in the questions they prompt rather than the answers they appear to give. Coles illustrates how a high ROE can coexist with elevated leverage in a defensive business, rewarding the investor who looks beneath the surface. Brambles illustrates that a moderately lower ROE achieved under lower leverage can reflect stronger underlying operational quality.
The framework covered here, debt-to-equity for balance-sheet context, DuPont-decomposed ROE for return quality, and average dividend yield for income sustainability, applies to any mature ASX holding. Identify one blue-chip on your own watchlist and run the three-metric check as a first analytical step.
Further guides on ASX financial analysis are available on the site. Before making investment decisions based on publicly available metrics alone, consulting a licensed financial adviser is advisable.
The debt-to-equity ratio is calculated by dividing total liabilities by shareholders' equity, and it reveals how much of a company's funding comes from debt relative to shareholder equity. A high ratio signals elevated financial risk in cyclical businesses but can be manageable in defensive ones with stable, predictable cashflows.
Return on equity is calculated by dividing net profit by shareholders' equity, so when a company carries significant debt, its equity base shrinks and even modest profits produce a high ROE percentage. Investors should use DuPont decomposition or compare ROE with return on assets to determine whether the result reflects genuine operational strength or simply leverage amplification.
The DuPont framework breaks ROE into three components: net profit margin, asset turnover, and the financial leverage multiplier. By identifying which component is driving a high ROE, investors can distinguish between companies generating returns through strong margins and efficiency versus those relying on elevated debt levels.
Point-in-time dividend yield reflects the current share price and can be distorted by short-term price movements unrelated to the dividend itself, while average yield calculated over multiple years smooths volatility and provides a more reliable picture of the income a stock typically generates. A rising yield caused by a falling share price has very different implications from one caused by a growing dividend.
After running the three-metric check, investors should examine interest coverage to stress-test debt serviceability, free cashflow to confirm the dividend is not funded by borrowings, price-to-earnings ratio relative to sector peers, and management's stated capital allocation priorities. Qualitative factors such as regulatory scrutiny, competition, and wage inflation also sit outside what these metrics alone can capture.


