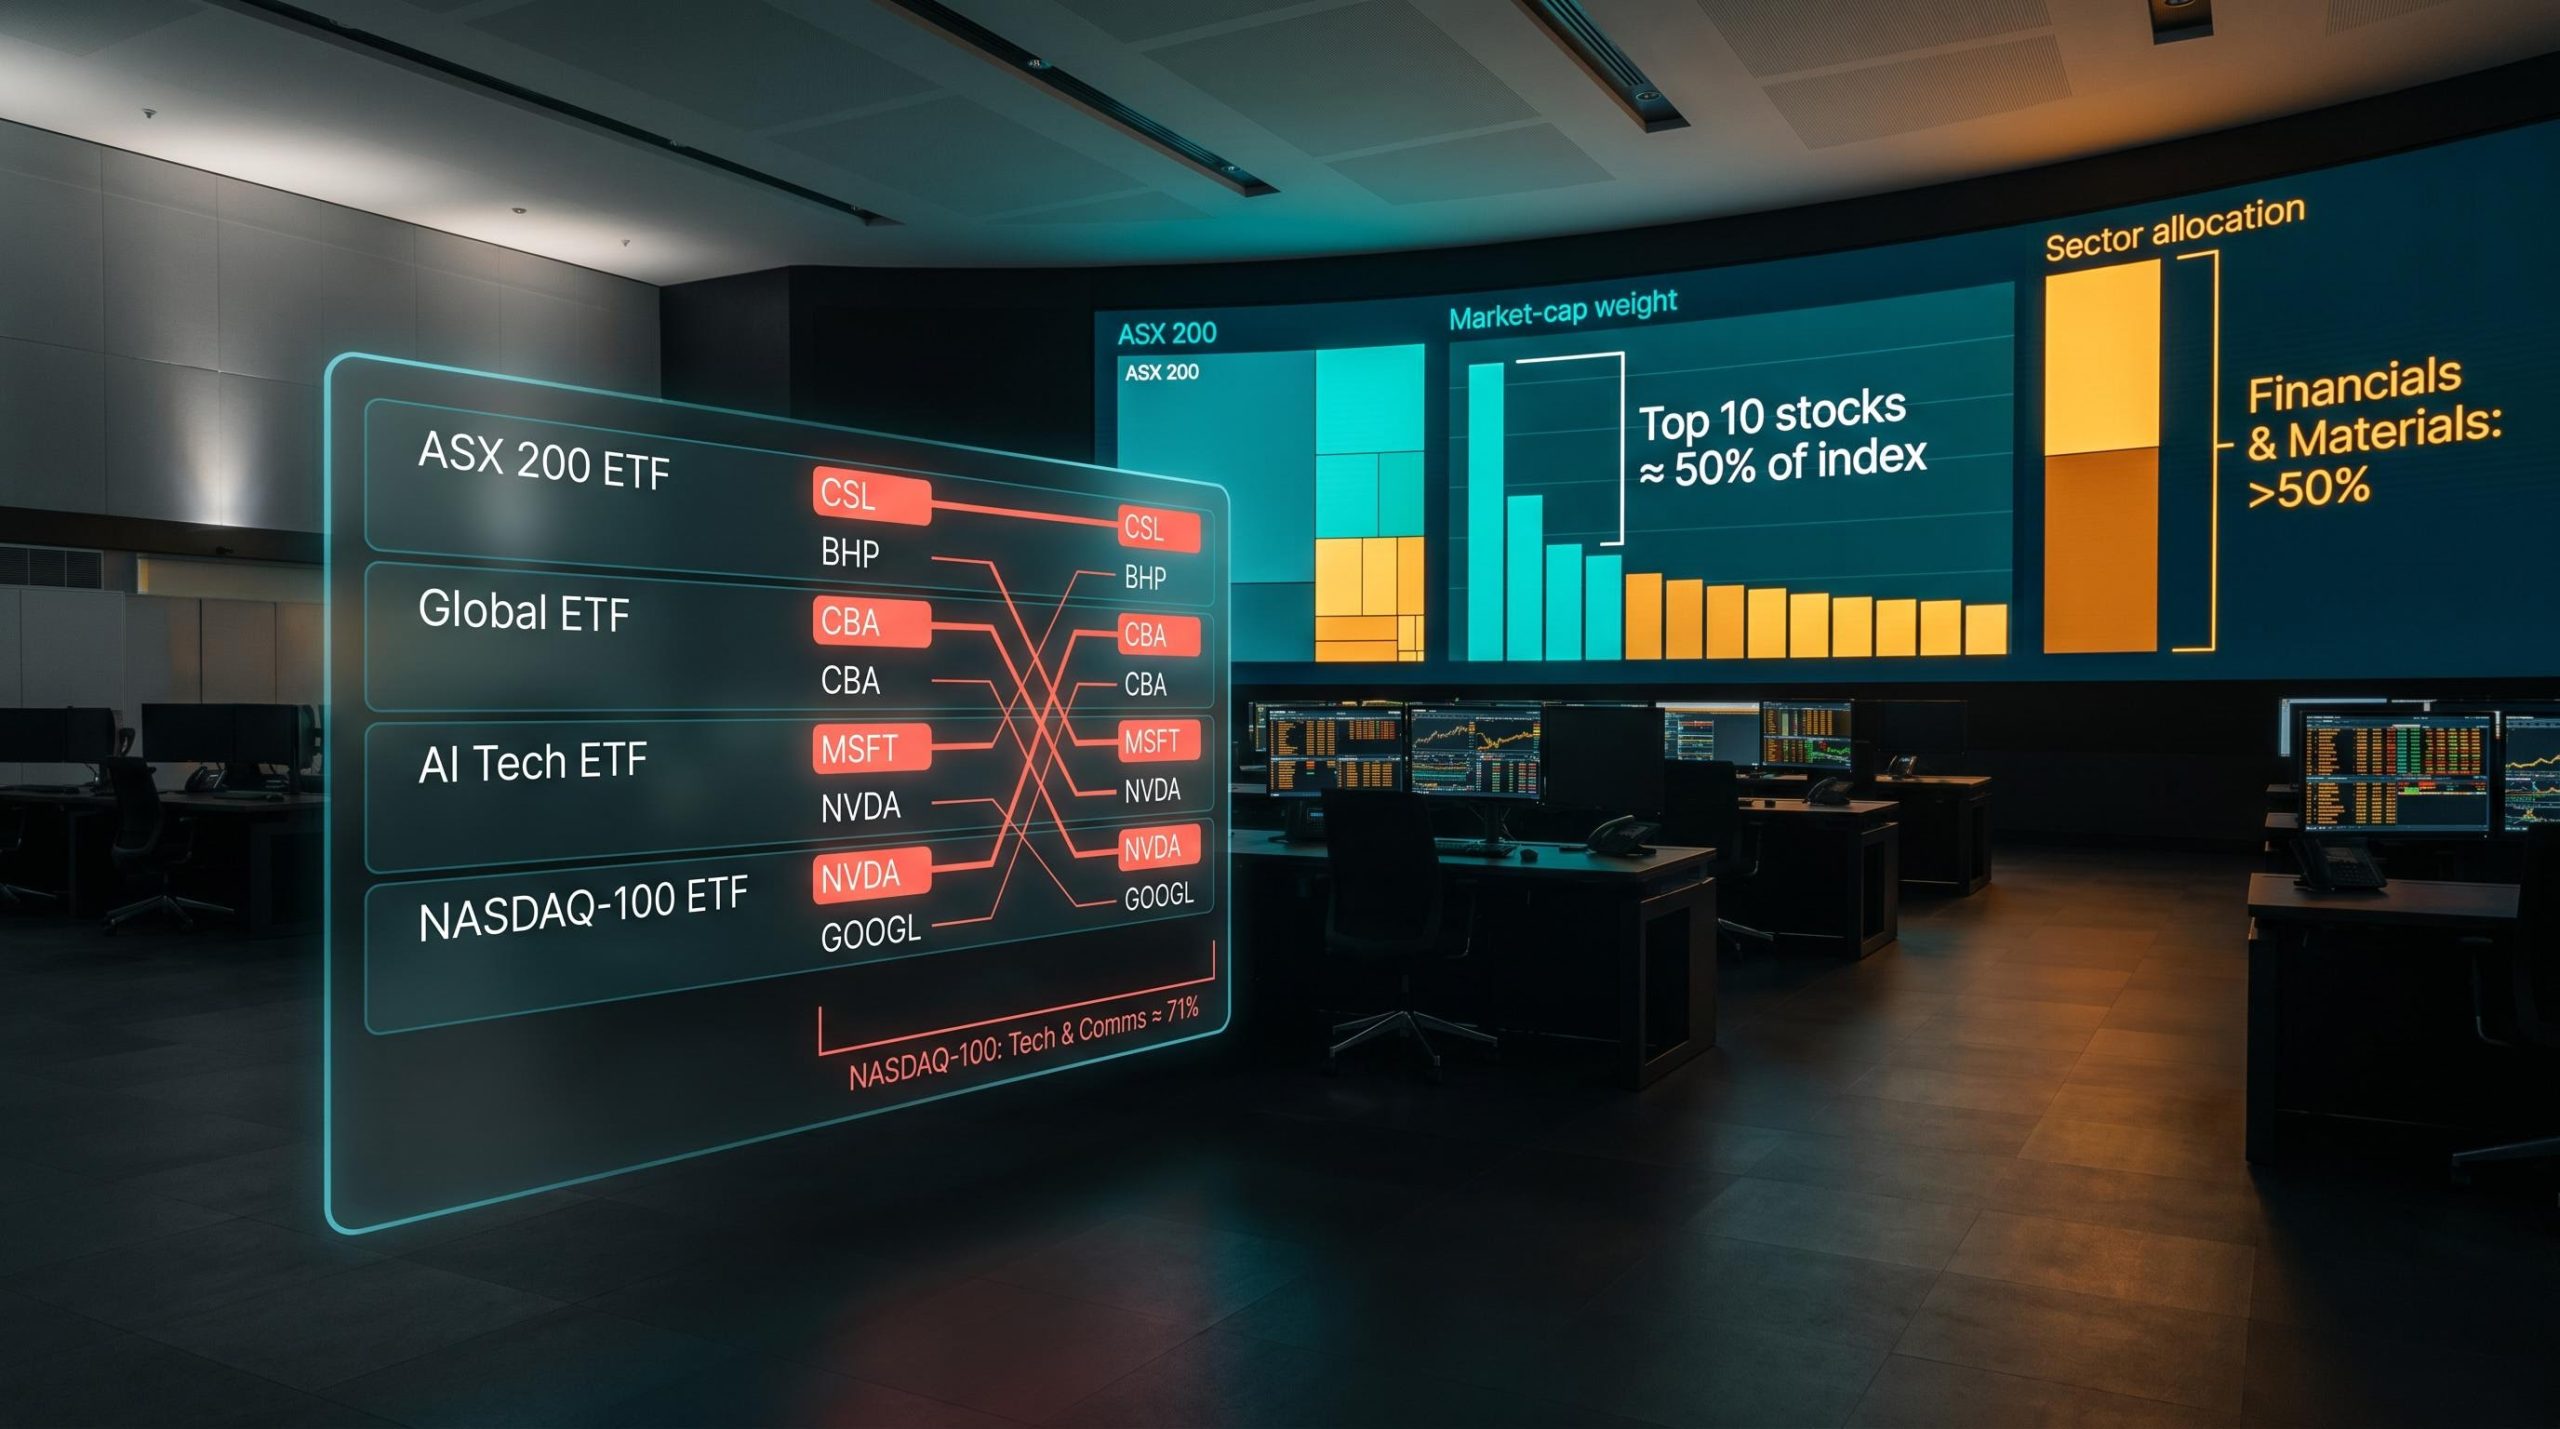
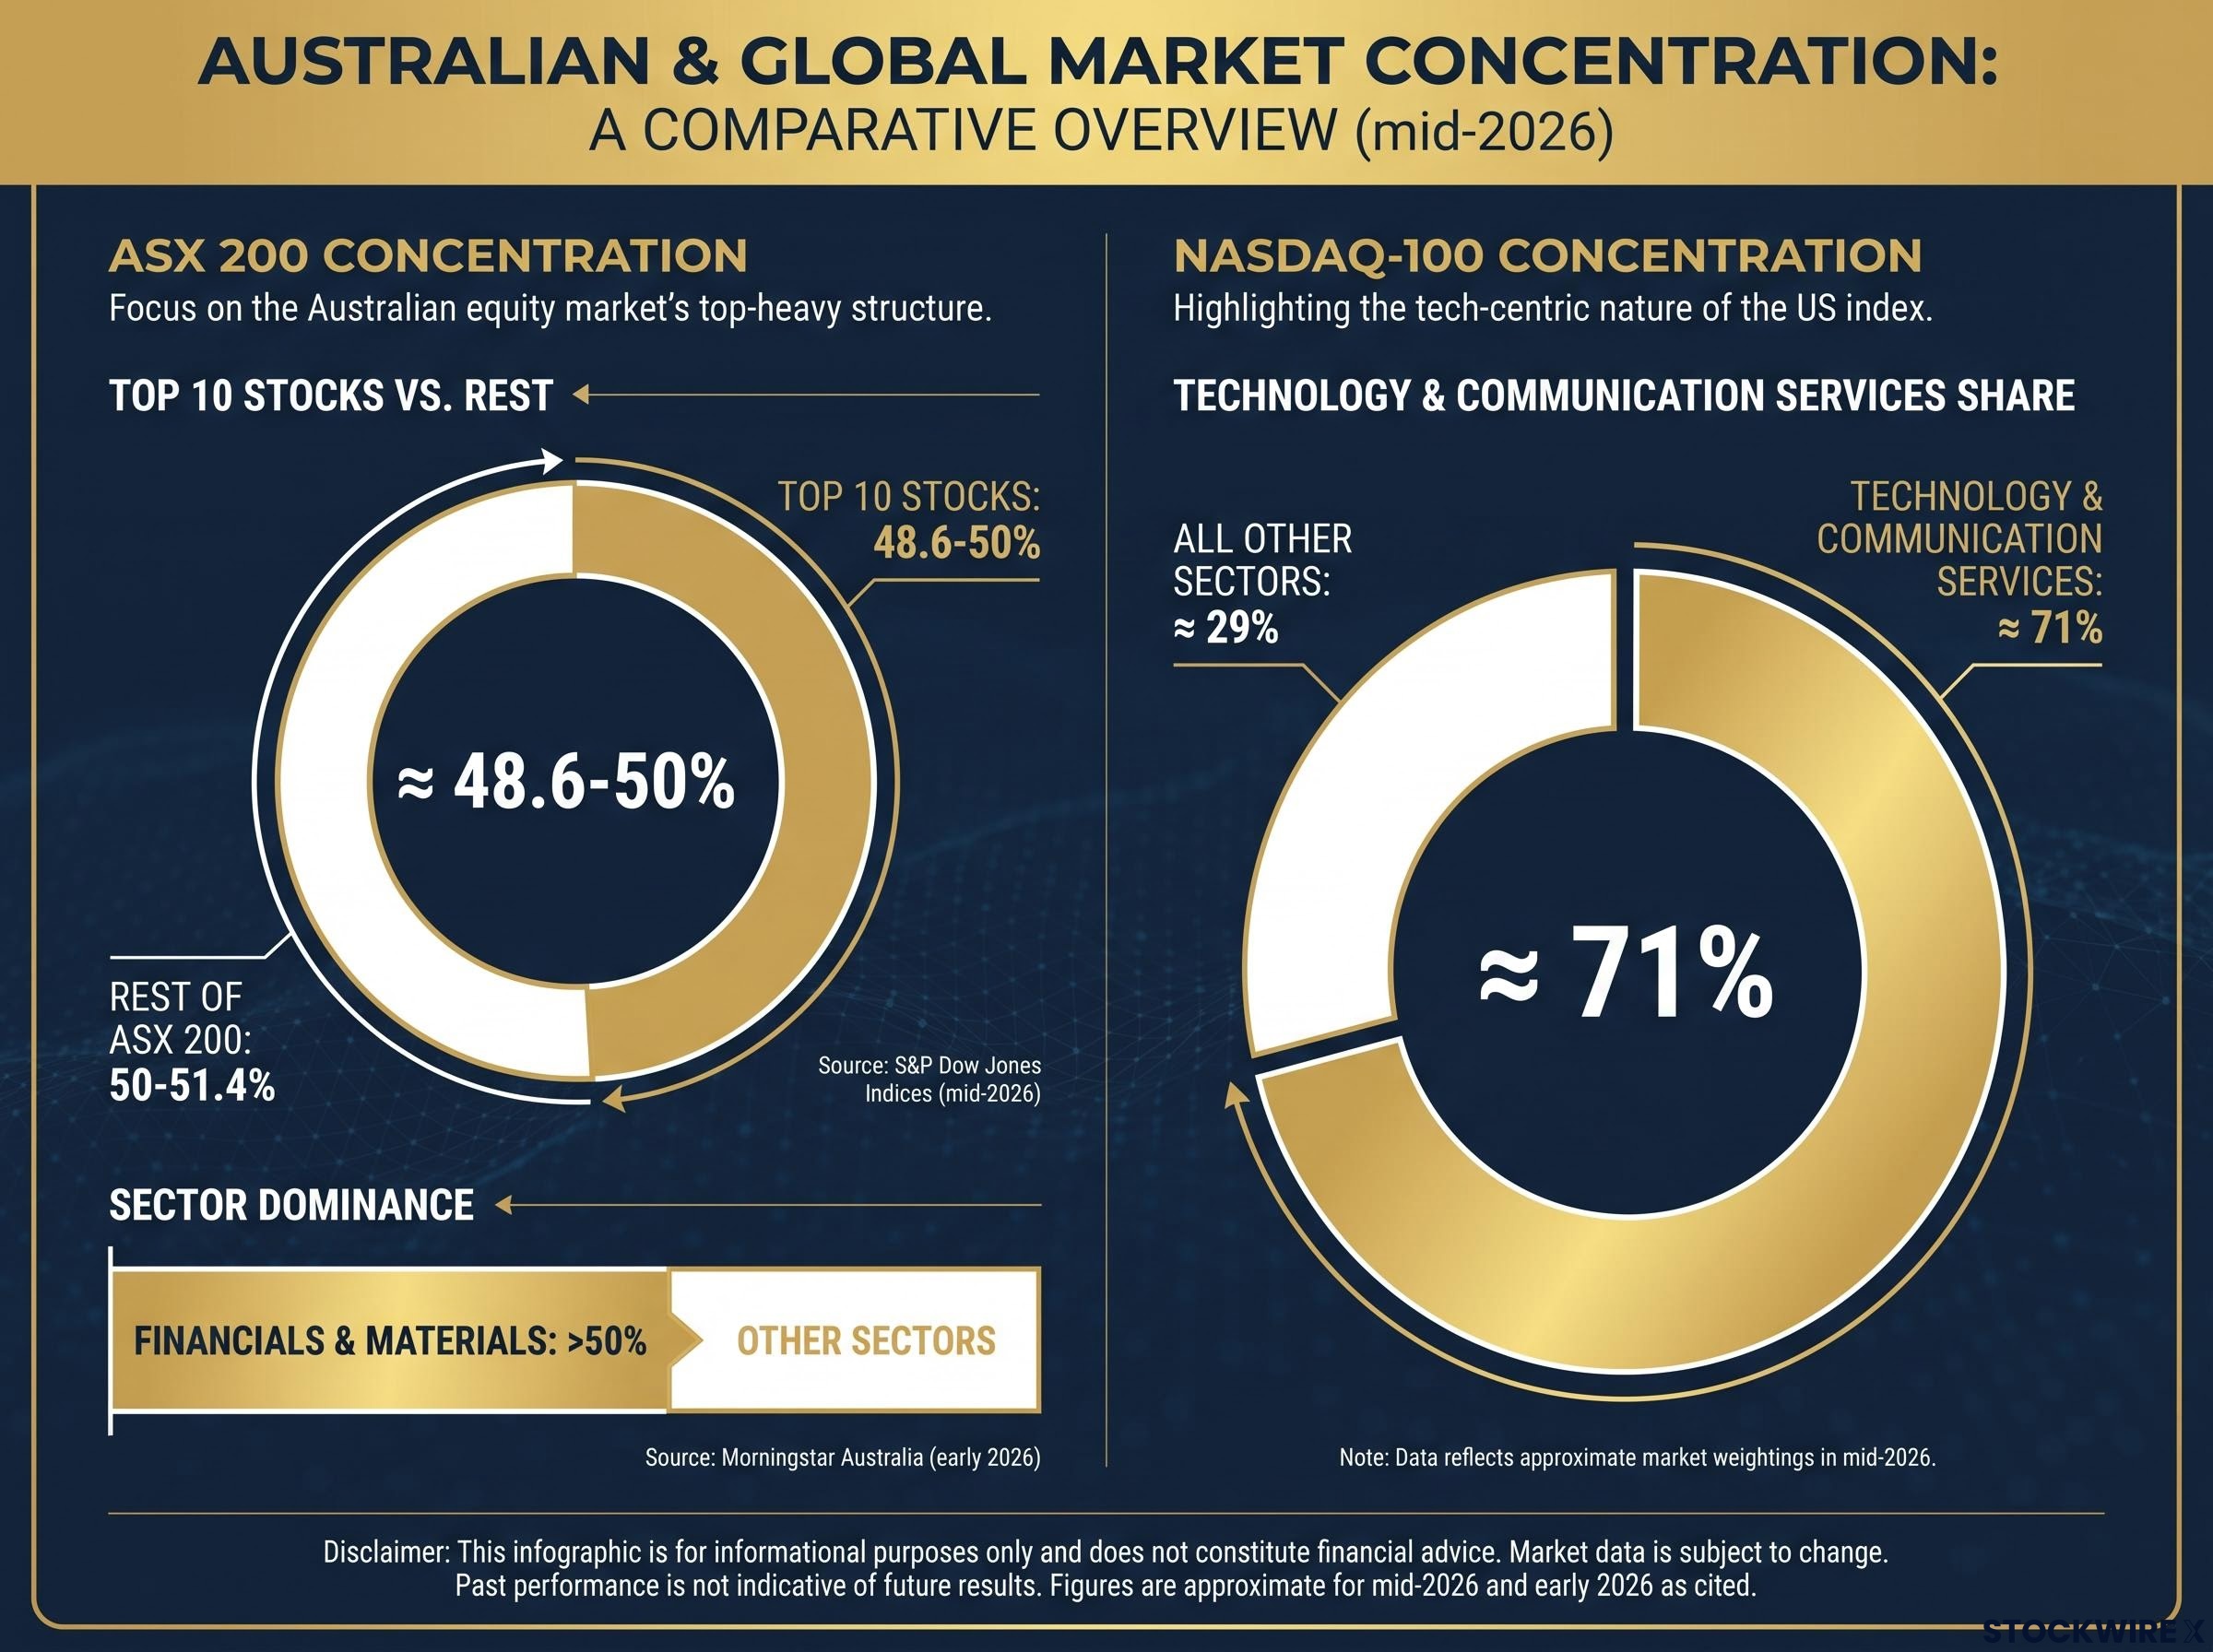
You own four ETFs. You feel diversified. But if two of those funds track the ASX and another two cover global or US equities, there is a reasonable chance that roughly half your Australian allocation sits in about 10 stocks, and a significant share of your international allocation is concentrated in a handful of US mega-caps. The numbers are more uncomfortable than the fund names suggest: the top 10 stocks in the ASX 200 account for approximately 48.6-50% of the entire index, according to S&P Dow Jones Indices data from mid-2026.
ETF adoption among Australian retail investors has accelerated sharply over the past two years, and the simplicity narrative (“buy the index, hold forever”) has done its job almost too well. It has made the structural risks of ETF investing invisible rather than absent. The risks covered here are not edge cases. They are features of how ETFs work, built into the mechanics of market-cap weighting, index construction, and the way liquidity actually functions under stress.
Here is the framework for identifying whether your own ETF holdings carry more concentration, overlap, or liquidity exposure than you currently realise. Think of it as a lens you can apply to your portfolio today.
Why ETFs feel diversified but often are not
ETFs deserve their reputation as accessible, low-cost investment tools. Owning a broad Australian equity ETF gives you exposure to 200 companies in a single trade, and that breadth is genuine in terms of the number of names in the fund. The problem is that breadth of names and breadth of exposure are two different things.
The distinction comes down to how most popular ETFs weight their holdings. Market-capitalisation weighting, the methodology used by the vast majority of broad-market ETFs, works in three mechanical stages:
The breadth-versus-exposure distinction becomes clearer when you work through what ETF ownership means structurally: each unit you purchase represents a proportional claim on a basket of securities weighted by market capitalisation, not an equal share across every constituent name.
- A company with a larger market capitalisation receives a larger allocation in the index
- As its share price rises, its market cap grows, and its index weight increases automatically
- Future inflows into the ETF then allocate an even larger share of capital to that same company
The result is that a broad ASX 200 ETF, despite holding 200 names, concentrates roughly half of every invested dollar into around 10 stocks. Financials and materials together represent more than half of ASX 200 exposure, according to Morningstar Australia analysis from early 2026.
“On paper you own hundreds of stocks but in practice, your returns are disproportionately driven by a handful of banks and miners.” — Morningstar Australia
None of this means ETFs are a poor product. It means that a single broad ASX ETF is not a bet on 200 companies in any meaningful sense. For your portfolio, the perceived diversification of a single-fund ASX allocation is substantially narrower than the fund’s name suggests. That distinction shapes everything that follows.
When big ASX news breaks, our subscribers know first
How the ASX’s structure turns broad ETFs into sector bets
The concentration described above is not just a function of how ETFs are built. It is a function of what the Australian equity market looks like. The ASX itself has a structural concentration problem, and broad ETFs inherit it directly.
The big four banks, Macquarie, and a handful of major miners dominate the index. Financials and materials together account for more than half of ASX 200 exposure, meaning a “broad Australian equity” ETF behaves, in practice, like a concentrated bet on two cyclical sectors. When commodity prices fall or bank earnings disappoint, the entire index moves with them, regardless of how the other 190 holdings are performing.
| ETF type | Dominant sector or region | Approximate top concentration |
|---|---|---|
| Broad ASX (e.g. ASX 200 tracker) | Financials and materials | Top 10 stocks ≈ 50% of index |
| Global developed (e.g. VGS) | US large-cap equities | US-heavy; not evenly global |
| NASDAQ-100 tracker | Technology and communication services | Tech and comms ≈ 71% |
The same pattern extends to international ETFs popular with Australian investors. VGS, a widely held global equity fund, is described as “not evenly spread across the world economy… It is a large bet on developed markets, particularly the US.” And US-focused tech ETFs carry even sharper concentration: technology and communication services represent approximately 71% of the NASDAQ-100.
For an Australian investor holding a broad ASX ETF alongside a global or US tech ETF, the combined portfolio may not be balanced global exposure at all. It may be two very different concentration bets: cyclical commodity and banking risk on one side, US mega-cap technology risk on the other.
The self-reinforcing loop that inflates the biggest names
ETF inflows make the concentration problem worse over time through a mechanical sequence. New money flowing into an index ETF buys all constituents according to their current weights. The largest stocks receive the most capital, pushing their prices higher. Their market caps rise, increasing their index weights further. The next wave of inflows then allocates an even larger share to the same names.
This dynamic applies regardless of whether those companies are attractively valued or fundamentally strong. ETFs are passive; capital flows to all constituents according to the weighting methodology, meaning weaker holdings benefit from inflows alongside stronger ones.
What thematic ETFs actually are (and what they are not)
Thematic ETFs covering areas like artificial intelligence, clean energy, cybersecurity, and battery metals have grown rapidly in popularity. The appeal is easy to understand: you believe in a long-term trend and want investment exposure to it. The structural reality, however, is that thematic ETFs concentrate risk more acutely than broad-market funds, and the branding often obscures how narrow the exposure actually is.
The core issue is that the investable universe for any specific theme is small. There are only so many listed companies building AI chips, producing battery-grade lithium, or operating cybersecurity platforms. When large capital inflows chase a narrow set of stocks, prices across the basket are mechanically inflated by demand rather than by improvements in the underlying businesses. Four categories are particularly exposed to this dynamic:
The thematic ETF behaviour gap, where the fund’s reported time-weighted return diverges sharply from the return actually experienced by investors due to poorly timed inflows near peak valuations, is consistently largest in high-narrative sectors such as AI and clean energy, precisely the categories most prone to concentrated inflows.
- AI and large-cap technology
- Clean energy and battery metals
- Cybersecurity
- Emerging market sector themes
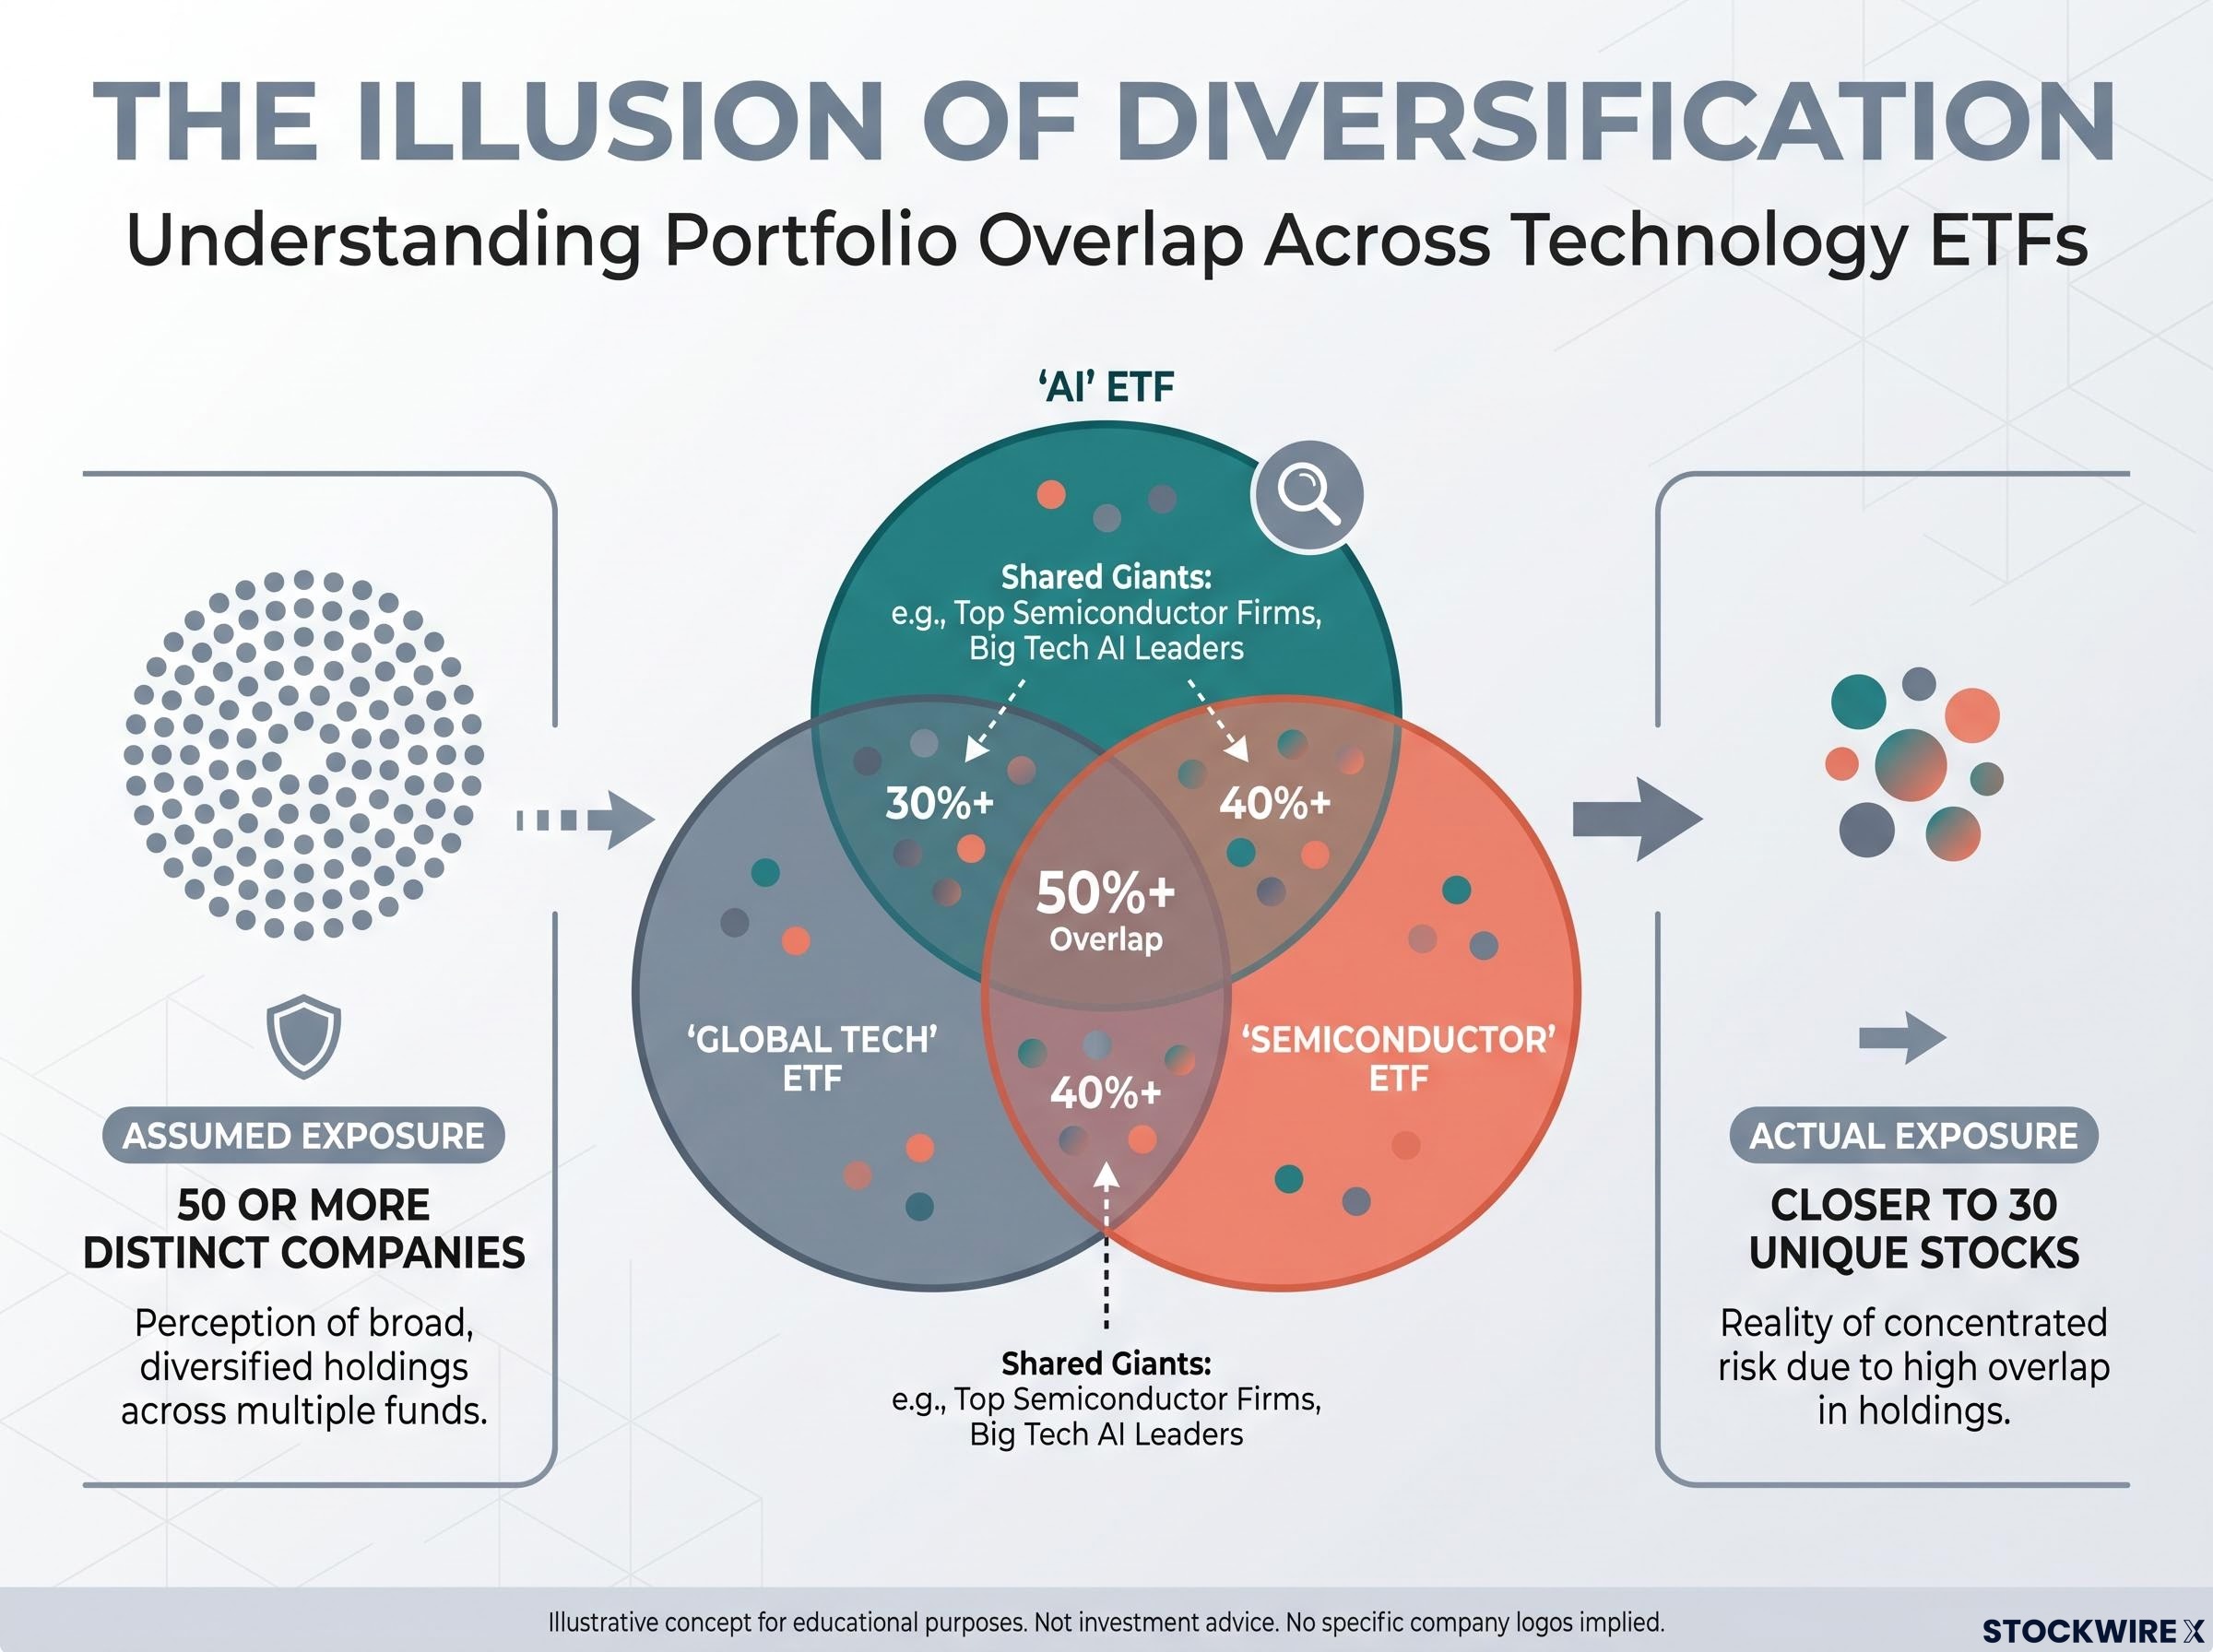
The branding compounds the problem. Names like “Global Innovation” or “Next-Gen Tech” suggest breadth, but the top 10 holdings may account for the bulk of actual exposure. When an investor holds “global tech”, “AI”, and “semiconductor” ETFs together, they may assume their combined exposure spans 50 or more distinct companies, but the actual number of unique stocks across all three funds can be closer to 30, because the same names repeat as constituents in each.
Thematic ETFs are better understood as high-conviction sector bets, not core diversification tools.
If you hold a thematic ETF as part of what you consider a diversified core portfolio, this distinction matters. You have made an active, concentrated sector call, regardless of whether that was your intention. Thematic ETFs can have a place in a portfolio, but as a modestly sized satellite allocation, not as a foundation.
The overlap problem: why more ETFs can mean less diversification
The instinct to buy more ETFs for more diversification makes intuitive sense, but it can produce the opposite result. Broad global ETFs, specialist technology funds, and thematic AI or innovation ETFs frequently share the same large-cap constituents, particularly leading US technology companies, so each fund may appear reasonably diversified in isolation while the combined portfolio carries a heavily repeated set of positions.
Three structural reasons make overlap difficult to spot. First, thematic branding emphasises the narrative (“Next-Gen Innovation”) rather than the constituent list, so you do not immediately see that the top holdings are largely identical across funds. Second, different index methodologies can mask the issue: the same company may be a 5% weight in one ETF and a 3% weight in another, so no single fund looks overly concentrated, but your combined position in that stock is material. Third, portfolio drift over time means holdings and weights shift after your initial purchase, and most investors rarely re-check the full constituent list.
ASIC’s Moneysmart guidance recommends reviewing “what index, sector or asset the ETF aims to replicate” and its holdings and risks. PassiveInvestingAustralia and Morningstar Australia both observe that Australian investors pairing broad ASX ETFs with US tech-heavy international ETFs can compound concentration rather than reduce it.
If you have never aggregated your holdings across multiple ETFs, you do not yet know your actual stock concentration. That is not a criticism; it is simply the starting point.
An ETF overlap audit using freely available provider CSV downloads and a basic spreadsheet typically takes a single afternoon and reveals the actual unique-stock count across a multi-fund portfolio, which is frequently 30-40% lower than investors initially estimate when funds share large-cap constituents.
How to check your real diversification in three steps
The process is straightforward and takes less than an hour for most portfolios:
- Download the full holdings list for each ETF you own from the issuer’s website (every major Australian ETF provider publishes these, and the Product Disclosure Statement tells you where to find them)
- Aggregate the holdings into a single spreadsheet, sorted by individual stock and by sector
- Calculate your total portfolio weight in each holding across all ETFs, not just the weight within any single fund
Most Australian broker platforms or portfolio tracking tools can assist with the aggregation once you have the raw data. The number that matters is your total exposure to a given company or sector across your entire portfolio, not what it looks like inside any one fund.
The liquidity trap: what happens when you need to sell
ETFs trade on the ASX like shares, and most investors assume this means they can sell quickly at any time. For large-cap Australian and major US equity ETFs, that assumption holds in normal conditions. But the gap between the liquidity you see on screen and the liquidity you actually have access to depends entirely on what the ETF holds underneath.
The distinction is between ETF screen liquidity, which is the ability to place a sell order during market hours, and underlying asset liquidity, which is how quickly the ETF provider or authorised participants can sell the securities inside the fund to process redemptions. When those underlying assets are hard to sell, your exit speed slows down regardless of what the order book looks like.
ASIC warns: “Some ETFs invest in assets that are not liquid, such as emerging market debt… This can make it difficult at times for the ETF provider to create or redeem securities.”
State Street notes that ETFs “may trade at prices above or below the ETF’s net asset value,” particularly in stressed markets or when underlying assets are hard to price. The categories where this gap is most material include:
The ASIC Moneysmart ETF guidance covers how the creation and redemption mechanism works to keep an ETF’s market price close to its net asset value, and explains why that mechanism can break down when underlying assets become illiquid, producing the NAV discounts that small-cap and emerging market ETF holders face in stressed conditions.
- Small-cap equity ETFs (Australian and international)
- Emerging market equity ETFs
- Emerging and frontier market debt ETFs
- Narrow thematic and sector ETFs with limited investable universes
During market stress, the mechanics worsen. Many investors attempt to sell simultaneously, forcing ETFs to redeem units and sell underlying assets into a falling, less liquid market. Market makers widen bid-ask spreads to compensate for higher uncertainty. The exit timeline for a small-cap ETF can stretch to multiple days even when the fund holds substantial assets, because the fund’s ability to exit positions is constrained by trading conditions in its underlying holdings rather than by the size of assets under management.
ASIC recommends placing ETF trades at least 30 minutes after market open and while the underlying markets are also open, to get prices closer to the fund’s underlying net asset value.
| ETF category | Underlying liquidity | Typical exit conditions | Key risk to watch |
|---|---|---|---|
| Large-cap Australian / US equity | High | Near-instant in normal conditions | Spreads may widen in severe stress |
| Small-cap equity | Medium | May take days for large positions | Price impact and NAV discount |
| Emerging market equity / debt | Low | Multi-day exits possible; NAV discounts likely | Redemption gating in extreme stress |
| Narrow thematic / sector | Low to Medium | Depends on constituent depth | Concentrated sell-offs amplify losses |
If you hold small-cap, emerging market, or niche thematic ETFs as a liquidity reserve or near-term spending buffer, those positions may not be accessible on the timeline you assume, precisely when market conditions make access most urgent.
What to do with this before you buy or sell your next ETF
The point of understanding these risks is not to avoid ETFs. It is to use them with your eyes open. A practical portfolio audit using the tools you already have access to, specifically issuer PDSs, holdings lists, and a basic spreadsheet, can be completed in an afternoon.
- Review each ETF’s Product Disclosure Statement and full holdings list to understand exactly what index, sector, or asset class it tracks
- Aggregate your stock and sector exposures across all funds into a single view, working from total portfolio weights rather than per-fund weights
- Identify any thematic or narrow sector ETFs and assess whether their position size reflects a deliberate high-conviction allocation or an accidental overweight
- Check whether any ETF you currently hold as a liquid buffer actually invests in assets with elevated liquidity risk relative to your intended holding period
The Australian-specific balance to consider
Reducing home-market concentration by shifting some exposure to international equity ETFs involves a genuine trade-off. Broad ASX ETFs generate franked dividends, which carry meaningful tax benefits for Australian investors. International ETFs do not produce franked income. Both PassiveInvestingAustralia and Morningstar Australia highlight this tension: diversifying away from banks and miners improves your sector spread, but it reduces the franking credits flowing through your portfolio. This is a factor to weigh based on your own tax position, not a decision that has a single correct answer.
For investors wanting to move from the audit stage to building a more deliberate allocation, our dedicated guide to ETF portfolio construction covers the asset allocation split, weighting methodology choices, and fund count decisions that Australian retail and SMSF investors face when designing a portfolio from the ground up.
This article is for informational purposes only and should not be considered financial advice. Investors should conduct their own research and consult with financial professionals before making investment decisions.
Knowing what you own changes how you invest
Concentration, false diversification, and liquidity constraints are not flaws in ETFs as a product. They are structural features of how index construction, market-cap weighting, and underlying asset markets work. ETFs remain one of the most cost-effective and accessible ways to build a portfolio. The difference is between using them with full awareness of what you actually own and using them based on what the fund name implies.
The investor who has run the overlap audit, checked their sector concentration, and assessed the liquidity profile of each holding is in a materially different position from the one who assumes four different fund names mean four different exposures. The lens is simple. Apply it once, and you will see your portfolio differently from that point forward.