VAS vs VHY: Why the Lower-Yield ETF Wins in Retirement
32 mins ago
Most investors understand that receiving a dividend feels like getting paid. The deposit appears in the brokerage account, the portfolio value looks unchanged, and the quarterly income seems to arrive without cost. What fewer realise is that on the day a company pays out, its share price drops by almost exactly the dividend amount, leaving total wealth essentially unchanged at the moment of distribution.
Dividend investing has surged in popularity, particularly during periods of market volatility when income-seeking investors treat high-yield stocks as a refuge. The February-to-March 2026 global equity correction revived the narrative that dividend stocks offer stability and passive income. The mechanics of how dividends actually work tell a more complicated story. What follows is a precise walkthrough of the ex-dividend adjustment, why the “free money” intuition is flawed, what total return actually measures, and why portfolios built around yield alone carry structural risks that most retail investors underestimate.
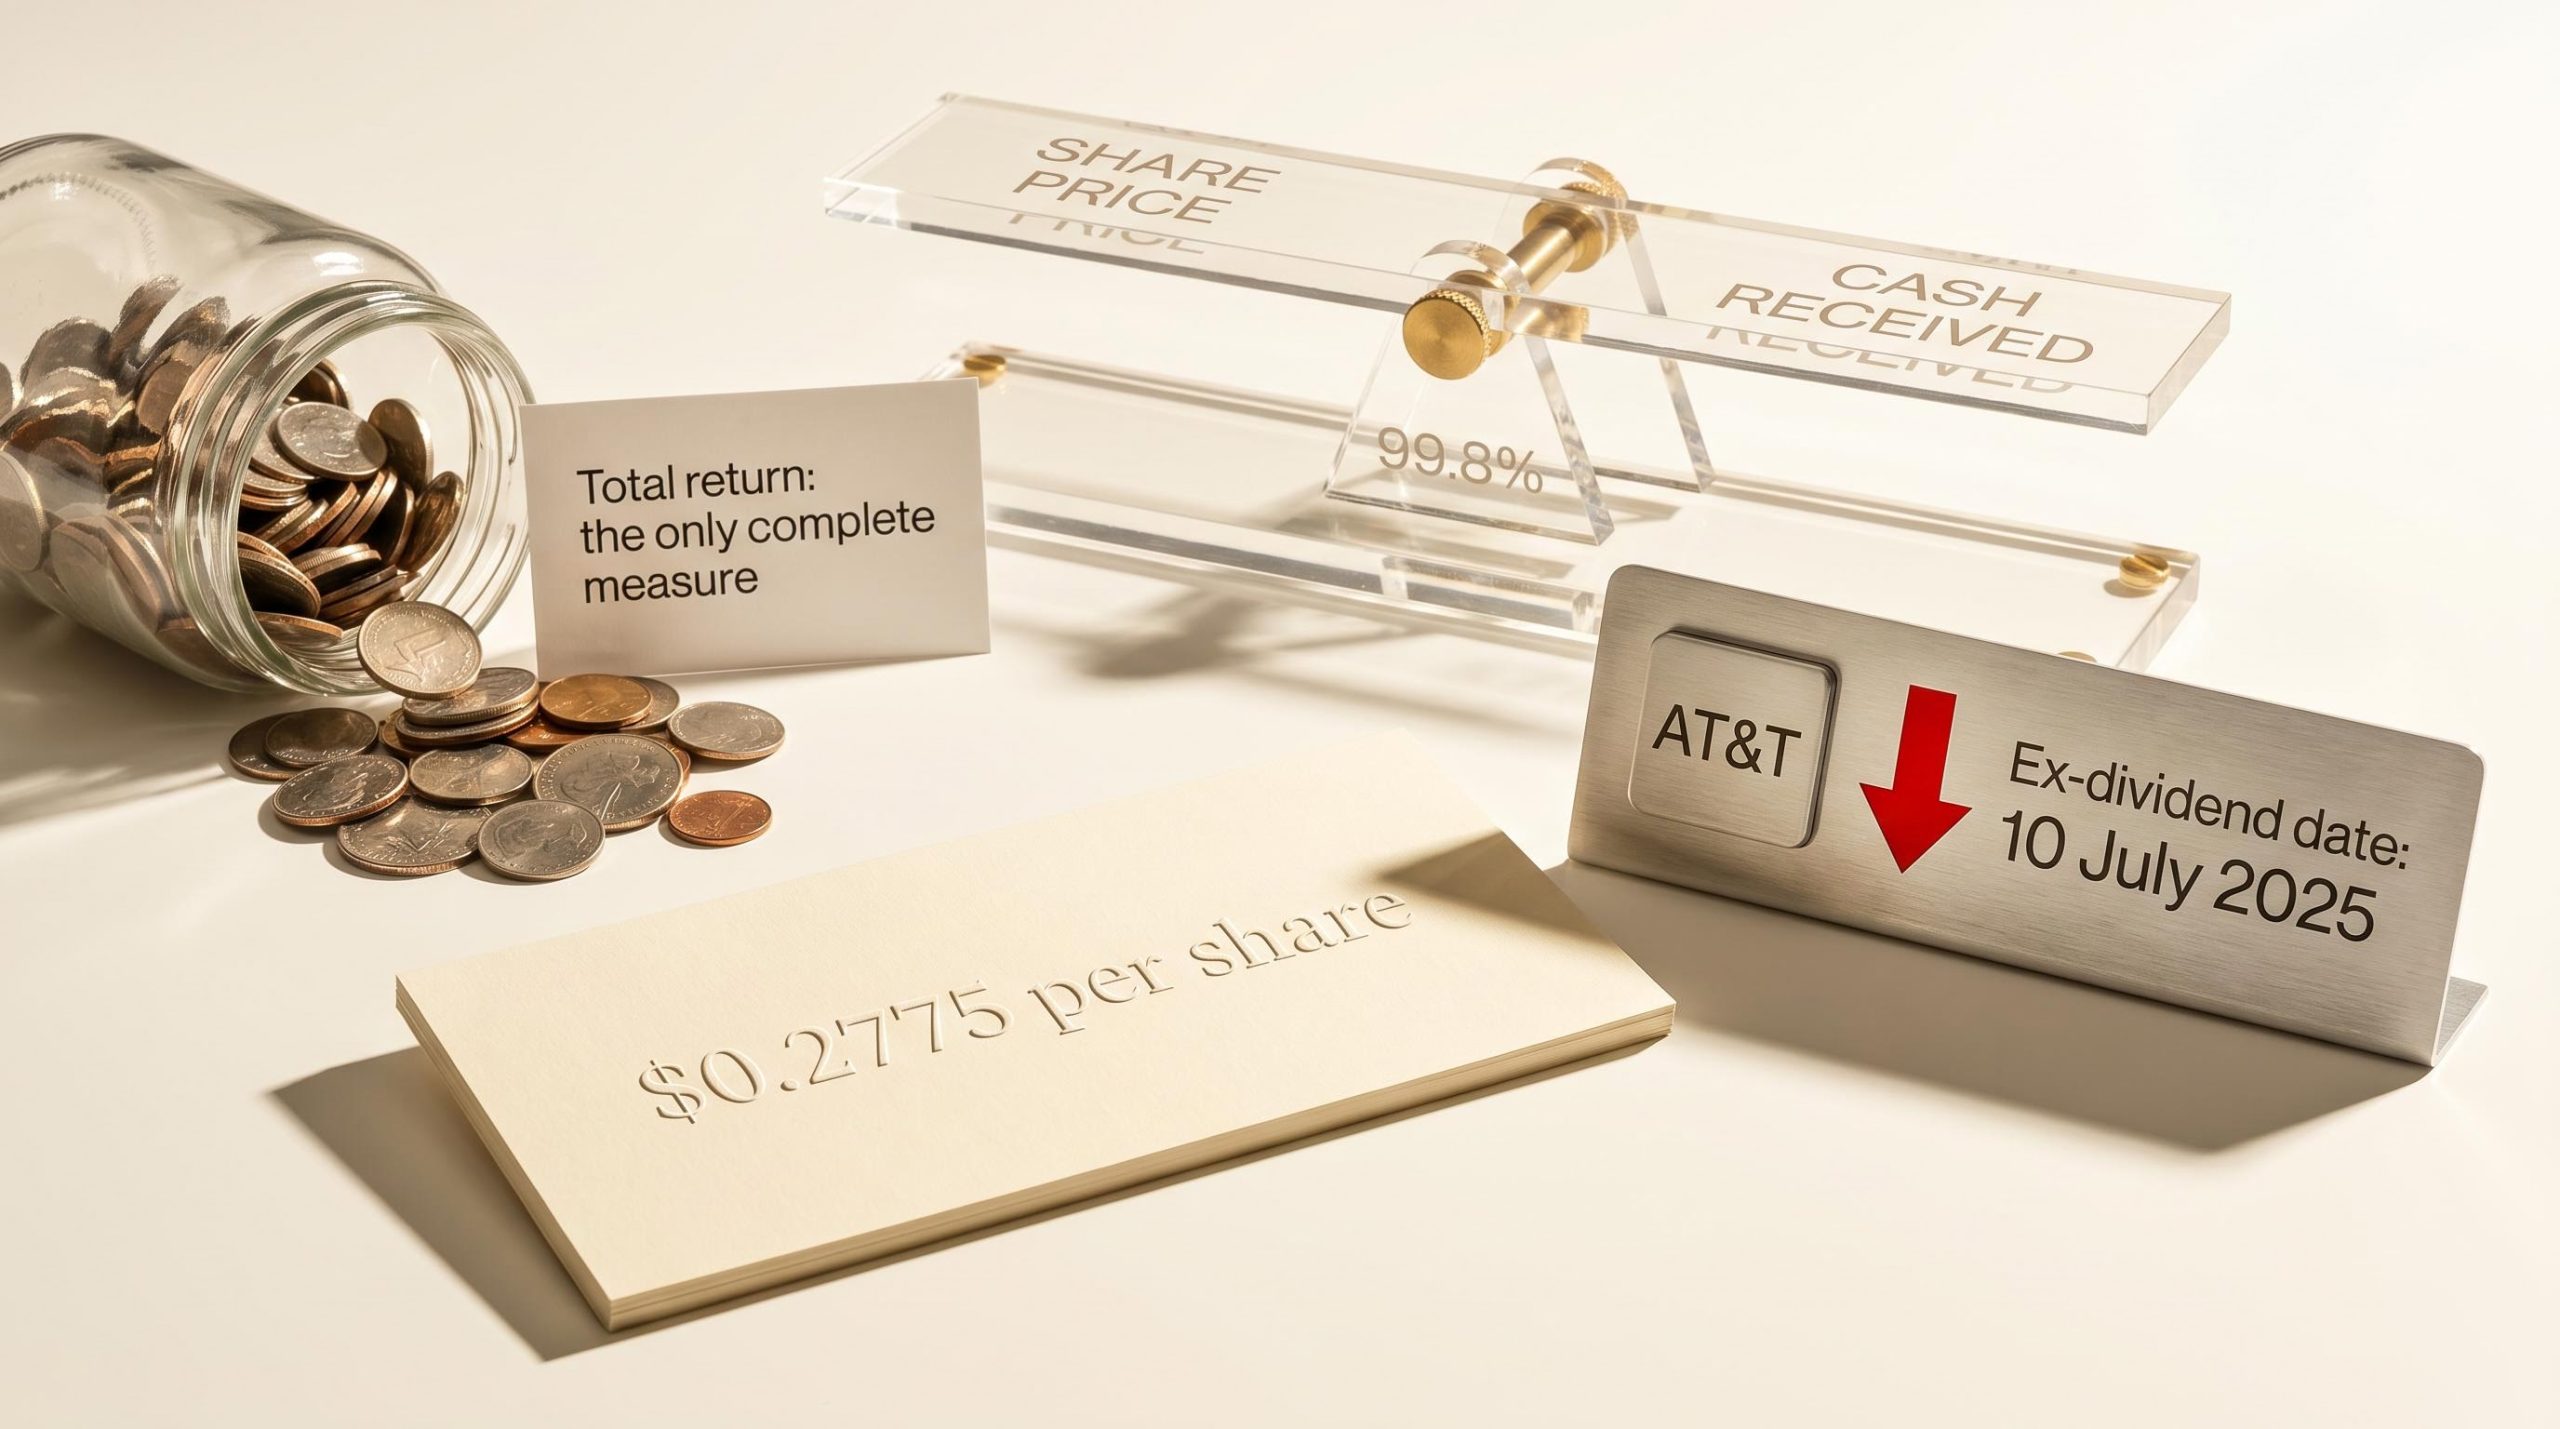
The dividend hits the account. The number is right there: $0.2775 per share, deposited on schedule. It feels like income.
Then the share price opens lower by almost exactly that amount. The stock is now worth less than it was the day before, and the difference matches the payment the investor just received. Total wealth has not changed. Value has moved from one pocket to another.
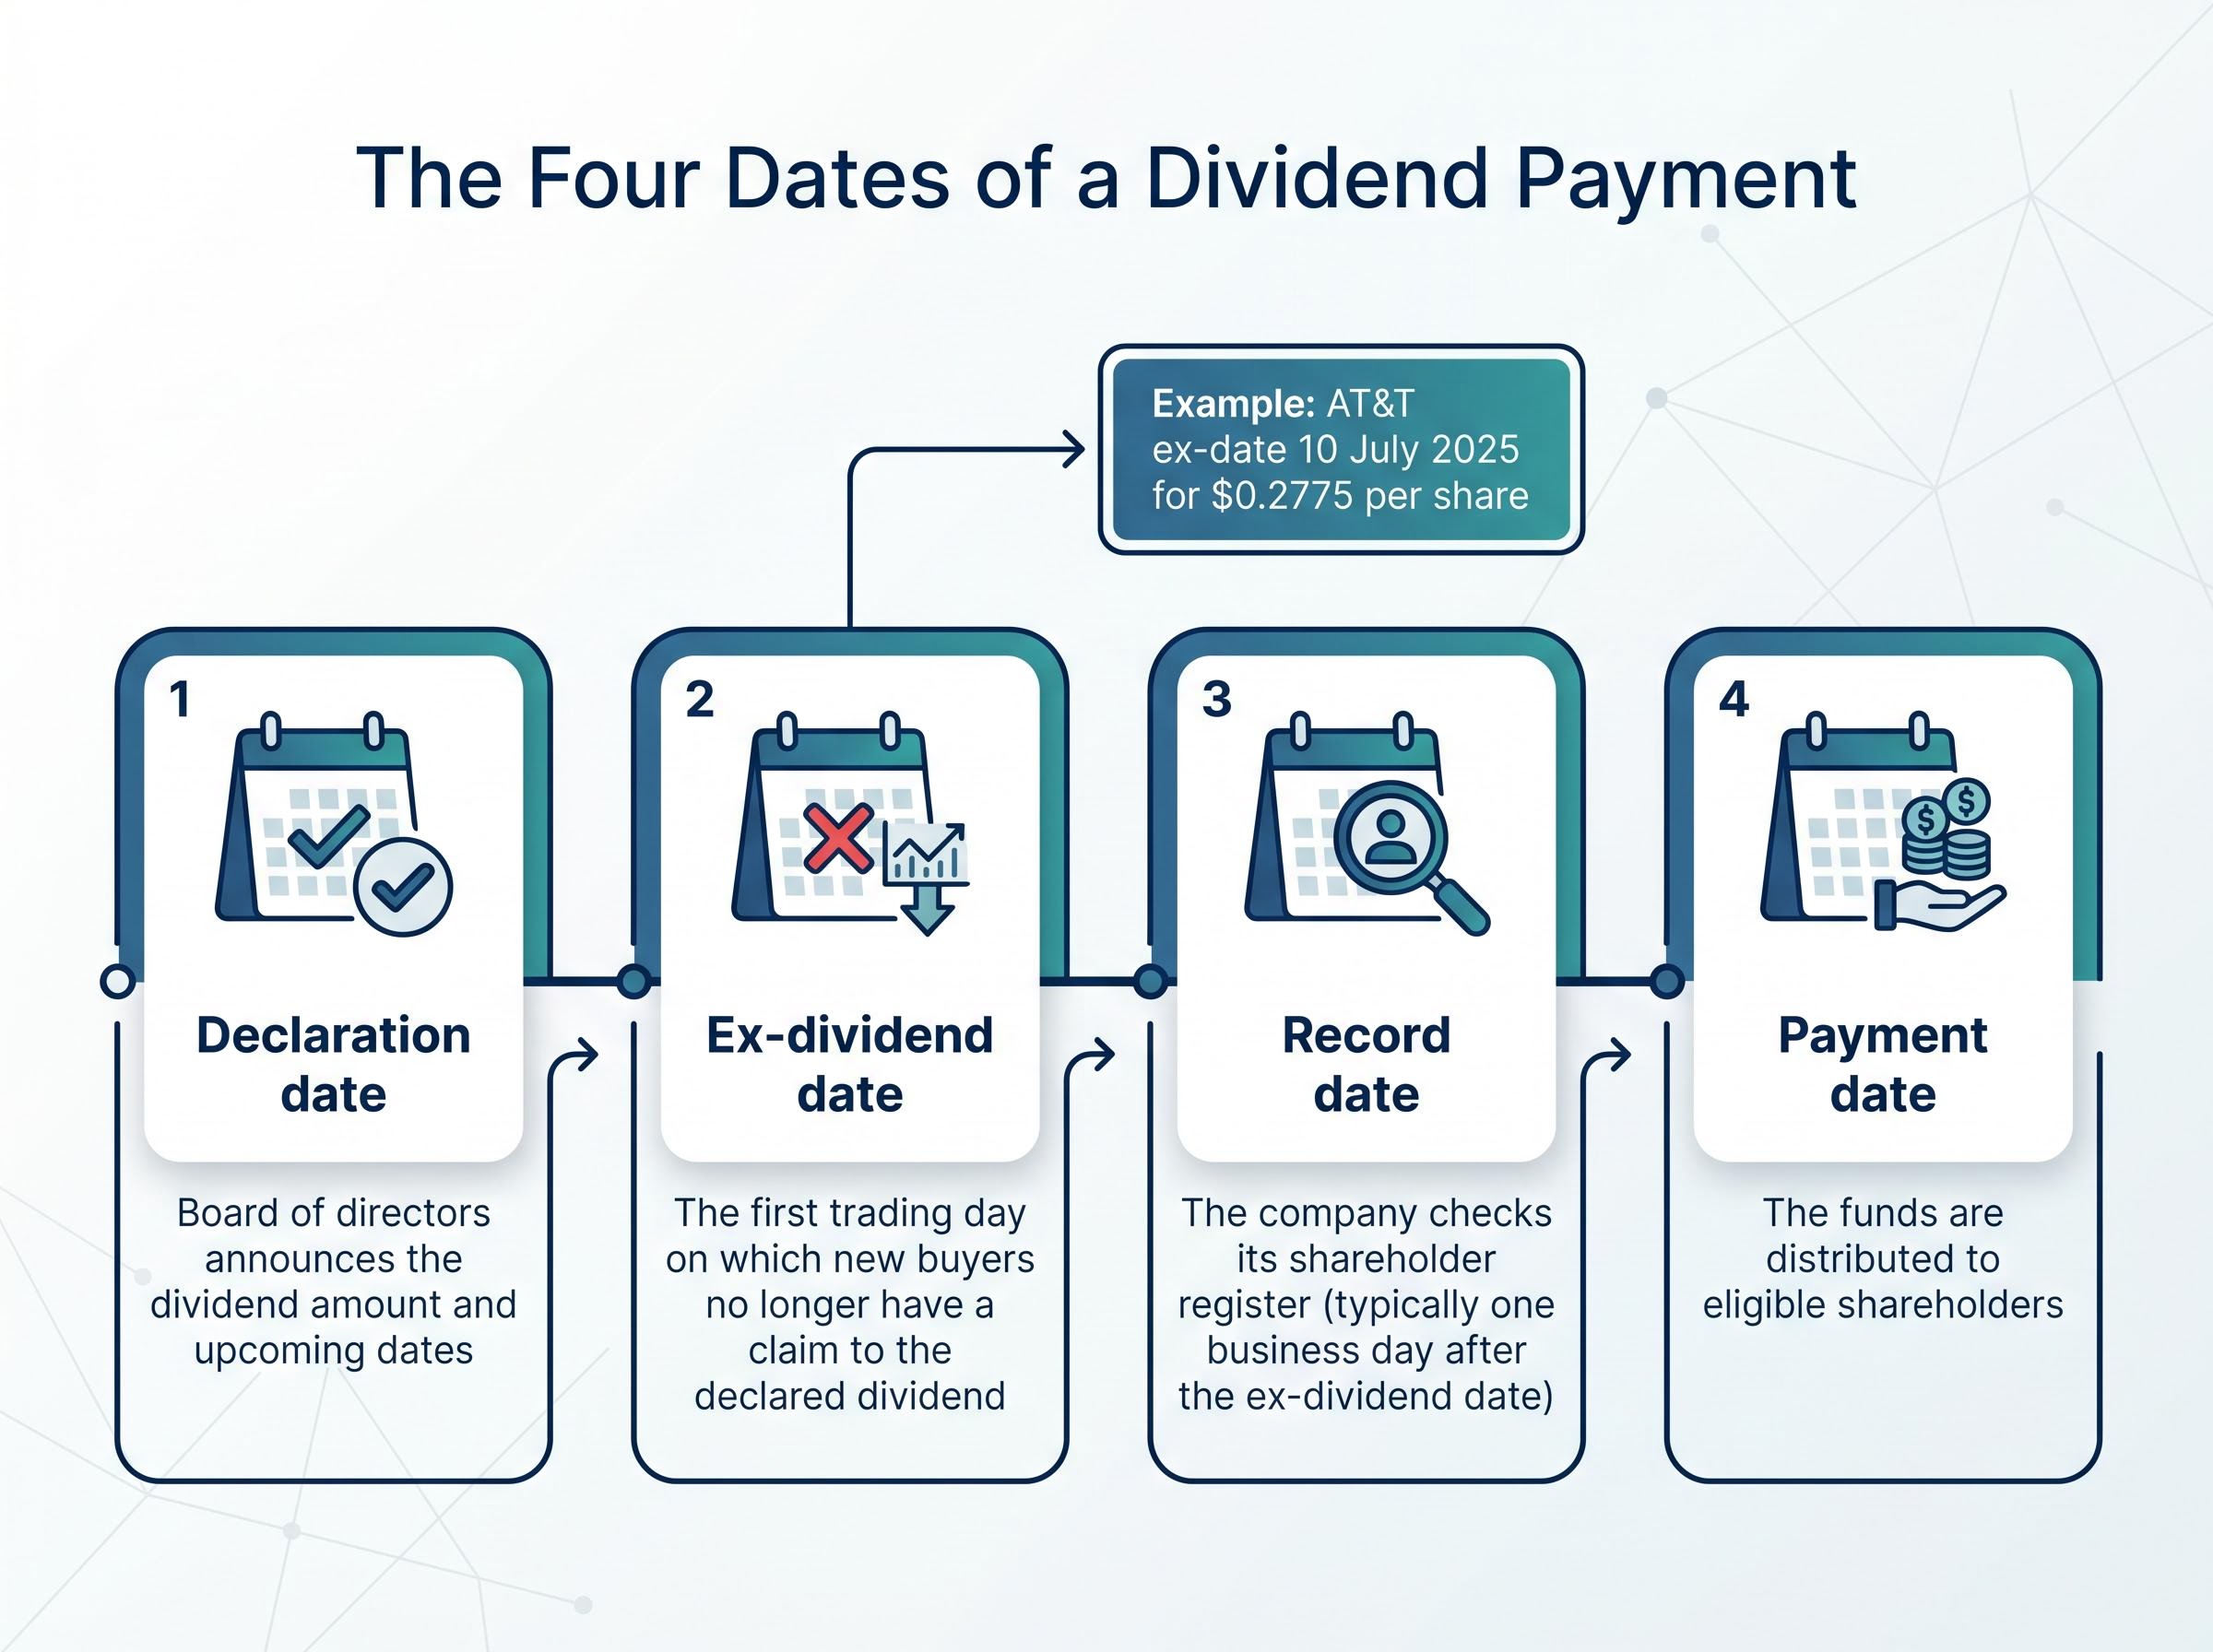
Every dividend follows a four-date sequence:
The ex-dividend date is the mechanically critical one. It is the moment the stock price adjusts.
When a company distributes cash to shareholders, that cash leaves the business. The company’s intrinsic value falls by the distributed amount, and the share price reflects this reduction.
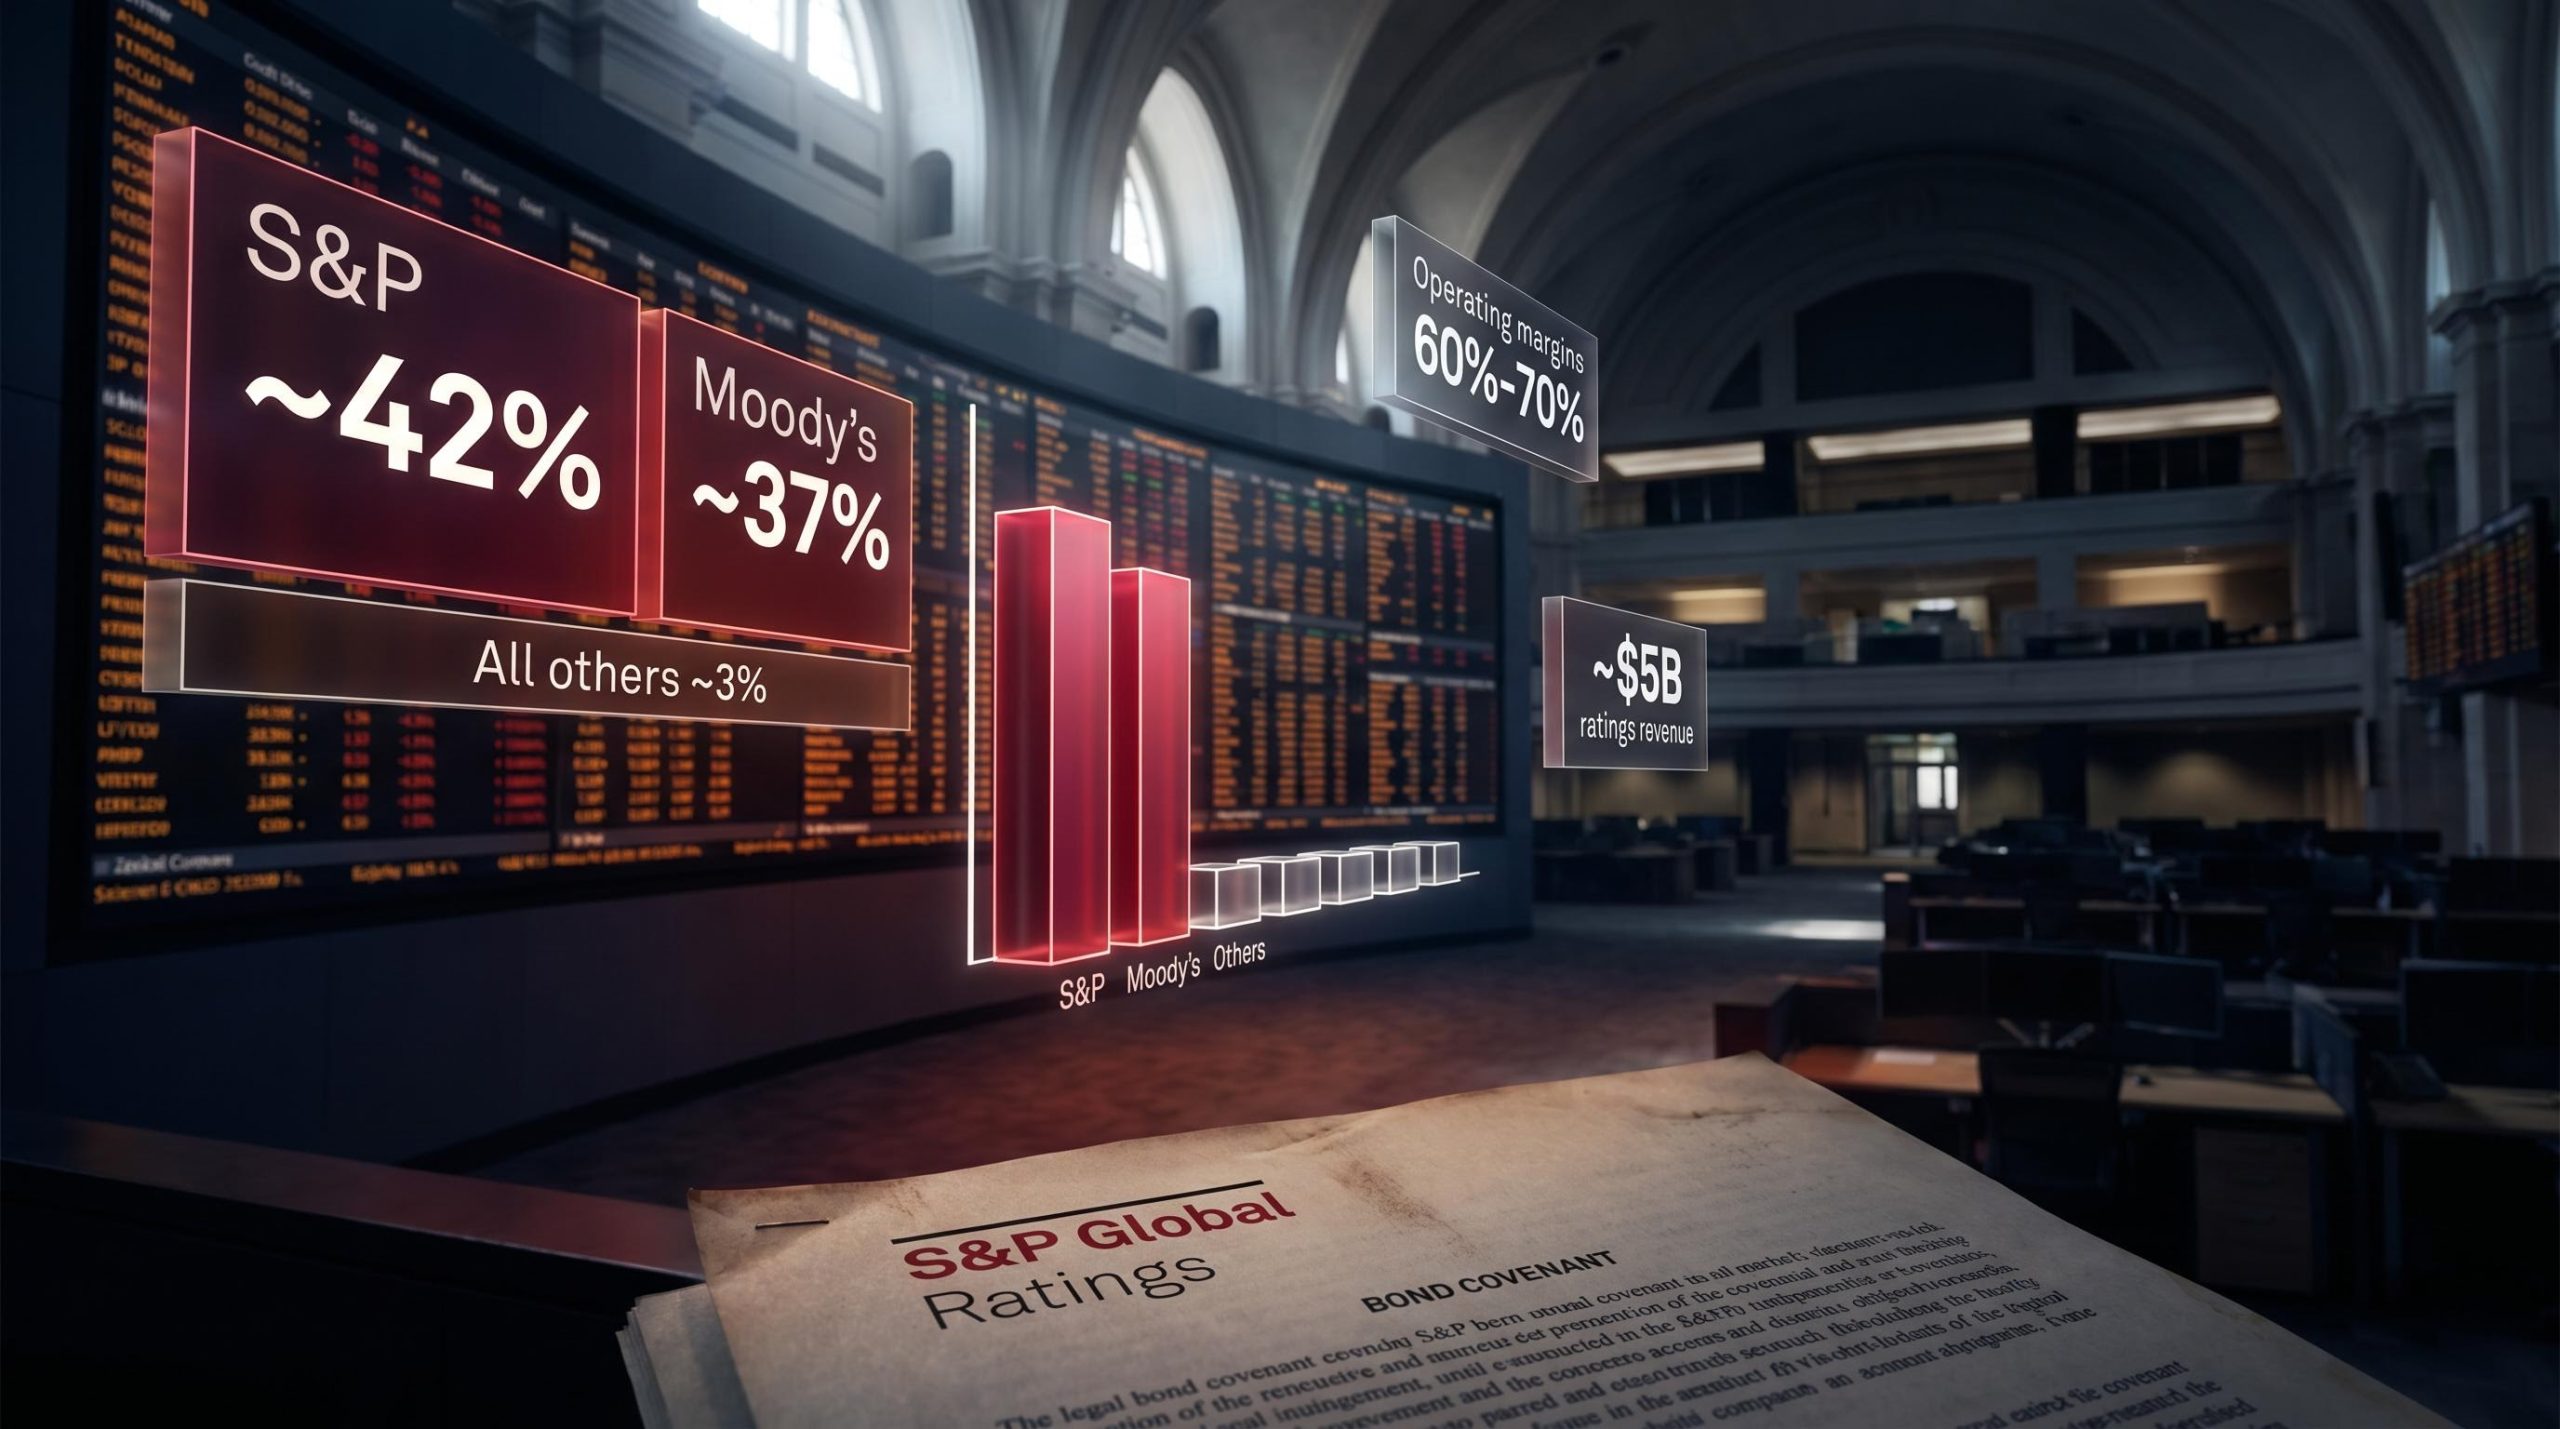
This is not market noise. Research by Hartzmark and Solomon, documented across more than 500 S&P 500 firms, found that ex-dividend price drops average approximately 99.8% of the payout size. The relationship is near-exact.
Hartzmark and Solomon’s research, published in The Journal of Finance, provides the foundational empirical basis for this finding, documenting that retail investors systematically treat dividends and capital gains as disconnected sources of value without recognising that one comes directly at the expense of the other.
Ex-dividend price drops average approximately 99.8% of the payout size across large samples of S&P 500 firms, confirming that dividends transfer value from the share price to the cash account rather than creating new wealth.
AT&T paid a $0.2775 per share quarterly dividend with an ex-date of 10 July 2025. Its price adjusted downward in a manner consistent with this mechanical offset. No net wealth was created at the moment of distribution.
The most common mental shortcut investors use is to treat dividends like bond interest: a regular payment received on top of an asset that holds its value. The analogy is intuitive, and it is wrong at a structural level.
Bond interest is paid to investors while the principal remains intact. The bondholder receives income without the underlying asset’s value declining. A dividend payment, by contrast, reduces the value of the issuing company. The cash that was sitting on the balance sheet is now in the shareholder’s account, and the share price reflects its absence.
Spencer Jakab, a Wall Street Journal contributor, observed in a column published 7 May 2026 that dividends paid out immediately reduce company value. The distinction matters because it reframes how investors should categorise dividend income: not as yield earned on a stable asset, but as a partial return of invested capital. Companies that retain earnings rather than paying dividends reinvest those funds into future growth. High-dividend payers return that capital to shareholders to deploy elsewhere.
Getting this distinction wrong distorts every subsequent investment decision.
| Attribute | Bond interest | Dividend payment |
|---|---|---|
| Impact on principal/share price | Principal remains intact until maturity | Share price declines by approximately the payout amount |
| Income source | Interest earned on lent capital | Partial return of invested capital from company earnings |
| Investor obligation | Hold to maturity (or sell at market price) | No maturity; ongoing equity ownership with no guaranteed payout |
In 2004, Microsoft announced a special dividend large enough to make the arithmetic unmistakable. An investor tracking only the share price across the period from 31 December 2003 to 31 December 2004 would have seen a picture that looked significantly worse than what actually occurred.
The special dividend moved a substantial amount of cash from the company’s balance sheet into shareholders’ accounts. The share price fell to reflect that distribution. On a price-return basis, the stock appeared to have underperformed. On a total-return basis, accounting for both price movement and the dividend received, the picture changed materially.
The divergence between those two numbers is the clearest possible illustration of why watching only the share price after a large dividend payment gives an investor a fundamentally incomplete picture.
Tracking only the share price after a special dividend gives an investor a fundamentally incomplete picture of what happened to their wealth. The dividend left the company and arrived in the shareholder’s account; total return captures both sides of that transfer.
Total return combines price appreciation with dividends received (or reinvested). It is the only metric that accurately captures what an investor’s capital actually did over a given period.
Evaluating dividend strategies on yield alone, without total return, systematically distorts performance assessment. A stock that pays a 4% yield but whose share price declines 5% has delivered a negative total return. The yield, taken in isolation, obscured a loss.
The mechanics of individual dividends are one issue. The portfolio-level consequence of building an entire strategy around yield is another, and it is where the structural damage becomes visible.
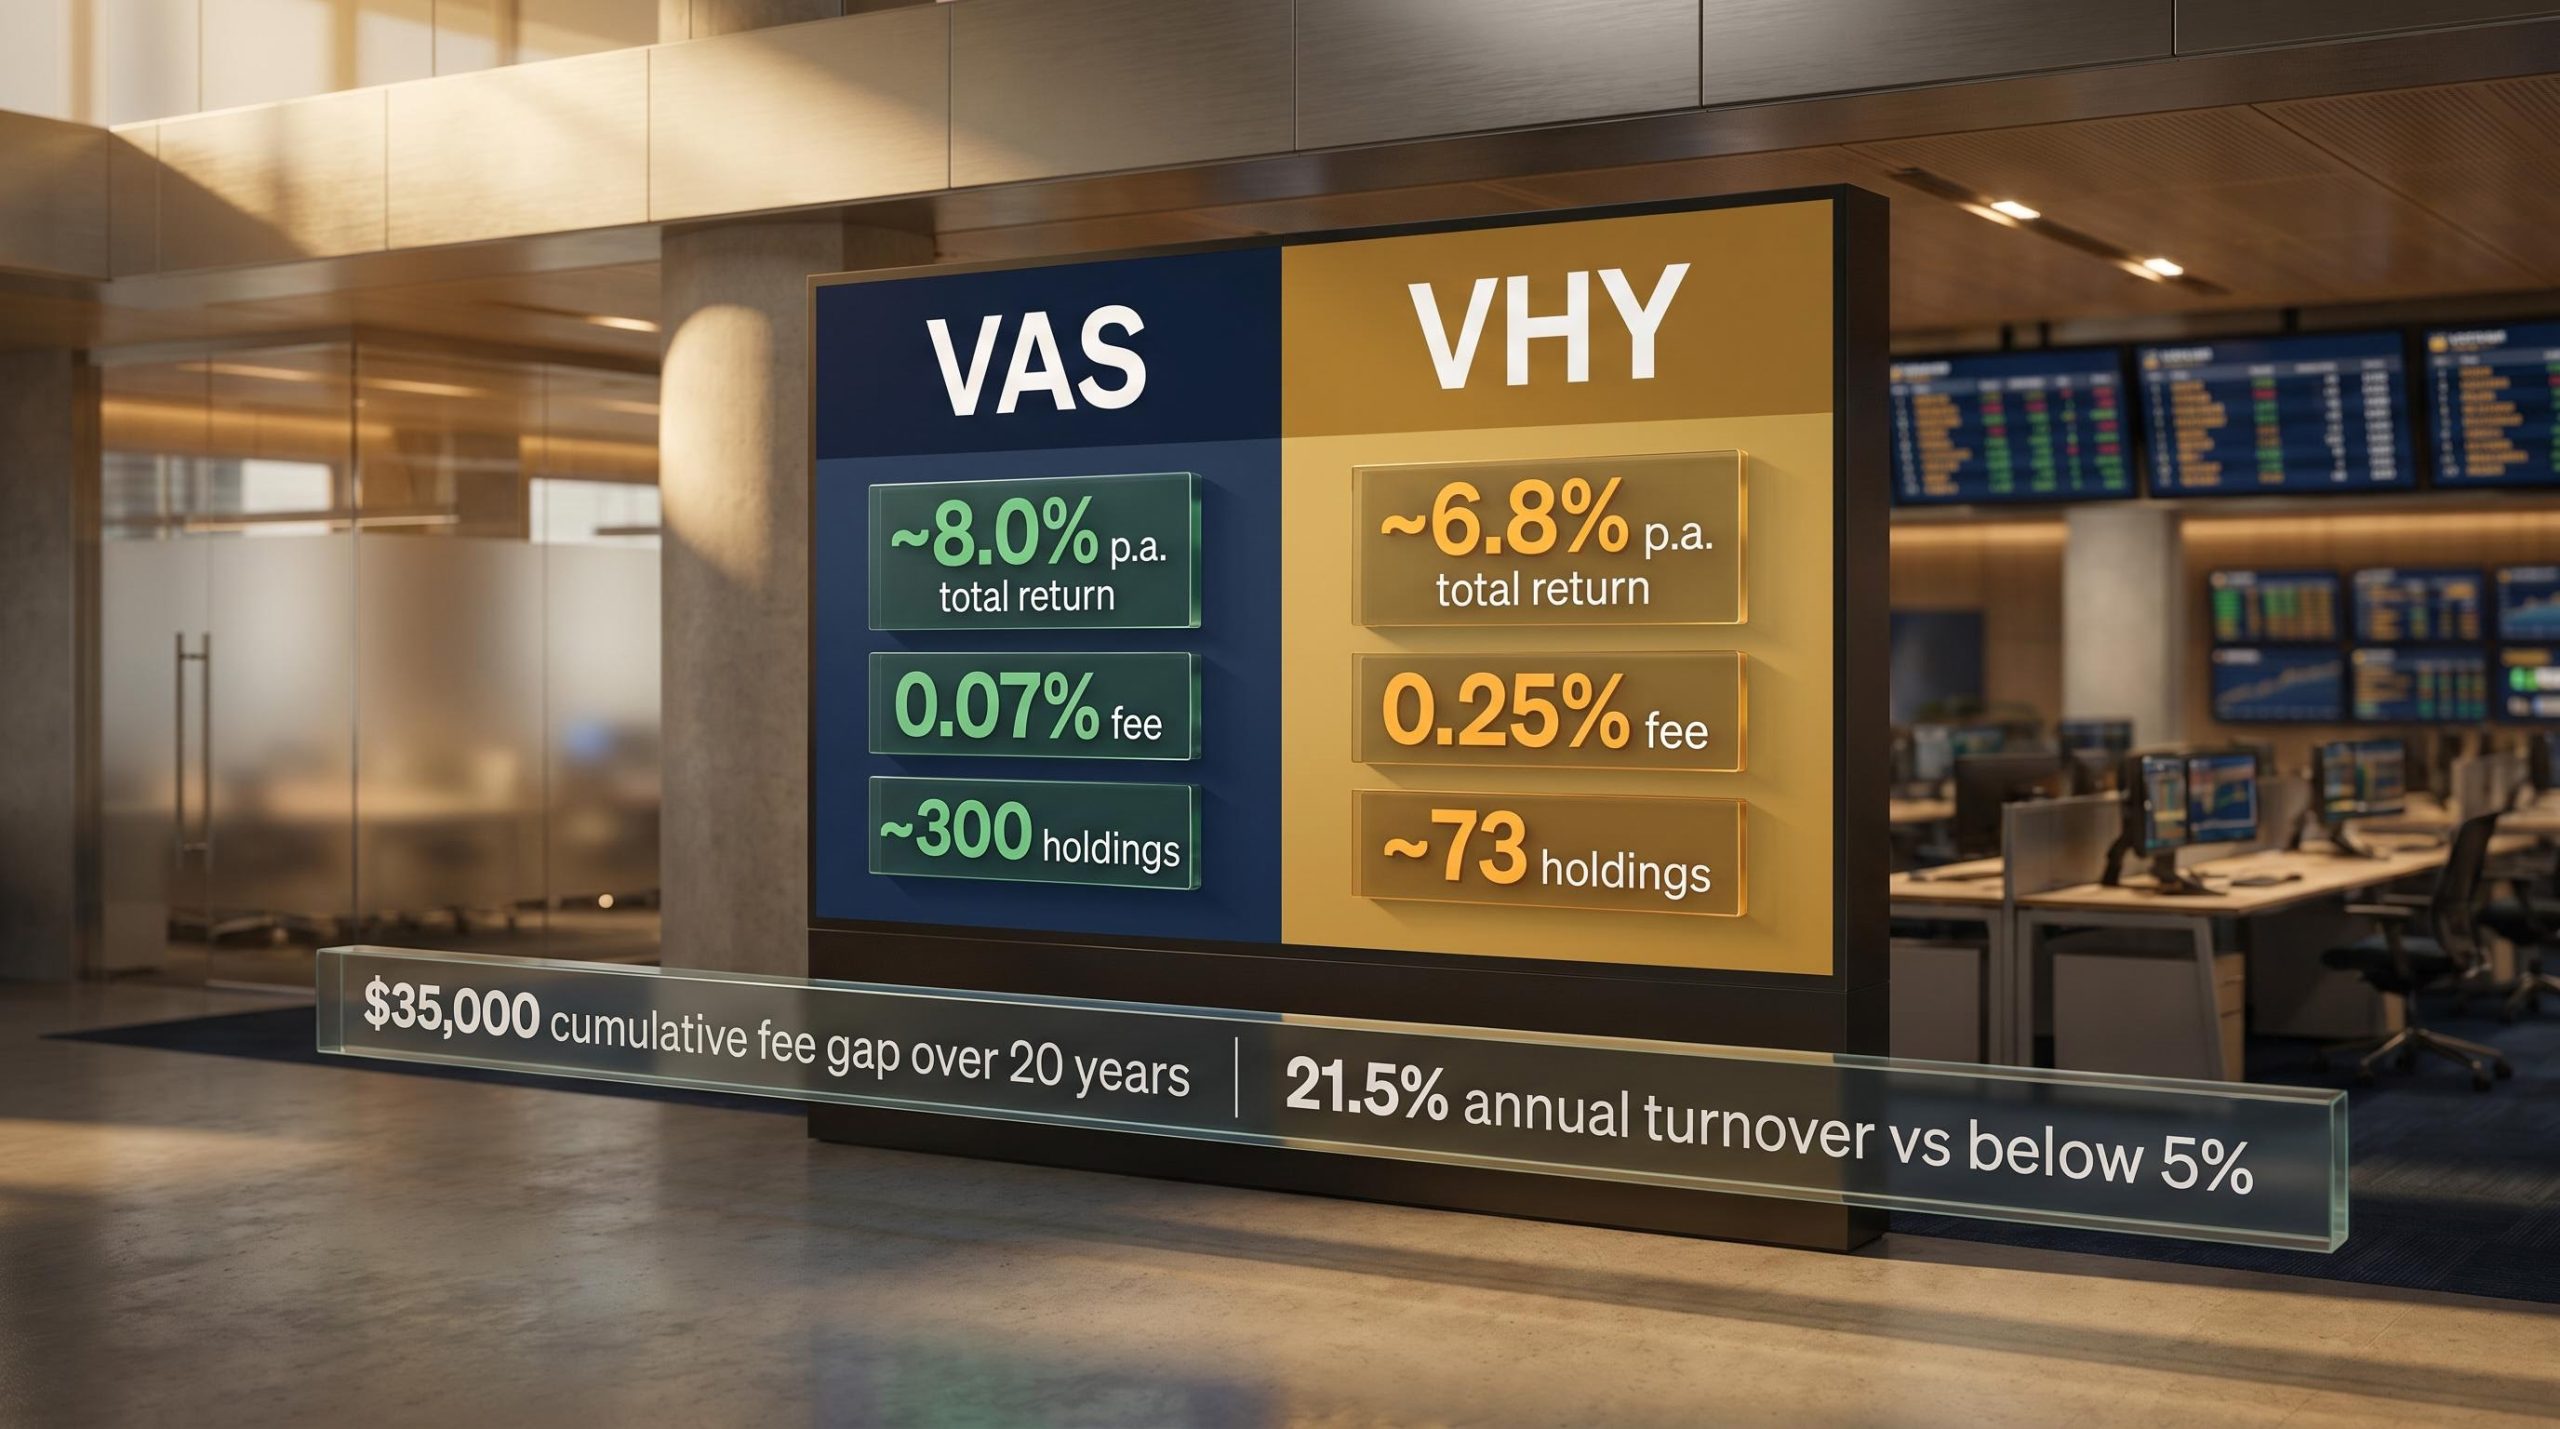
High-dividend portfolios concentrate predictably. The sectors that distribute the most earnings are Financials, Real Estate, Utilities, and Energy. The sectors that led market performance over the decade preceding May 2026 are Technology and Communication Services. A yield-focused strategy systematically underweights the sectors that drove the bulk of equity market returns during the AI-led rally of the prior decade.
Investors evaluating where dividend stocks fit within a broader allocation will find that long-term investment strategies anchored in low-cost index ETFs have returned approximately 9.43% annually over 150 years of S&P 500 data, a baseline that high-dividend portfolios have consistently struggled to match once sector concentration and reinvestment drag are accounted for.
During the February-to-March 2026 correction, the supposed safety of dividend stocks offered minimal protection. The MSCI World High-Dividend Yield Index recorded a peak-to-trough decline of approximately 7.6% (27 February to 20 March 2026), compared with approximately 8.9% for the MSCI World Index (25 February to 30 March 2026), according to FactSet data as of 7 May 2026. The difference was marginal. Global equities recovered to all-time highs around mid-April 2026; high-dividend stocks had not yet returned to comparable levels as of early May 2026.
Then there is the yield-trap problem. A high yield sometimes signals business stress rather than shareholder generosity. When a company’s share price falls sharply, the yield rises arithmetically even if the dividend itself is unchanged. Investors screening for high yield can inadvertently select for deteriorating businesses.
Vanguard’s research on dividend yield traps reaches the same conclusion from an institutional perspective, finding that the highest-yielding securities have historically achieved that status through share price underperformance rather than through financial strength, which is precisely the selection bias that mechanically high-yield screens fail to filter out.
| ETF / Index | Approximate yield | Performance trend vs. benchmark |
|---|---|---|
| SCHD (Schwab U.S. Dividend Equity ETF) | ~3.5% | Trails S&P 500 on total return over multi-year periods |
| VYM (Vanguard High Dividend Yield ETF) | ~2.9% | Lags broad market benchmarks over 3-year and 5-year horizons |
| HDV (iShares Core High Dividend ETF) | ~3.4% | Underperforms MSCI World across measured periods |
| MSCI World High-Dividend Yield Index | ~3.5-3.75% | Trails MSCI World total return, especially during growth-led rallies |
Note: Figures are approximate and directional. Investors should verify against current ETF provider factsheets for precise data.
The passive-income framing carries one final structural flaw: dividends are not contractually guaranteed. Companies reduce or eliminate them during periods of financial stress, precisely when income-dependent investors are most exposed.
Boeing suspended its dividend in March 2020 as the 737 MAX production crisis collided with COVID-19 financial pressure. It was the company’s first dividend suspension since 2012. Intel suspended its dividend entirely starting Q4 2024, announced on 1 August 2024, to redirect capital toward AI semiconductor fabrication investment. Prior to the suspension, Intel offered a yield of approximately 2.1%. The announcement accompanied a significant negative stock price reaction.
Both cases followed the same pattern. The income stream disappeared at the same time the share price fell in response to the announcement.
Dividend cuts deliver a double blow: the income stream disappears at the same time the share price typically declines in response to the announcement. Investors who depend on dividends for income face simultaneous income loss and capital loss.
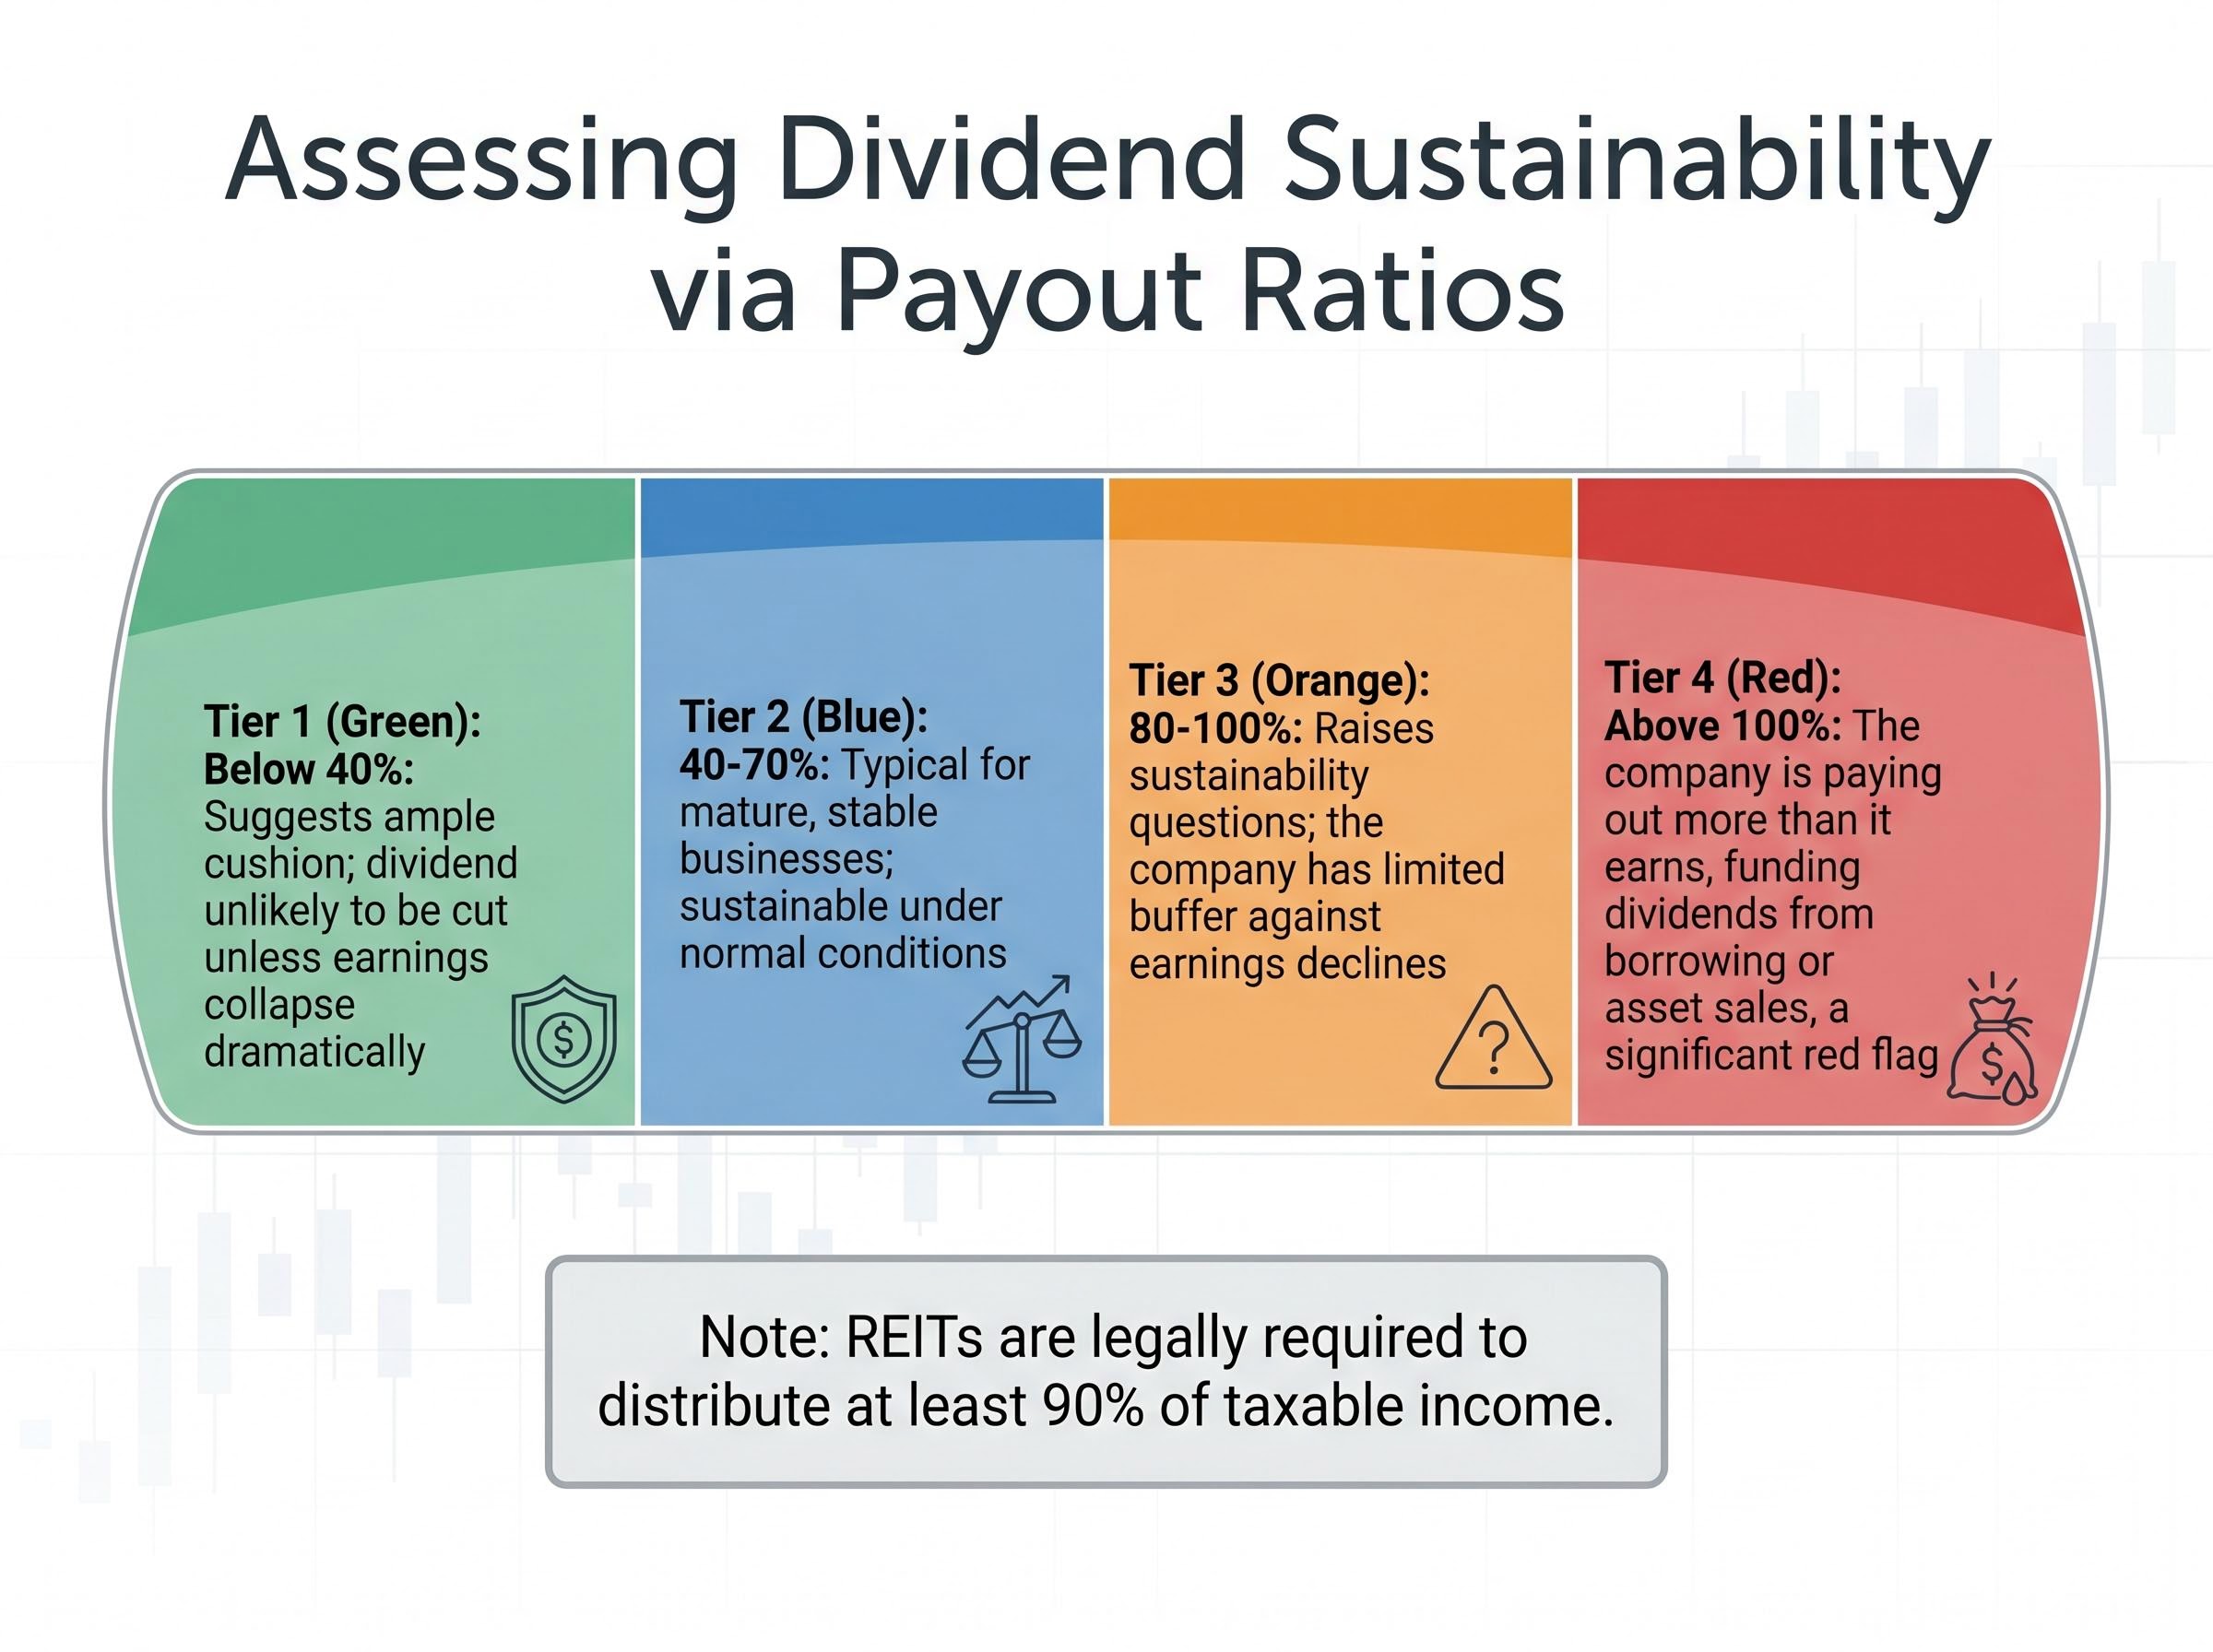
The payout ratio, calculated as dividends paid divided by earnings per share, is the primary forward-looking tool investors have for assessing sustainability before a cut occurs:
REITs (Real Estate Investment Trusts) are legally required to distribute at least 90% of taxable income, so high payout ratios are sector-normal for REITs and must be evaluated in that context.
The corrective is not to reject dividends. It is to place them within the correct framework.
Dividends are one component of total return, not a bonus on top of it. The investor’s question should be whether total return justifies the allocation, not whether yield is high. Research by Hartzmark and Solomon found that retail investors who over-allocated to dividend stocks experienced approximately 3.1% annualised return drag versus the S&P 500.
Investors wanting to see how this performance gap plays out across a full decade of backtested data will find our full explainer on dividend investing vs total return, which models a $100,000 portfolio across both strategies from 2016 to 2025, quantifies the compounding shortfall, and walks through the 2026 rate environment where high-yield savings accounts are now outpacing the S&P 500 Dividend Aristocrats yield.
In taxable accounts, dividends trigger a tax event on receipt regardless of whether the investor wanted the income. Unrealised capital gains, by contrast, defer tax until the investor sells. This forced realisation reduces compounding efficiency relative to growth strategies held in the same tax environment.
In the United States, qualified dividends are taxed at long-term capital gains rates (0%, 15%, or 20% depending on income). Ordinary dividends face income tax rates up to 37%. Most countries impose withholding taxes on dividends paid to foreign investors, typically 15-30%, further reducing after-tax yield relative to the headline figure.
Franking credits create a materially different tax outcome for Australian investors: a fully franked dividend has corporate tax already paid at 30%, and eligible shareholders, including SMSFs in pension phase and retirees below the tax threshold, can receive the credit as a direct ATO cash refund, effectively grossing up a $70 cash dividend to $100 of total value.
Dividend Reinvestment Plans (DRIPs) allow shareholders to automatically reinvest cash dividends into additional shares, typically commission-free. The compounding effect of reinvested dividends over decades is substantial. However, tax obligations on the dividend still arise in taxable accounts even when reinvested through a DRIP. And the compounding benefit of reinvestment is not exclusive to dividend strategies: any investor directing cash back into the market captures the same effect.
Before prioritising a dividend stock, investors should consider:
Dividends are a return of capital, not additive income. Total return is the correct benchmark. Sector concentration and tax drag are structural costs that high-yield strategies carry. Dividend reliability is conditional, not guaranteed, as Boeing and Intel demonstrated.
For certain investors, particularly retirees with income needs managed via tax-advantaged accounts, dividends have legitimate utility. That utility comes from the income function, not from the mistaken belief that dividends are free money.
For retirees and income-focused investors who want to model how much capital is actually required to replace a salary with dividend income, our dedicated guide to living off dividends works through the real income formula at multiple yield levels, compares account structures including Roth IRAs, and shows why even a $1 million S&P 500 portfolio produces only around $11,000 a year in dividends before tax.
The practical implication is straightforward: evaluate dividend stocks on total return, payout ratio sustainability, and portfolio diversification. Yield as a standalone number tells an investor almost nothing about whether an allocation will serve them well.
This article is for informational purposes only and should not be considered financial advice. Investors should conduct their own research and consult with financial professionals before making investment decisions. Past performance does not guarantee future results.
When a company pays a dividend, the cash leaves the business and the share price drops by approximately the same amount on the ex-dividend date, meaning total wealth is essentially unchanged at the moment of distribution. The dividend moves value from the share price into the investor's cash account rather than creating new wealth.
The ex-dividend date is the first trading day on which new buyers no longer have a claim to a declared dividend, and it is the date on which the share price adjusts downward by approximately the payout amount. Investors must own the stock before this date to receive the upcoming dividend payment.
Dividend yield measures only the income component of a stock's return, while total return combines both price appreciation and dividends received or reinvested. A stock can show an attractive yield while delivering a negative total return if the share price declines by more than the dividend paid.
Yes, dividends are not contractually guaranteed and can be reduced or eliminated during periods of financial stress. Boeing suspended its dividend in March 2020 during the 737 MAX crisis and COVID-19 pressure, and Intel suspended its dividend entirely starting Q4 2024 to redirect capital toward AI semiconductor investment.
A payout ratio above 80% raises sustainability questions because the company has limited buffer against earnings declines, and a ratio above 100% is a significant red flag indicating the company is funding dividends through borrowing or asset sales rather than earnings. A payout ratio below 40% generally suggests the dividend has ample cushion and is unlikely to be cut under normal conditions.