
Why Most Wealth-Building Strategies Aren’t Built for You
4 hrs ago

QBE Insurance Group is trading at approximately AUD 22.62 as of May 2026, sitting comfortably within a 52-week range of AUD 18.57 to AUD 24.20. The share price chart tells one story. The financials tell a richer one: a 19.8% return on equity in FY2025, a conservative debt profile, and a dividend payout policy that has held steady through multiple insurance cycles. For Australian investors evaluating income-generating ASX stocks, the metrics that separate a mature global insurer from a high-growth technology company are not interchangeable. QBE, with roots stretching back to a marine insurer in Townsville in the 1800s and operations now spanning 27 countries, offers a detailed case study in how to read a blue-chip financial profile. This article walks through the specific financial metrics investors use to evaluate established, dividend-paying companies, using QBE’s publicly available FY2024 and FY2025 results as real-world reference points throughout.
Most investors start with the same instinct: find the numbers, compare them, decide. The problem is that the numbers worth comparing change entirely depending on what kind of company is on the screen. A fast-growing technology company and a mature global insurer are asking fundamentally different things of an investor’s capital.
Growth stocks are assessed primarily on revenue expansion, profit trajectory, and future earnings potential. The investor is buying upside: the possibility that today’s losses become tomorrow’s outsized returns. Blue-chip stocks ask a different question. The investor is buying reliable compounding and income, and the metrics that matter reflect that: capital efficiency, income consistency, and balance sheet conservatism.
The three-metric framework applied throughout this article sits within a broader set of fundamental analysis metrics that investors use across every sector, including P/E ratio, EPS, and profit margins, each of which answers a different question about the same company and can expose weaknesses that ROE alone leaves hidden.
Key evaluation metrics for growth stocks:
Key evaluation metrics for blue-chip income stocks:
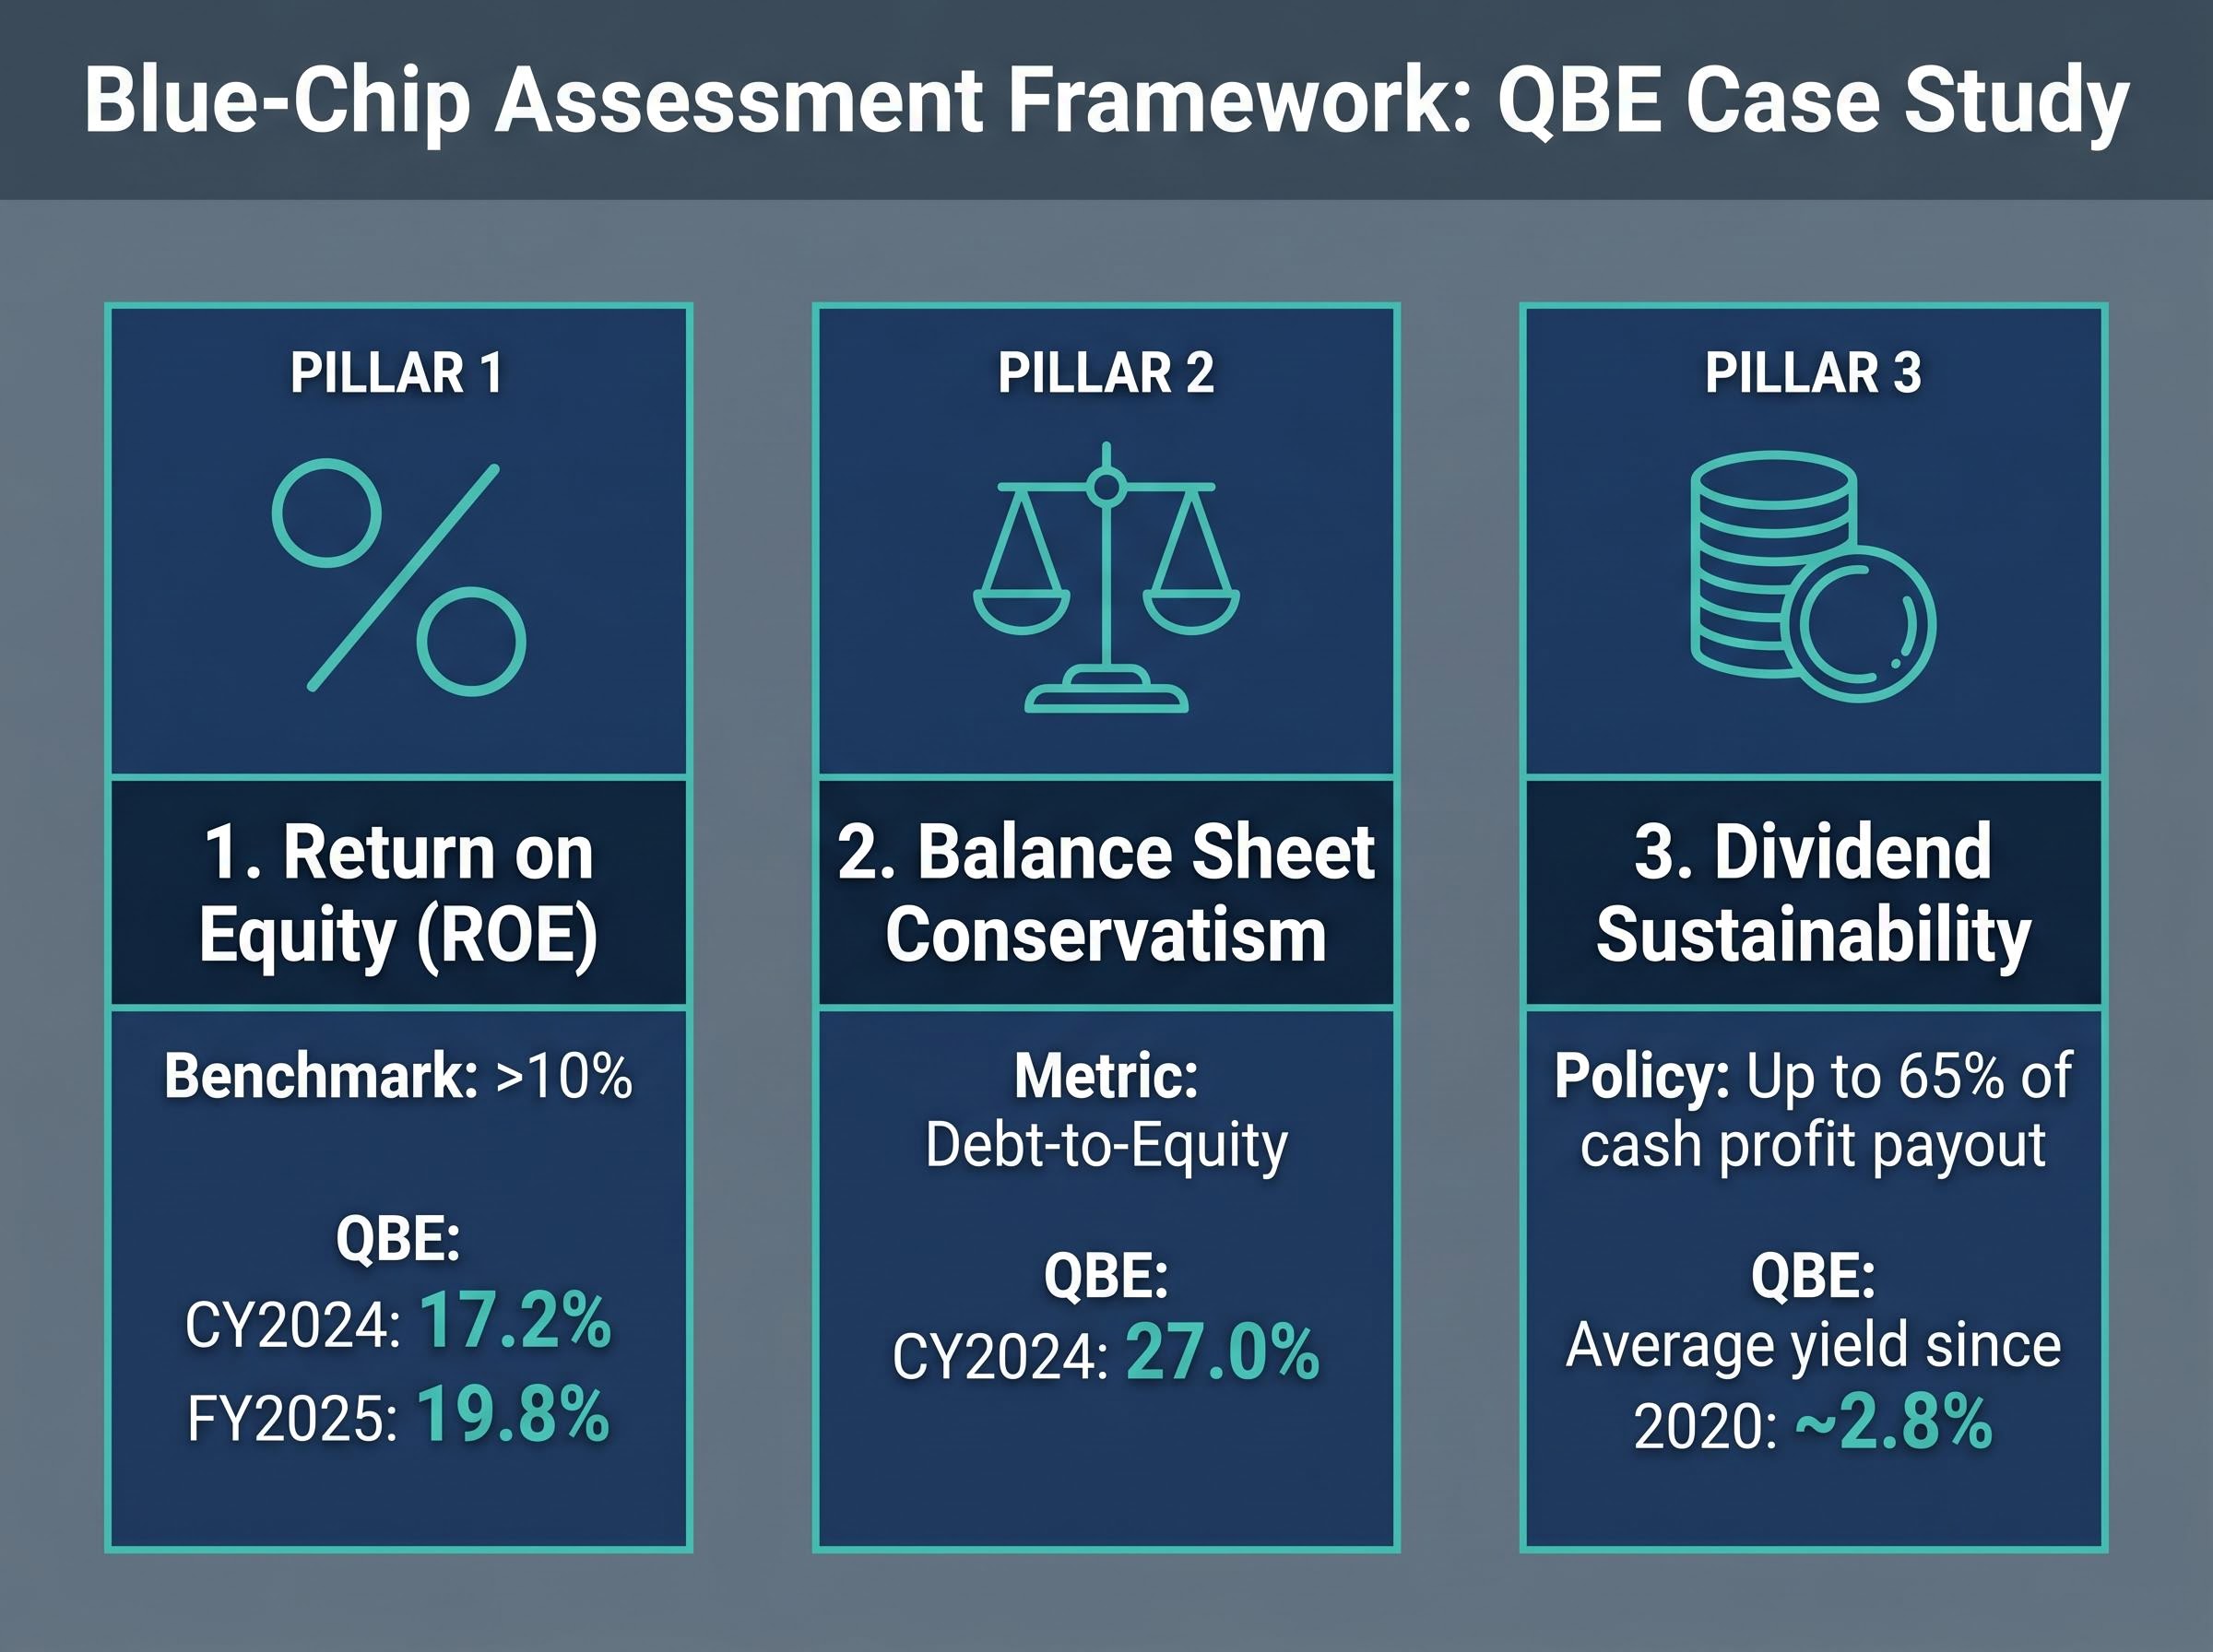
A conventional benchmark for mature Australian businesses is an ROE above 10%. QBE’s CY2024 cash ROE of 17.2% and FY2025 adjusted ROE of 19.8% both clear that bar comfortably. This framework applies broadly to mature ASX-listed financials, not just insurers. The three metrics listed above form the evaluation structure for the remainder of this article.
QBE began as a marine insurer in Townsville in the late 1800s. The company that exists today bears little resemblance to that origin, having grown into a global insurance group operating across 27 countries with three core divisions: North America, International (including Europe), and Australia Pacific.
What distinguishes QBE from most ASX blue-chips is where its revenue actually originates. The majority is earned outside Australia.
Approximately 30% of QBE’s revenue comes from Australia, approximately 30% from the United States, with the balance predominantly from European markets.
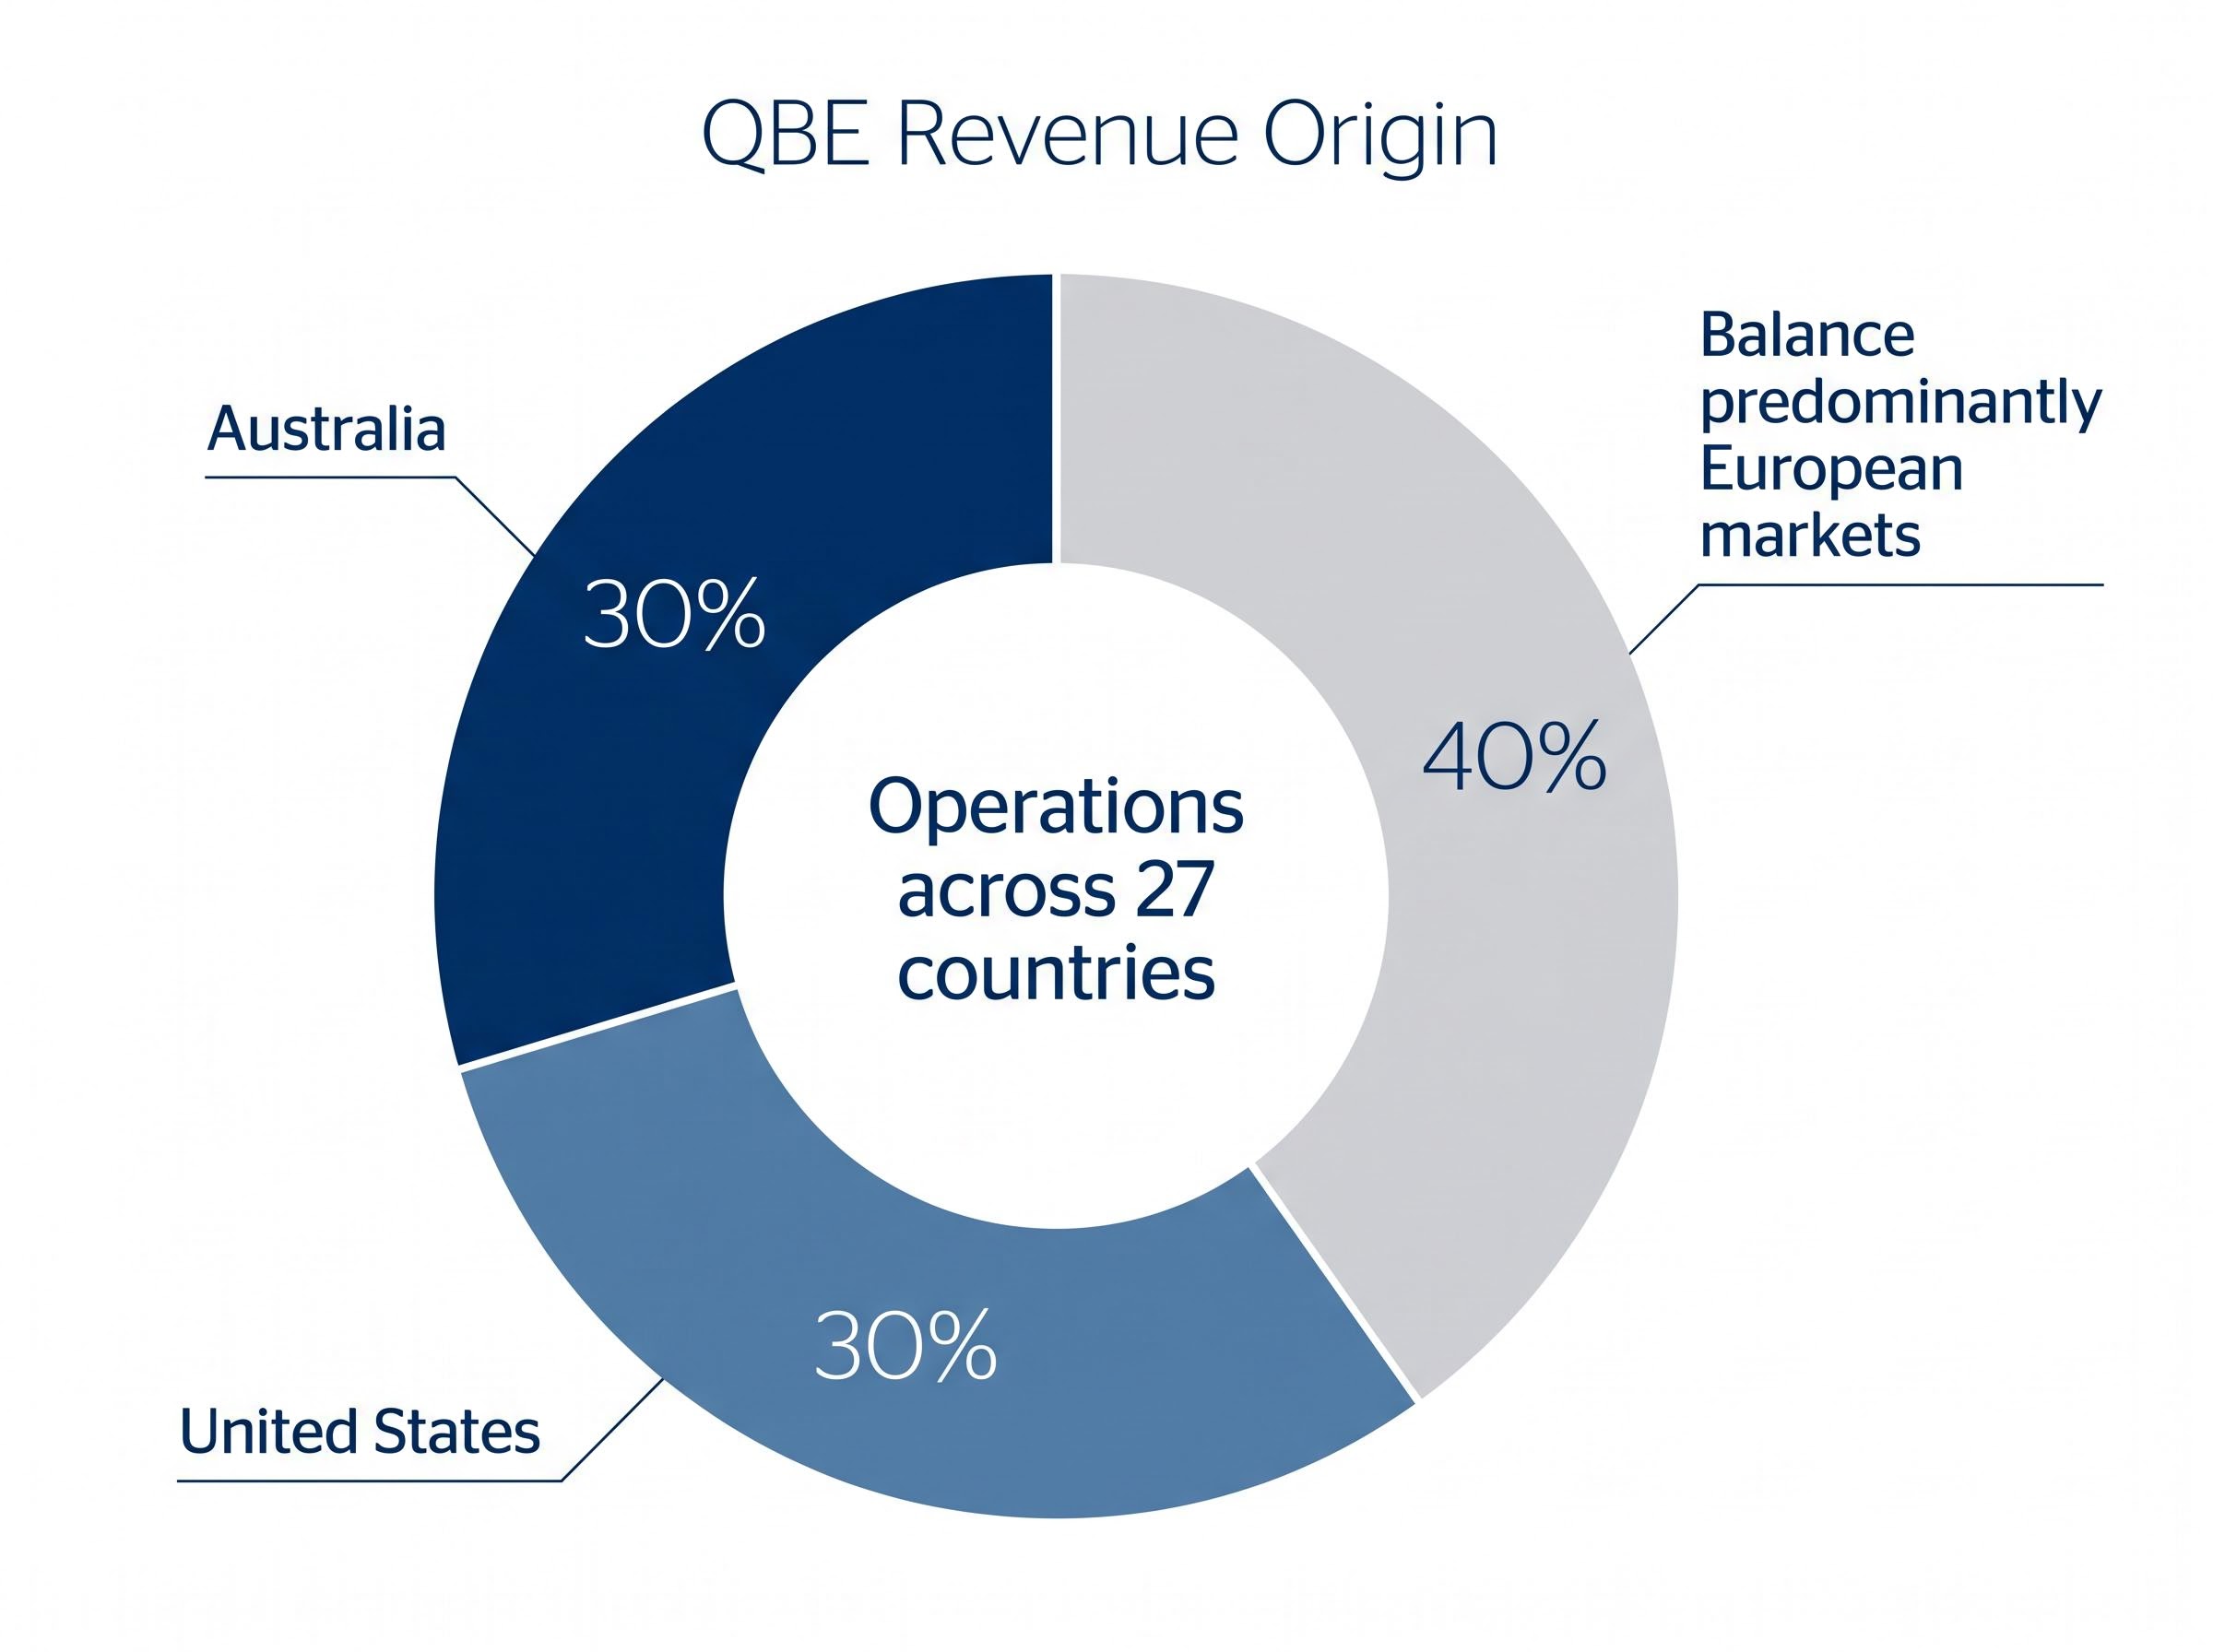
This geographic split delivers diversification, but it also embeds currency risk and exposure to regulatory environments across multiple jurisdictions. QBE’s product categories span commercial, consumer, reinsurance, and agricultural insurance, covering a broad base of premium income rather than concentrating in a single line.
As of May 2026, QBE trades at approximately AUD 22.62, within a 52-week range of AUD 18.57 to AUD 24.20. That range reflects a market that has re-rated the stock significantly from its lows over the past twelve months, driven by strong earnings momentum and the broader tailwind of higher interest rates flowing through to insurer investment portfolios.
Return on equity measures how much profit a company generates from each dollar of shareholder equity, expressed as a percentage. If a company has $100 in shareholder equity and earns $15 in profit, its ROE is 15%. The higher the figure, the more efficiently the business is converting capital into returns.
For mature Australian businesses, an ROE above 10% is the conventional benchmark for capital efficiency. It signals that management is generating returns above the cost of equity, which means the business is creating value for shareholders rather than eroding it.
The RBA research on ROE and cost of equity for financial firms provides institutional context for why the 10% benchmark carries weight as a capital efficiency threshold, documenting how returns above the cost of equity signal genuine value creation rather than capital erosion across Australian financial services businesses.
QBE’s recent results sit well above that threshold.
| Metric | FY2024 | FY2025 | Analyst Through-Cycle Outlook |
|---|---|---|---|
| Adjusted ROE | 17.2% | 19.8% | Low-to-mid teens |
| Group COR | 92.8% | — | Low 90s target |
| Underlying COR | 91.5% | — | — |
The combined operating ratio (COR) measures the proportion of premium income consumed by claims and expenses; a figure below 100% indicates underwriting profitability. QBE’s group COR improved from 93.7% in FY2023 to 92.8% in FY2024, with an underlying COR of 91.5%.
Analysts broadly view these ROE figures as above-cycle performance. Morningstar characterised the FY2024 result as “well above our midcycle assumption,” while projecting returns would settle lower as catastrophe experience normalises and rate momentum slows.
Morningstar expects QBE’s ROE to remain “comfortably above 10% through the cycle.”
Macquarie, Citi, and Morgans have each projected normalisation toward the low-to-mid teens as pricing decelerates. The distinction between a peak-cycle ROE and a through-cycle ROE matters for income investors: understanding that 19.8% reflects favourable conditions, rather than a new permanent baseline, helps set realistic expectations for future returns.
Before committing capital to an income stock, two linked questions matter. First, can the company sustain its earnings through a downturn without the balance sheet coming under pressure? Second, does the dividend policy reflect genuine financial discipline, or is it stretching to meet market expectations?
QBE’s CY2024 debt-to-equity ratio stands at 27.0%. In practical terms, for every AUD 100 of shareholder equity, QBE carries AUD 27 of debt. This is a conservative figure.
For insurers, balance sheet strength carries particular weight because the business model involves holding reserves to pay future claims. A company with excessive leverage in an insurance downturn, when catastrophe claims spike or investment portfolios decline, faces the risk of needing to raise capital at the worst possible time. QBE’s 27.0% ratio signals a business that holds substantially more equity than debt, consistent with the capital management discipline expected of a blue-chip financial.
The APRA capital adequacy standards for general insurers, including GPS 110, set the minimum capital requirements that Australian-licensed insurers must maintain, which is why a conservative debt-to-equity ratio carries regulatory as well as financial significance for companies like QBE operating in this market.
QBE’s dividend payout policy targets up to 65% of cash profit, a framework that has remained unchanged across both the FY2024 and FY2025 reporting periods. The key dividend facts for the most recent full-year period:
The 30% franking level is a point worth noting for Australian income investors. Domestic peers such as Insurance Australia Group (IAG) and Suncorp have historically offered more fully franked dividends. For investors who rely heavily on franking credits to optimise after-tax returns, QBE’s partial franking reduces the effective yield advantage relative to those peers. This reflects QBE’s significant offshore earnings base: profits generated outside Australia do not carry Australian franking credits.
A Morgans analyst, quoted in The Australian in February 2025, predicted dividends “should grow mid-single digits annually over the medium term,” describing QBE as “one of the better placed yield names in the financials complex.”
QBE’s current price of approximately AUD 22.62 sits near the upper end of its 52-week range (AUD 18.57 to AUD 24.20). The market has already substantially re-rated the stock from its recent lows, reflecting the strong FY2024 and FY2025 results and the broader re-rating of ASX insurers.
This creates an analytical tension. Strong financial metrics do not automatically make a stock a good entry point if those metrics are already reflected in the price. The question for income investors is not whether QBE is a well-run business; the ROE, debt profile, and dividend history answer that clearly. The question is whether the current share price leaves sufficient margin for the returns an investor is targeting.
The Australian Financial Review observed in February 2025 that QBE’s share price “already prices in much of the good news.”
Macquarie maintained an Outperform rating following FY2024 results with a 12-month target price of A$23.00, suggesting limited capital upside from current levels but continued income appeal. The Motley Fool, writing in February 2025, described the valuation as “reasonable for long-term, income-focused investors who can handle insurance-cycle volatility.”
The variable that could compress both earnings and the share price from here is insurance-cycle risk: a deterioration in catastrophe experience, deceleration in premium rate increases, or a combination of both. These are the conditions under which the peak-cycle ROE figures normalise toward the low-to-mid teens that analysts project, and where the share price may follow.
This section does not deliver a buy or sell verdict. What it models is the analytical discipline of separating “good business” from “good buy at this price,” a distinction that applies to every mature income stock, not just QBE.
QBE’s financial profile offers a worked example of how three metrics, held together rather than in isolation, build a coherent picture of a mature income stock. A CY2024 ROE of 17.2% (rising to 19.8% in FY2025), a debt-to-equity ratio of 27.0%, and an average dividend yield of approximately 2.8% since 2020: each figure tells part of the story, but none tells the whole story alone.
The three-step framework used throughout this article applies to any mature ASX income stock:
These metrics represent a starting point, not a complete valuation. Full investment analysis requires additional work across areas including competitive positioning, management quality, regulatory risk, and current valuation relative to intrinsic value.
The broader ASX insurance sector, including IAG and Suncorp, offers comparable case studies for practice. Commentary from the AFR and The Australian has positioned these three insurers as “interest-rate-leveraged income stocks” offering partial inflation protection. Platinum Asset Management noted in its Q4 2024 commentary that higher yields “significantly improve the economics of the traditional insurance model.”
ASX sector concentration in financials and materials, the structural feature that explains much of the gap between ASX and S&P 500 long-run returns, is also the reason investors applying the blue-chip income framework developed here will find a relatively small universe of genuinely comparable candidates outside the banking and insurance segments.
Applying this framework across multiple companies, rather than anchoring to a single name, is where the real analytical skill develops.
This article is for informational purposes only and should not be considered financial advice. Investors should conduct their own research and consult with financial professionals before making investment decisions. Past performance does not guarantee future results. Financial projections are subject to market conditions and various risk factors.
Blue chip investing focuses on mature, established companies that offer reliable income and capital efficiency, assessed through metrics like return on equity, debt-to-equity ratio, and dividend yield history. Growth investing, by contrast, prioritises revenue expansion and future earnings potential, often in companies that are not yet consistently profitable.
QBE reported a cash ROE of 17.2% in FY2024 and an adjusted ROE of 19.8% in FY2025, both well above the conventional 10% benchmark for mature Australian businesses. Return on equity measures how efficiently a company converts shareholder capital into profit, making it a key indicator of capital efficiency for income-focused investors.
QBE's CY2024 debt-to-equity ratio stands at 27.0%, meaning the company carries AUD 27 of debt for every AUD 100 of shareholder equity, which is considered a conservative and financially disciplined level. For insurers in particular, a low debt-to-equity ratio is important because the business model requires holding reserves to pay future claims, and excessive leverage can become dangerous during downturns.
QBE targets a dividend payout of up to 65% of cash profit, with a total ordinary dividend of AUD 0.86 per share in FY2024 and an average annual dividend yield of approximately 2.8% since 2020. It is worth noting that QBE's dividends are only 30% franked, which reduces the after-tax yield advantage for Australian investors compared to more fully franked domestic peers like IAG and Suncorp.
When a blue chip stock trades near its 52-week high, it signals the market has already priced in much of the positive news, meaning strong financial metrics do not automatically translate into an attractive entry point. Analysts including Macquarie set a 12-month target of AUD 23.00 following FY2024 results, suggesting limited capital upside from current levels while acknowledging continued income appeal for patient investors.


