How ASX’s CHESS Overhaul Became a $250M Governance Failure
21 hrs ago
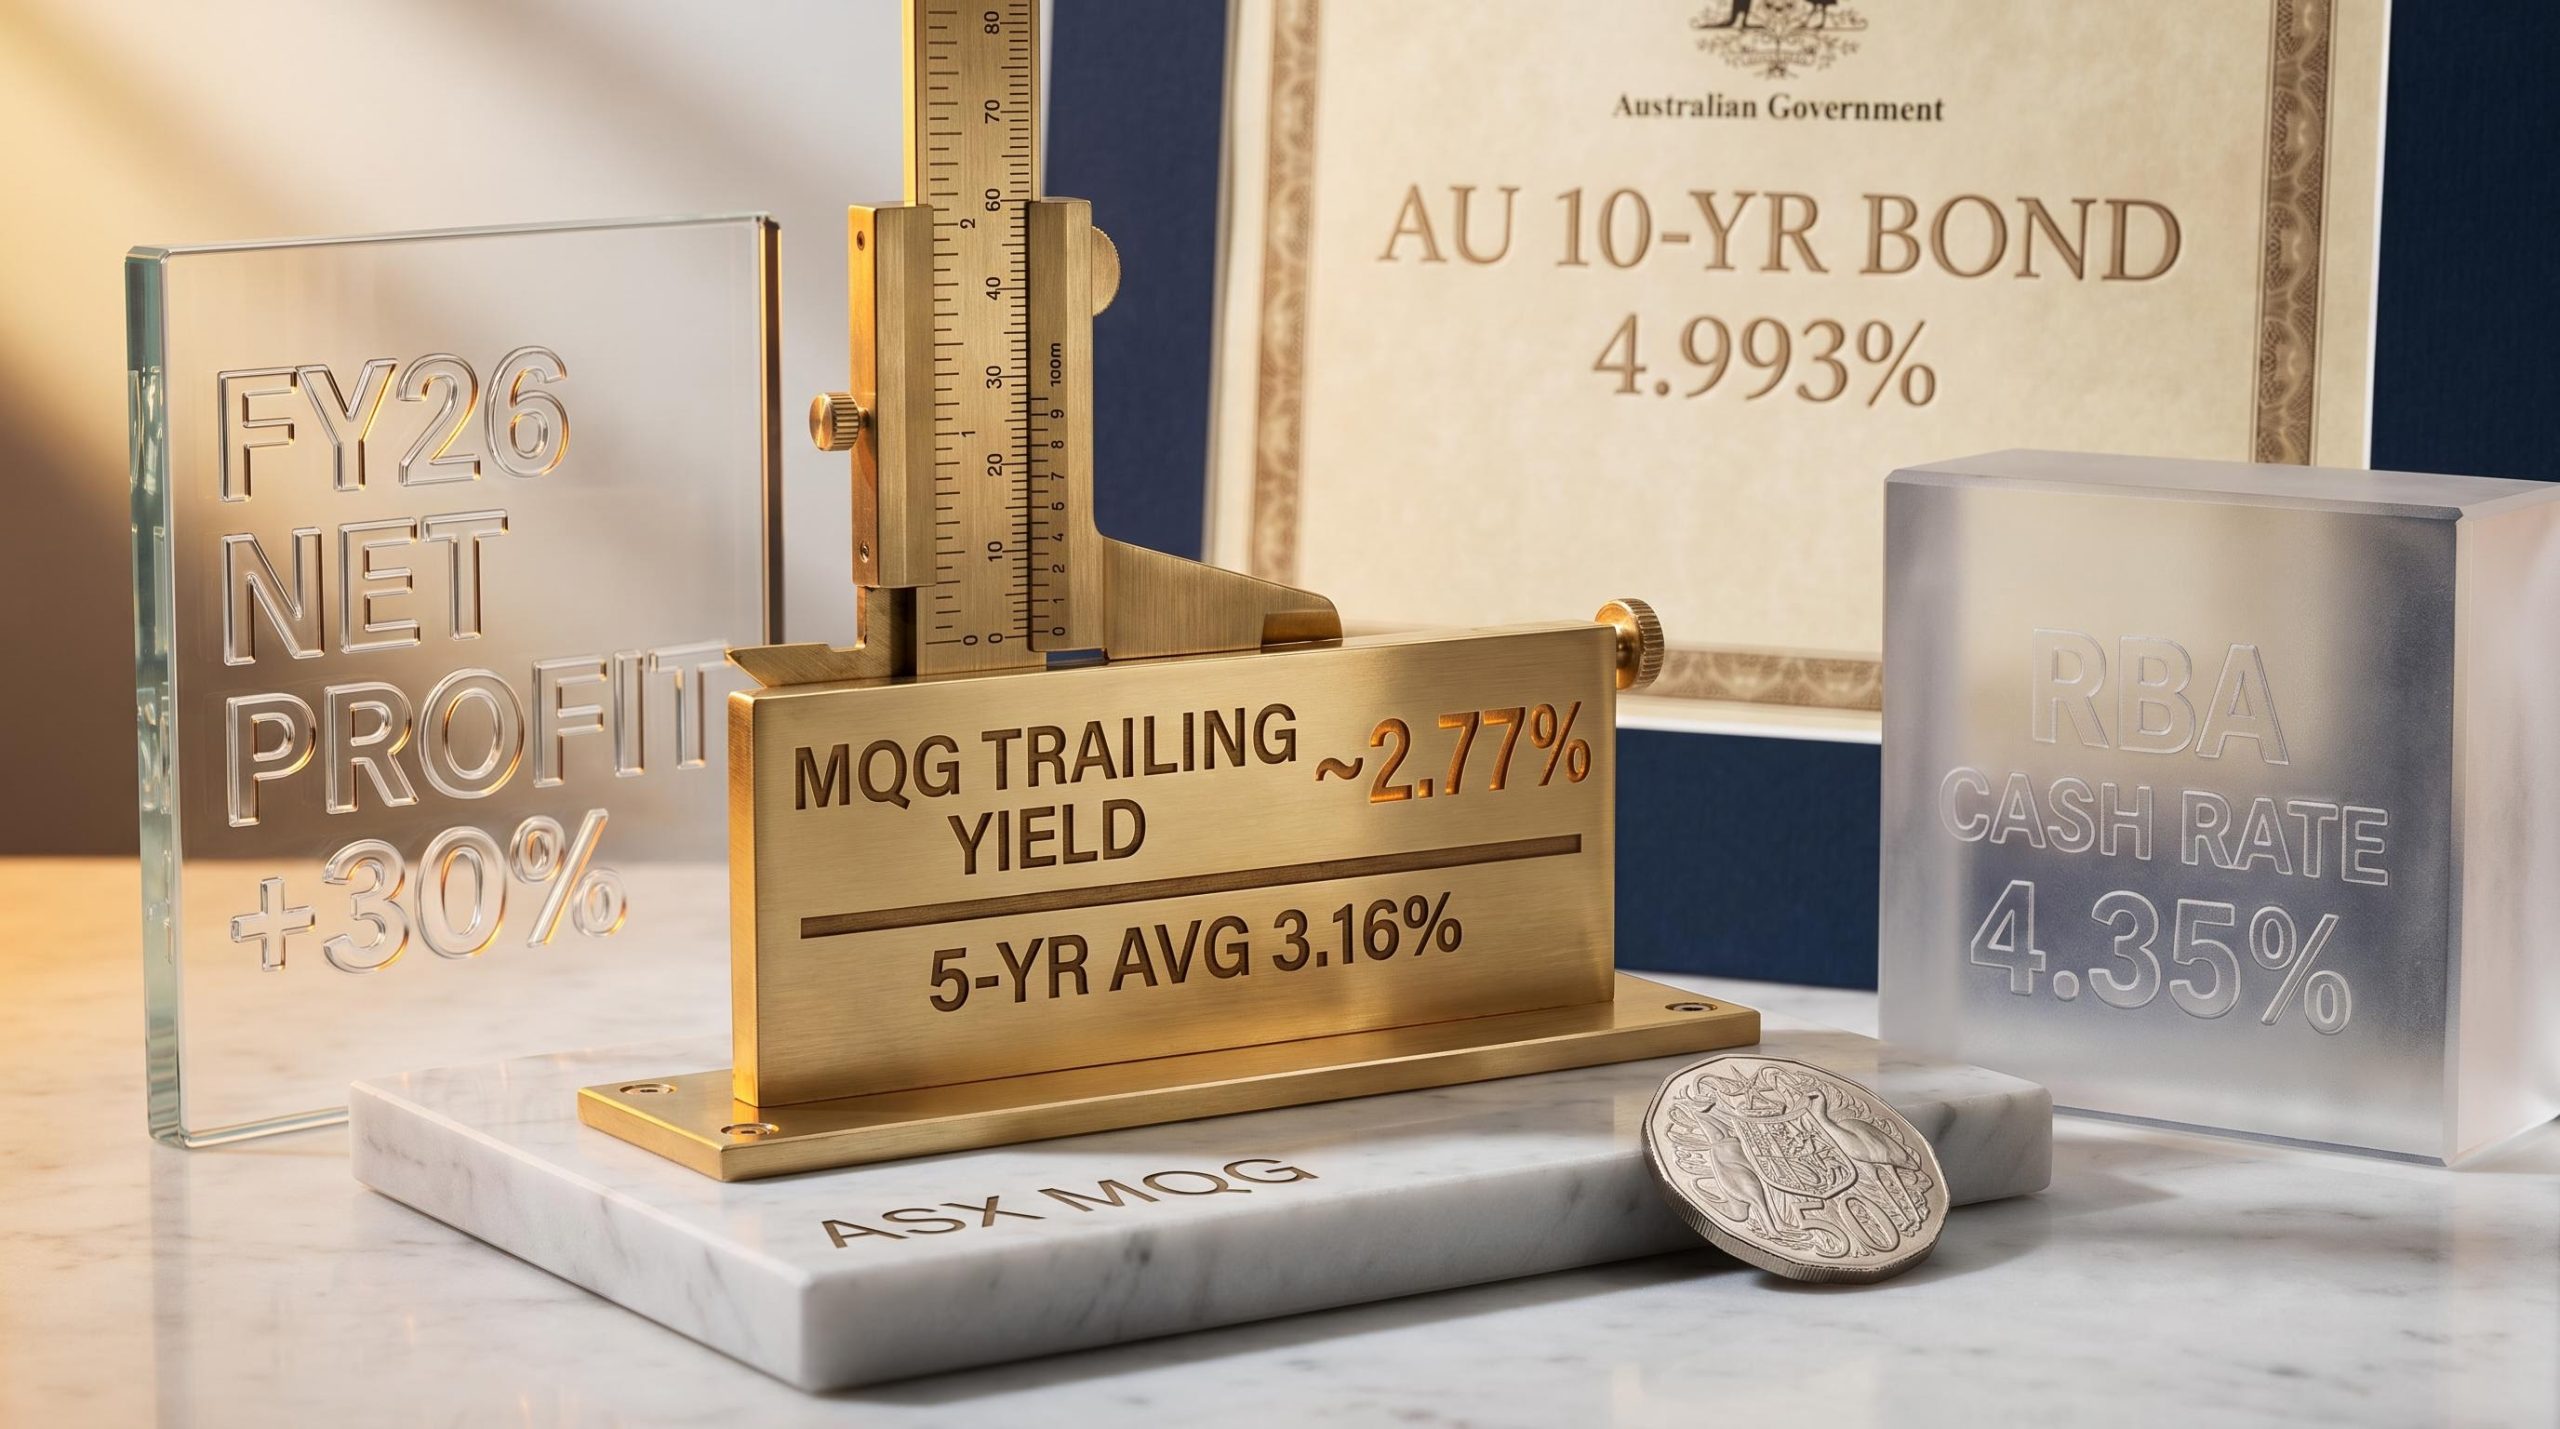
Macquarie Group has paid a dividend every single year for more than 55 years without interruption. Yet right now, its trailing dividend yield of approximately 2.77-2.83% sits meaningfully below both its own five-year historical average and the current RBA cash rate of 4.35%. What does that gap actually tell an investor?
With Australian interest rates elevated and blue-chip financials trading at stretched multiples, investors need frameworks that go beyond price charts. Dividend yield history offers one such framework: a way to use a company’s own income track record as a reference point for current valuation. The approach is straightforward, repeatable, and especially useful for mature businesses with long payout records.
This piece walks through exactly how to apply dividend yield comparison to a mature ASX blue-chip, using Macquarie Group (ASX: MQG) as a live case study. Readers will understand what the method reveals, what it misses, and how to pair it with other tools for a more complete picture.
Dividend yield is often treated as a passive income figure, the percentage return a shareholder receives for holding a stock. But yield also works in the other direction: it is a live signal of how much the market is willing to pay for each dollar of income a company generates.
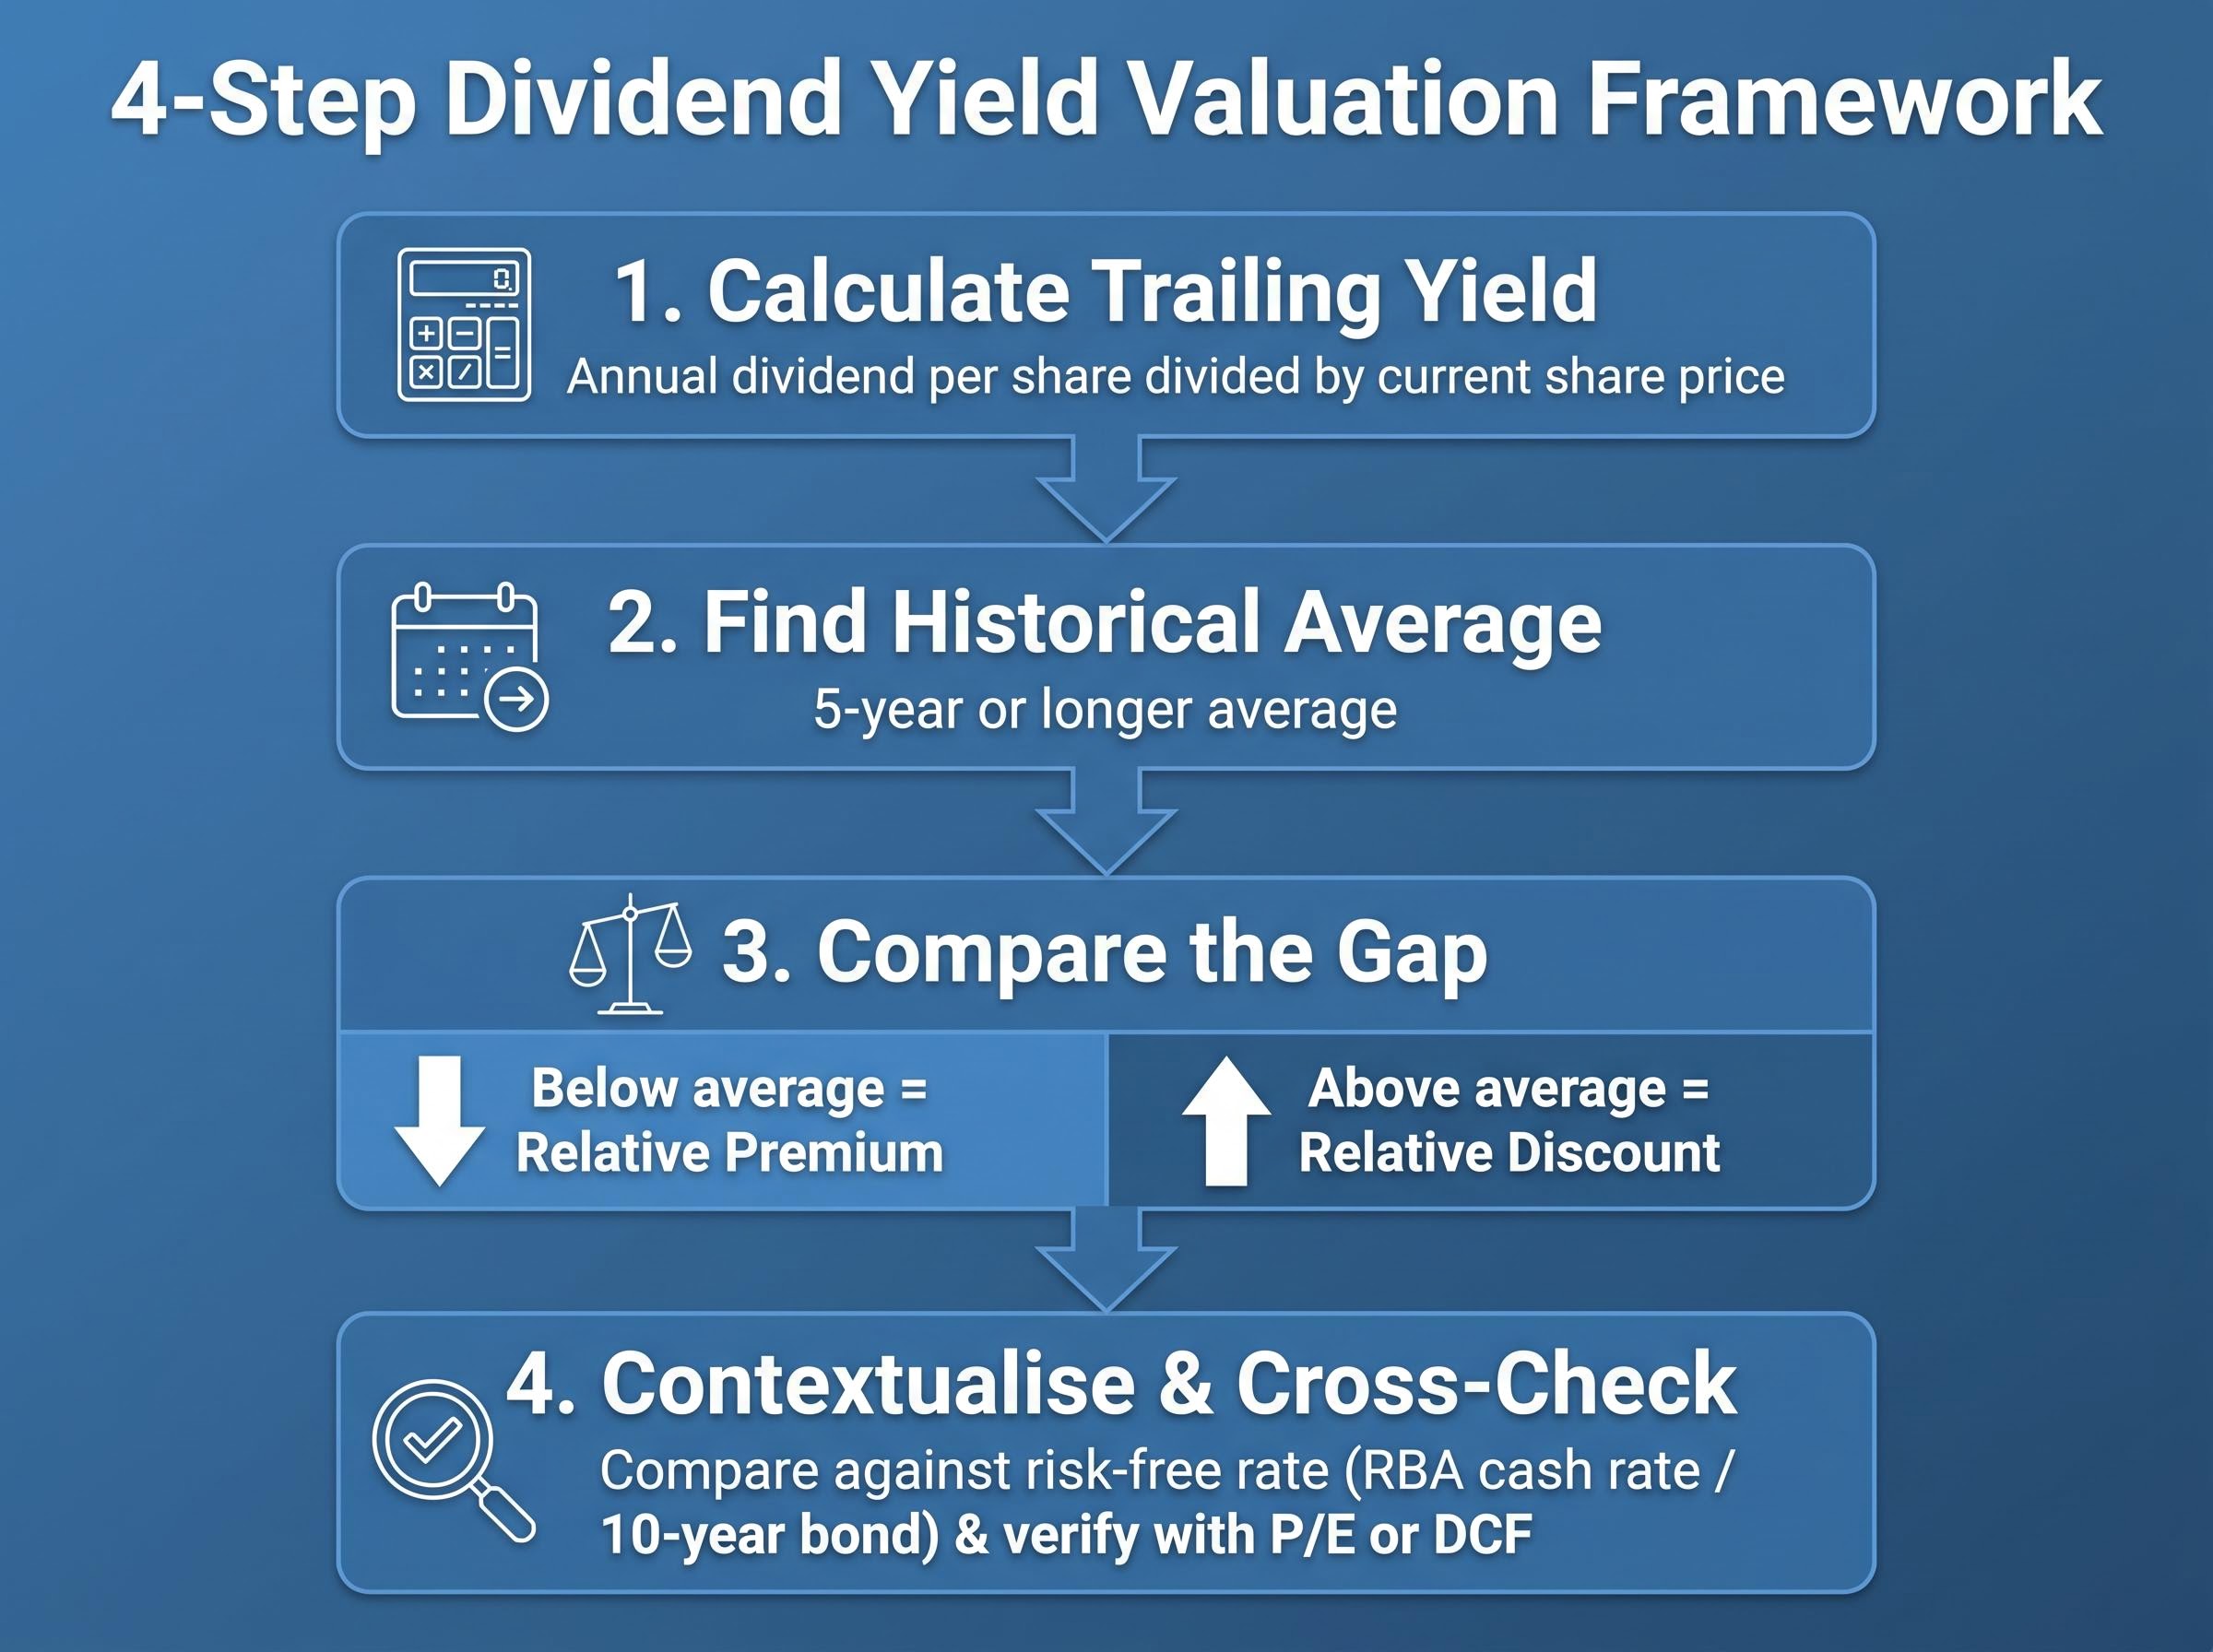
The formula is simple. Annual dividend per share divided by the current share price, expressed as a percentage. When a stock’s price rises faster than its dividend, the yield compresses. When the price lags dividend growth, the yield expands.
That compression or expansion is the basis of the valuation method. Comparing today’s yield to a stock’s own historical average reveals whether current pricing is rich or cheap relative to the income the company has historically delivered.
“When a blue-chip stock’s current yield falls below its own historical average, the market is effectively pricing in more optimism than the income record alone justifies.”
The approach works best for companies with long, stable dividend records, because the historical average is only meaningful if the underlying payout behaviour is consistent. Macquarie Group’s unbroken profitability streak spanning more than 55 years makes it an instructive candidate.
Macquarie Group is a diversified global financial institution founded in 1969, distinct from traditional Australian banks through its combination of investment banking and asset management spanning infrastructure, commodities, agriculture, real estate, and global equities. That diversification matters for dividend analysis: it means earnings capacity is not tied to a single revenue stream.
The earnings picture behind the dividend is strong. Macquarie reported FY26 net profit of A$4.847 billion, up 30% on FY25, with H2 FY26 surging 93% above H1 FY26. Every division recorded double-digit growth.
That profit funds a total FY26 dividend of A$7.00 per share (A$4.20 final plus A$2.80 interim). The final dividend carries 35% franking, with an ex-dividend date of 18 May 2026.
| Metric | Value | Source |
|---|---|---|
| Share price (approx.) | A$237-239 | Yahoo Finance / Reuters, 11 May 2026 |
| P/E ratio (TTM) | 24.39-24.64 | Yahoo Finance / Wisesheets |
| EPS (TTM) | A$9.71 | Yahoo Finance |
| FY26 DPS (total) | A$7.00 | Macquarie Investor Relations |
| Payout ratio | 66.99-70.13% | Yahoo Finance / Digrin |
| Trailing dividend yield | ~2.77-2.83% | Yahoo Finance / Morningstar |
The share price of approximately A$237-239 as of 11 May 2026 places the stock roughly 27.4% above its 52-week low. The payout ratio of 66.99-70.13% sits at the upper end of Macquarie’s stated 50-70% policy range, a detail that becomes relevant when assessing dividend sustainability.
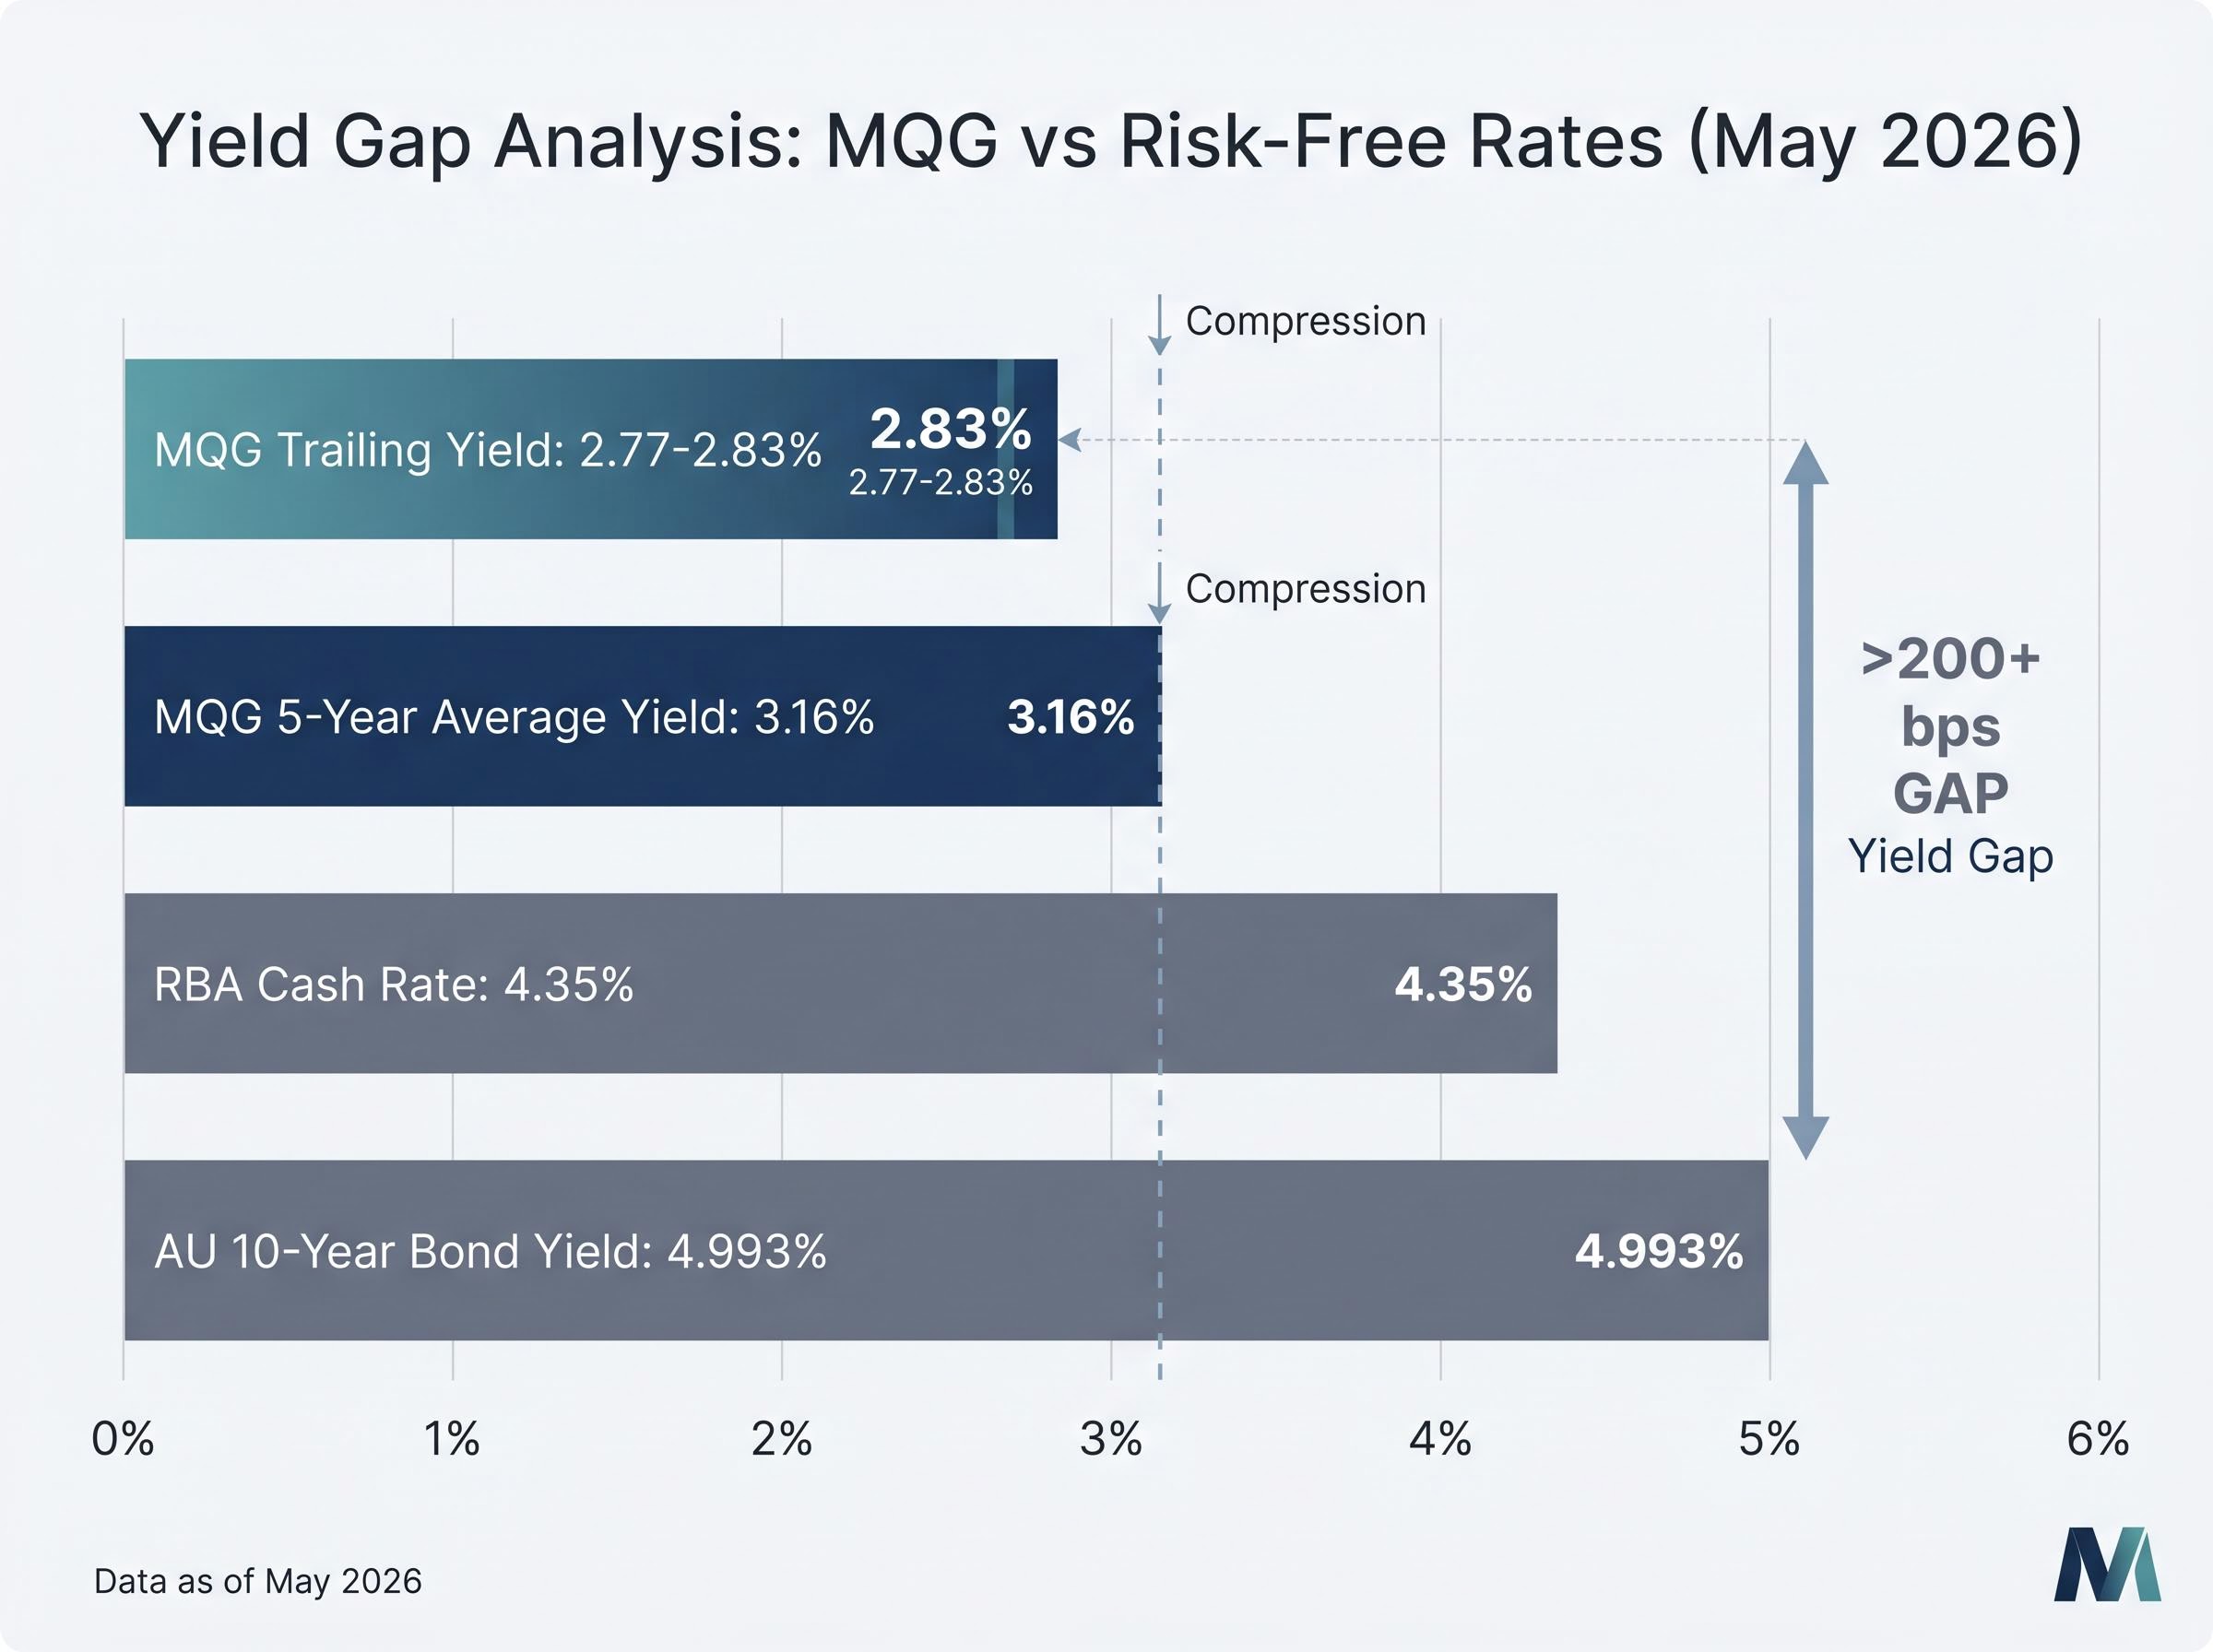
Start with the trailing yield: approximately 2.77-2.83%, depending on the source (Yahoo Finance and Morningstar, as of 11 May 2026). Now compare that to the five-year historical average of approximately 3.16%.
The gap is roughly 33-39 basis points. It is not dramatic in isolation, but in valuation terms it carries a clear implication. A yield sitting below its historical average means the stock’s current price is elevated relative to the income it has historically delivered per dollar invested. Investors are paying more for each dollar of dividend than they have, on average, over the past five years.
The forward yield range widens the picture further: approximately 2.83-3.43% depending on dividend projection assumptions. That spread reflects genuine uncertainty about where payouts land in the next twelve months.
Now layer in the Australian risk-free rate. The RBA cash rate stands at 4.35% (raised 5 May 2026) and the 10-year government bond yield at 4.993%.
The current RBA tightening cycle represents the third consecutive 25 basis point hike in 2026, reversing nearly all of the cuts delivered across 2025 and repricing the risk-free rate benchmark that equity income investors use when assessing whether a dividend yield justifies equity risk exposure.
The RBA’s May 2026 monetary policy statement confirmed the cash rate increase to 4.35%, a decision that directly shifts the benchmark against which Australian equity income must compete.
| Instrument | Yield (%) | Note |
|---|---|---|
| MQG trailing yield | ~2.77-2.83 | Yahoo Finance / Morningstar, 11 May 2026 |
| MQG forward yield (range) | ~2.83-3.43 | Varies by projection assumptions |
| Five-year average yield | ~3.16 | Historical average benchmark |
| RBA cash rate | 4.35 | Raised 5 May 2026 |
| AU 10-year bond yield | 4.993 | As of 11 May 2026 |
“MQG’s trailing yield currently sits roughly 200 basis points below Australia’s 10-year government bond yield, a context that matters when assessing how much premium investors are paying for equity exposure.”
That 200-220 basis point gap between the trailing dividend yield and the risk-free rate raises the bar for equity risk justification. An investor accepting 2.8% from MQG when a government bond offers nearly 5% is implicitly betting that capital appreciation or future dividend growth will more than compensate for the income shortfall. Whether that bet is reasonable depends on the earnings trajectory, which brings us to the method’s limitations.
Yield comparison tells an investor how a stock is priced relative to its own income history. It says nothing about whether that history will continue.
Consider the payout ratio. At approximately 67-70%, Macquarie is operating at the upper boundary of its stated 50-70% policy range. There is limited room to raise the dividend without corresponding earnings expansion. If profit growth slows, the dividend may plateau, and the “historical average yield” benchmark becomes a reference point built on conditions that no longer apply.
Payout ratio sustainability is one of the most important filters in dividend analysis: a ratio consistently above 70% leaves a company with limited capacity to grow the dividend unless earnings expand at pace, and a ratio breaching 100% is a mathematical signal that a cut is likely within one or two reporting cycles.
The dividend growth record itself is mixed. Digrin calculates a 3-year average DPS growth rate of just 1.28%, while Stockinvest.us calculates -14.63% over a comparable period. That discrepancy reflects volatile, uneven payout behaviour rather than a steadily ascending trend. The historical average yield, in other words, was shaped by inconsistency rather than smooth growth.
There is a structural issue beyond company-specific payout volatility. Macquarie’s five-year average yield of 3.16% was formed partly during a period when the RBA cash rate sat near zero (through 2021 and into 2022). In that environment, a 3% equity yield looked generous relative to cash. Today, with the cash rate at 4.35%, the same yield looks less competitive. Comparing a current yield to a historical average built in a fundamentally different rate environment can produce misleading signals.
Three limitations worth carrying forward:
The yield comparison is a starting point. The questions it cannot answer, whether earnings justify the premium, whether dividend growth will accelerate, and whether the multiple is stretched, require different tools.
“No single valuation metric is sufficient on its own. The yield comparison is a starting point, not a verdict.”
Each tool answers a different question. Used together, they triangulate toward a more informed view.
For investors wanting to extend beyond yield and P/E into the sector-specific metrics that drive financial institution valuations, our dedicated guide to valuing ASX financial stocks walks through net interest margin, return on equity, and capital adequacy ratios using live Big Four data, covering why a DDM and a price-to-book cross-check together produce more reliable fair value estimates than either alone.
The data points converge on a clear, if incomplete, picture. MQG’s trailing yield of approximately 2.77-2.83% below the five-year average of 3.16%, combined with a yield that lags both the RBA cash rate and the 10-year bond yield, is consistent with the stock being priced at a relative premium to its own income history.
That premium, however, is not without justification. FY26 net profit rose 30%, every division delivered double-digit growth, and H2 FY26 earnings nearly doubled the first half. An investor paying above-average prices for Macquarie can point to above-average earnings momentum as the rationale.
For Australian shareholders specifically, the 35% franking on the FY26 final dividend adjusts the effective gross yield upward for eligible taxpayers, a consideration that pure yield comparisons overlook. Franking does not resolve the gap with bond yields, but it narrows it for domestic investors subject to the Australian tax system.
The grossed-up yield calculation for a 35% partially franked dividend differs from the fully franked case in ways that meaningfully affect after-tax income comparisons, particularly for superannuation funds and retirees whose marginal tax rates sit well below the 30% corporate rate at which the credit was generated.
The ATO’s dividend imputation framework governs how franking credits attach to distributions and are applied as tax offsets by eligible resident shareholders, meaning the gross-up effect on effective yield varies with each investor’s marginal tax rate.
Three takeaways from the analysis:
This article is for informational purposes only and should not be considered financial advice. Investors should conduct their own research and consult with financial professionals before making investment decisions. Past performance does not guarantee future results.
The method demonstrated throughout this article is repeatable. It works for any ASX blue-chip with a long, uninterrupted dividend history and a reasonably stable payout policy. It is less reliable for growth stocks, cyclical businesses with volatile earnings, or companies with inconsistent dividend records.
The four-step process:
Macquarie’s 55-plus year profitability streak made it an ideal teaching case. The compression of its yield relative to both history and the risk-free rate presents a clear signal, one that the strong FY26 earnings result complicates rather than resolves. That tension between income signal and growth story is precisely what multi-tool analysis is designed to navigate. The yield comparison identified the question. The complementary tools help approach an answer.
Dividend yield valuation uses a stock's current yield compared to its own historical average yield to assess whether the stock is priced at a premium or discount relative to its income track record. When the current yield sits below the historical average, it signals the stock price has risen faster than dividend growth, suggesting relatively expensive pricing.
You divide the annual dividend per share by the share price for each year over a chosen period, typically five years, then average those figures. Financial data platforms such as Yahoo Finance, Morningstar, and Digrin publish historical yield data that makes this calculation straightforward.
The RBA cash rate represents the risk-free return available to investors, so when it rises above a stock's dividend yield, investors are effectively accepting a lower income return for taking on equity risk. With the RBA cash rate at 4.35% and MQG's trailing yield at roughly 2.77-2.83%, the gap raises the bar for justifying equity exposure on income grounds alone.
The method cannot assess whether future dividends are sustainable, is distorted by inconsistent payout histories, and can mislead when the historical average was formed in a very different interest rate environment, such as the near-zero rate period of 2021-2022.
Franking credits represent corporate tax already paid on profits, and for eligible Australian shareholders they increase the gross yield above the face dividend yield. MQG's FY26 final dividend carries 35% franking, meaning the effective after-tax income is higher than the headline yield figure for investors who can utilise those credits.