
Why a BoJ Rate Hike Hasn’t Stopped the Yen Carry Trade
3 hrs ago

Westpac shares have climbed nearly 18% over the past year, yet two different valuation models using the same dividend produce fair value estimates ranging from $34 to $49 per share. That spread is not a calculation error. It illustrates precisely why knowing which metrics to use, and how to read them, separates a considered assessment from a guess.
Australian retail investors carry heavy exposure to Big Four bank shares, particularly through self-managed super funds (SMSFs) and dividend-focused portfolios. Yet bank financial statements are structured differently from most other listed companies. The standard price-to-earnings (P/E) ratio that works for industrial stocks misses what actually drives bank value: the margin earned on lending, the efficiency of capital deployment, and the regulatory buffers that determine how much cash can flow back to shareholders.
This guide covers the three operational metrics every bank investor needs to understand (net interest margin, return on equity, and the CET1 capital ratio), uses Westpac’s current H1 2026 data as a live reference throughout, and then shows how those metrics feed into a practical valuation framework suited to Australian conditions, including the role of franking credits.
Banks are financial intermediaries. Their primary product is the spread between what they pay to borrow money (deposits and wholesale funding) and what they charge to lend it out. That makes their revenue structure fundamentally unlike a retailer, a software company, or a manufacturer. Lending income represents approximately 87% of Westpac’s total revenue, a concentration that demands margin-specific analysis rather than headline earnings comparisons.
Standard metrics can mislead. A P/E ratio applied to a bank captures earnings that are heavily shaped by provisioning decisions, the estimates management makes about future loan losses, not just operational performance. Two banks with identical lending businesses can report meaningfully different earnings simply because one has taken a more conservative provisioning stance.
Westpac trades at $37.44 with a 52-week return of +17.77% and a beta of 0.75, positioning it as a low-volatility defensive holding. But understanding whether that price is justified requires a different lens. The three metrics that professional analysts use to cut through bank complexity are:
NIM is the difference between what a bank earns on its loan book and what it pays for funding (deposits and wholesale debt), expressed as a percentage of earning assets. It is the single most direct measure of a bank’s core business economics.
Several forces push NIM up or down. Lending competition compresses it when banks undercut each other to win mortgage and business loan market share. Rising funding costs from wholesale debt markets or deposit rate competition squeeze it further. Fixed-rate loan roll-offs, where borrowers who locked in lower rates during 2020-2022 refinance at higher rates, can expand it. The Reserve Bank of Australia’s (RBA) cash rate trajectory shapes the backdrop against which all of these forces operate.
Lending income represents approximately 87% of Westpac’s total revenue, which is why NIM is the single most important profitability metric for bank investors to track.
Westpac reported a NIM of approximately 1.94% in its H1 2026 interim results on 5 May 2026, placing it above the sector average of approximately 1.78% reported by KPMG’s Big Four Half-Year Results 2026 analysis. Mild NIM compression was observed across the sector during H1 2025, with H2 2025 showing stabilisation. A bank sitting above the sector average has more cushion to absorb competitive pressure before its profitability erodes.
| Bank | NIM (H1 2026, approx.) | Position vs Sector Average (~1.78%) |
|---|---|---|
| CBA | 2.05% | Above average |
| Westpac | 1.94% | Above average |
| NAB | 1.85% | Above average |
| ANZ | 1.78% | In line with average |
Knowing where a bank sits relative to its peers on NIM gives investors a baseline for assessing whether its margin advantage is durable or cyclical.
ROE is net profit divided by shareholders’ equity. It measures the annual return the bank generates for every dollar of capital that shareholders have contributed. A bank reporting 10% ROE is earning $0.10 per year on every dollar of equity on its books.
Westpac reported a trailing ROE of approximately 9.74% and a Return on Tangible Equity (ROTE) of 10.97% excluding notable items. Analysts often prefer ROTE because it strips out intangible assets (such as goodwill from past acquisitions) that cannot absorb losses, giving a cleaner picture of capital efficiency. Against a sector average of approximately 10-11% (per KPMG’s H1 2026 analysis), Westpac sits at the lower-mid range.
CBA stands apart at approximately 14.2% ROE, which is why it commands a premium. ANZ trails at approximately 9.5%.
The price-to-book (P/B) ratio and ROE are inseparable in bank analysis. A bank trading above 1.0x book value is only worth that premium if it can sustain ROE above its cost of equity. If ROE falls below the cost of equity, the bank is destroying capital in real terms, and a P/B above 1.0x becomes increasingly difficult to justify.
Westpac’s P/B sits at 1.80x, at the top of its 10-year historical range of approximately 1.5-1.8x. Its estimated cost of equity, derived from the Capital Asset Pricing Model (CAPM) using a beta of 0.75, is approximately 9%.
The spread between Westpac’s ROE of approximately 9.7% and its cost of equity of approximately 9% is thin but positive. This means the bank is earning just enough above its required return to justify a modest premium to book value. If ROE were to slip below 9%, that justification weakens materially.
CBA’s ROE of approximately 14.2% explains why it commands a P/B of approximately 2.5x; Westpac’s ROE of approximately 9.7-10.9% justifies a more modest premium.
The Common Equity Tier 1 (CET1) ratio measures the proportion of a bank’s risk-weighted assets covered by the highest quality capital, ordinary shares and retained earnings. It is the primary regulatory safety buffer, the number the Australian Prudential Regulation Authority (APRA) watches most closely.
APRA’s effective minimum for major Australian banks sits at approximately 10.25-10.5%, incorporating the base requirement plus applicable buffers to meet the “unquestionably strong” standard. The headroom above that minimum is what matters to shareholders, because surplus capital is what funds dividends, buybacks, and acquisitions.
APRA’s unquestionably strong capital benchmarks set a CET1 floor of 10.5% for major Australian banks, a threshold that was established to ensure the domestic banking system could absorb severe economic shocks without requiring government support.
Westpac reported a CET1 ratio of approximately 12.53% (per Rask Media, May 2026), providing roughly 200 basis points of headroom above the effective minimum. No CET1 requirement increases have been flagged by APRA for 2026, per public disclosures. The sector average sits at approximately 12.3% (APRA Quarterly ADI Statistics, March 2026).
| Bank | CET1 Ratio (approx.) | Headroom Above APRA Effective Minimum (~10.5%) |
|---|---|---|
| CBA | 12.8% | ~230 bps |
| Westpac | 12.53% | ~200 bps |
| NAB | 12.05% | ~155 bps |
| ANZ | 12.0% | ~150 bps |
A CET1 ratio comfortably above the regulatory minimum means a bank can sustain its dividend through a moderate economic downturn without a capital raise. For income-focused investors, this matters directly. A high CET1 enables three things:
The Dividend Discount Model (DDM) is the preferred valuation framework for Australian bank shares because banks pay large, relatively stable, fully franked dividends with predictable payout ratios. The model values a stock based on the present value of its future dividend stream, and for banks with mature, recurring cashflows, this approach aligns directly with why most investors hold them.
Fully franked dividends carry a franking credit that represents company tax already paid. Australian resident taxpayers and SMSFs in accumulation phase can fully utilise these credits, either as a tax offset or a cash refund. Foreign investors and some tax-exempt entities cannot.
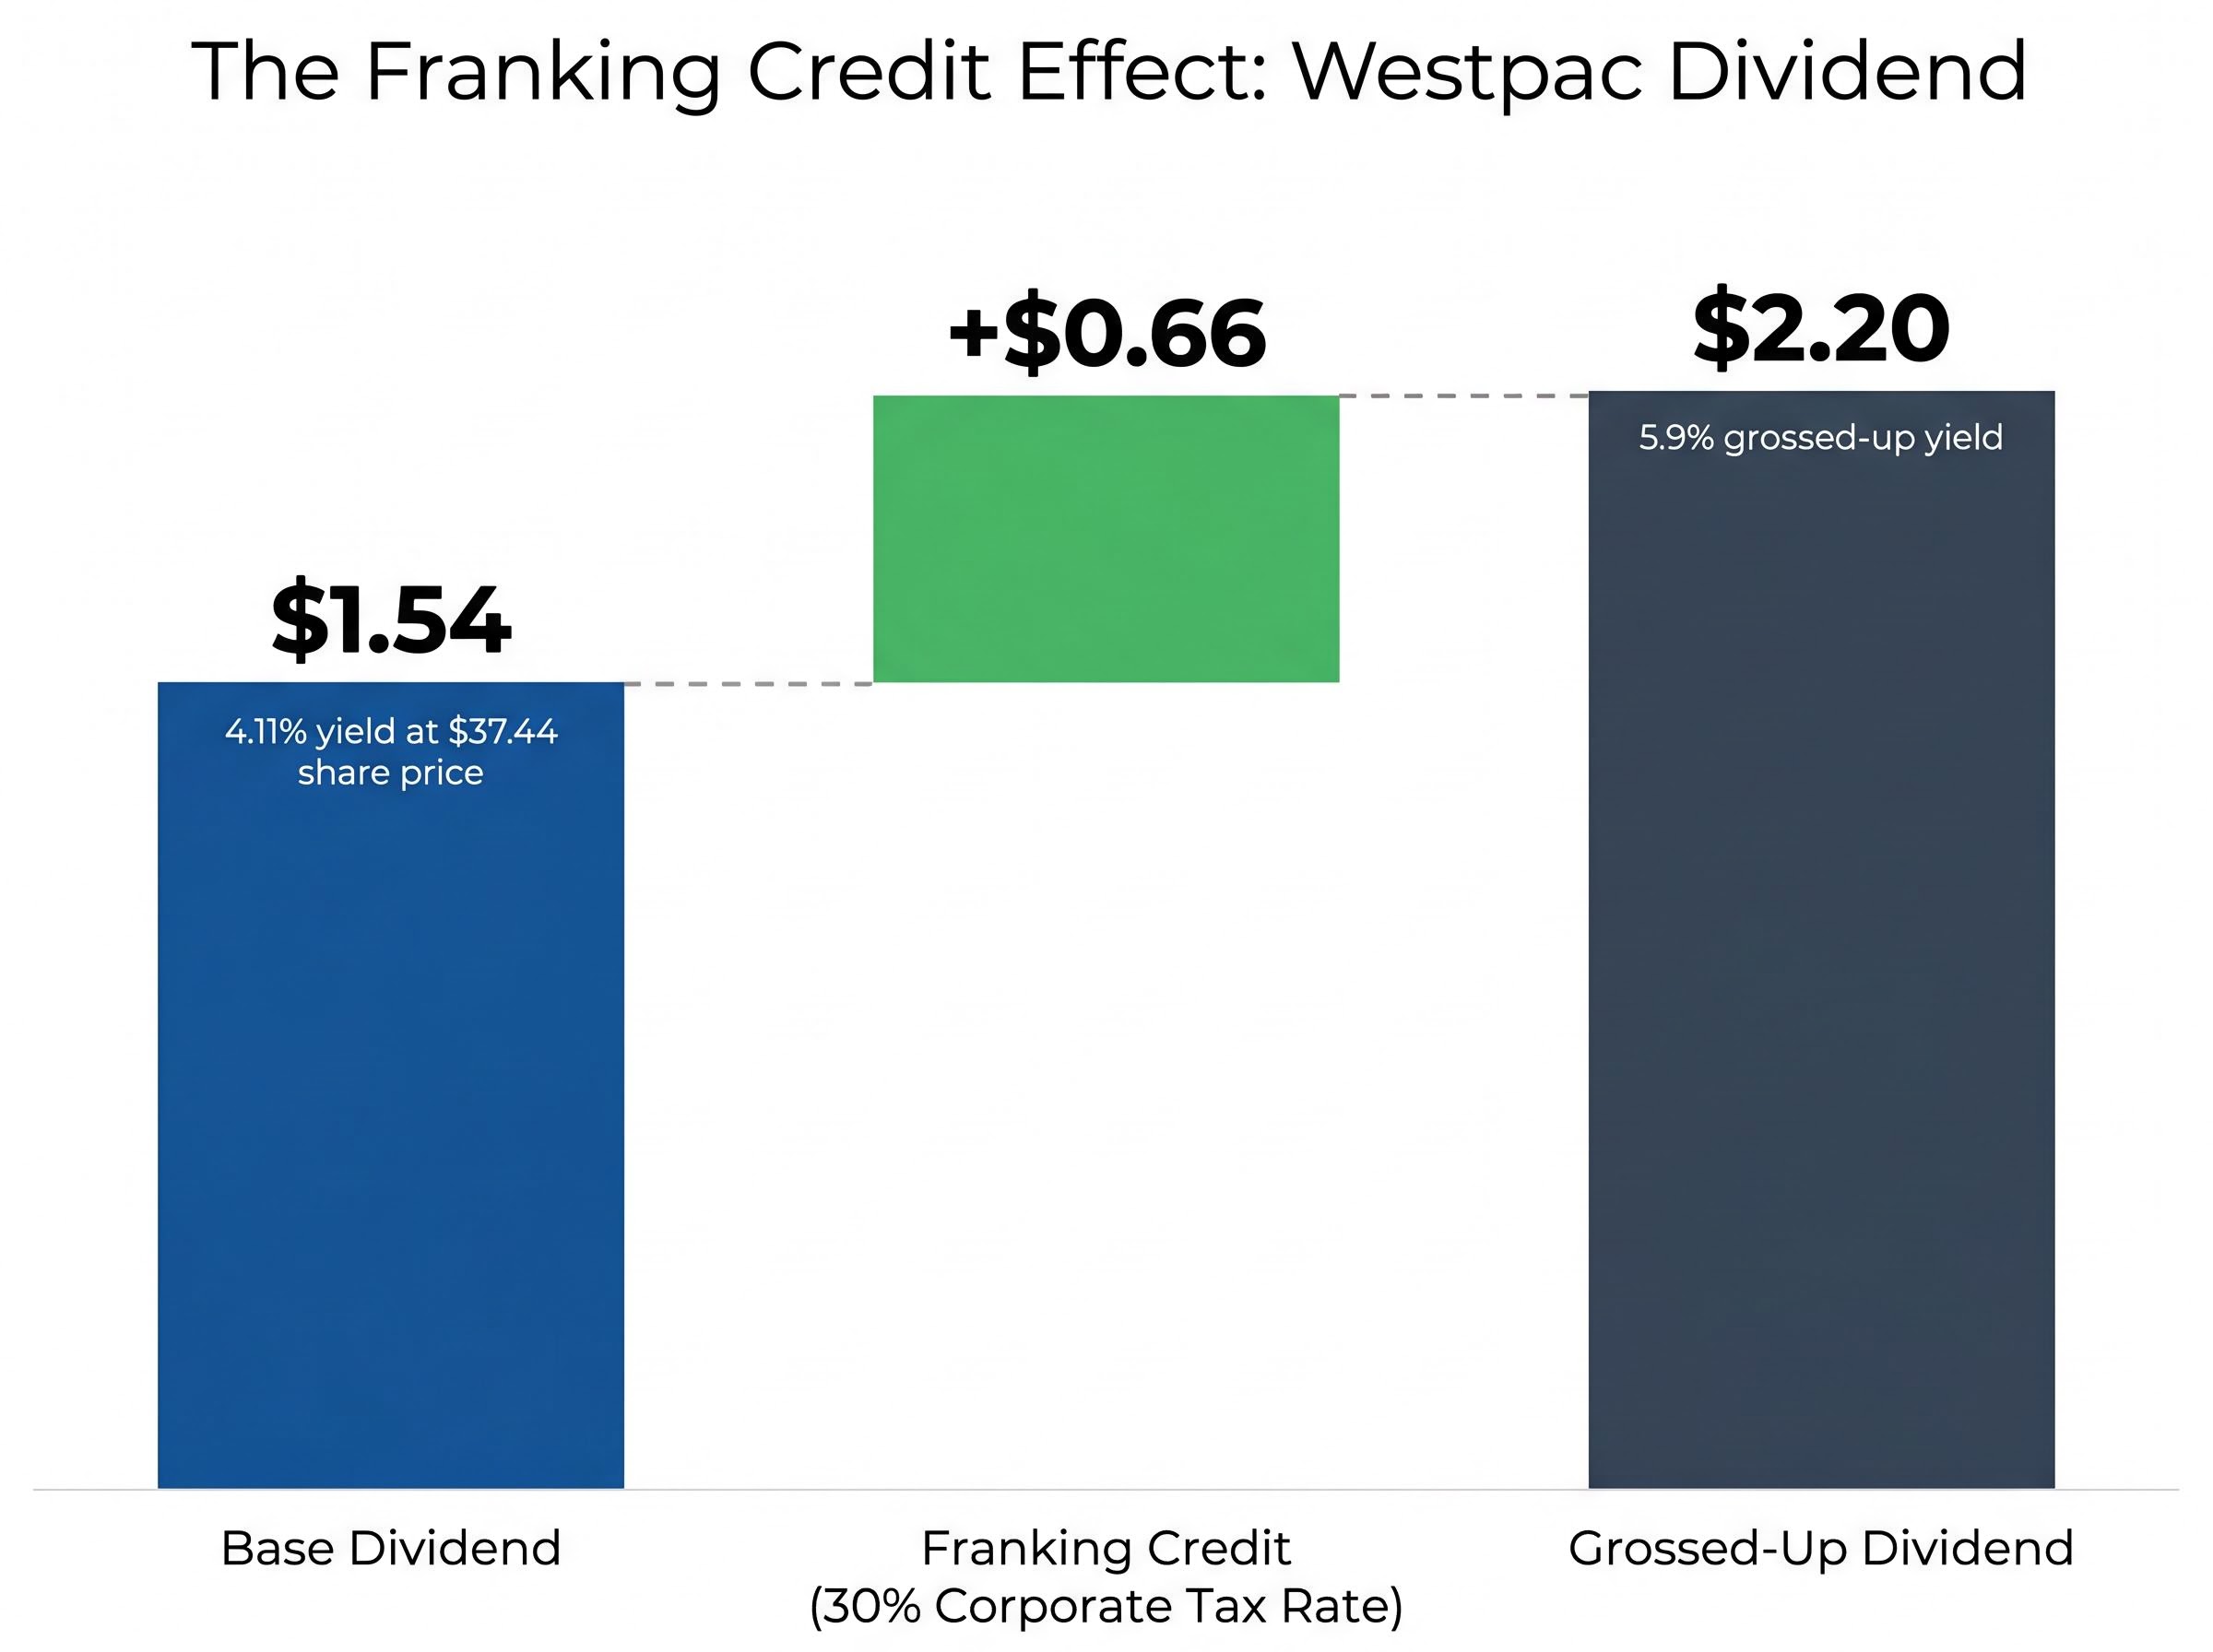
The correct gross-up formula uses the corporate tax rate of 30%: gross-up factor = 1 / (1 – 0.30) = 1.4286. Applied to Westpac’s implied annual dividend of approximately $1.54 (based on a 4.11% yield at $37.44):
The grossed-up yield of approximately 5.9% is the economically correct comparison yield for eligible investors, not the headline 4.11%.
The ATO franking credit rules govern exactly which investors can utilise imputation credits as a tax offset or cash refund, with eligibility determined by residency status and the investor’s marginal tax rate, making the grossed-up yield calculation economically meaningful only for qualifying Australian taxpayers.
The DDM calculation follows five steps:
At a 9% discount rate, a grossed-up Westpac dividend implies a fair value of approximately $44. Nudge the rate to 10% and the same model outputs $36.67, a spread of more than $7 on a single assumption.
At 9%: $2.20 / (0.09 – 0.04) = $44.00 implied fair value. At 10%: $2.20 / (0.10 – 0.04) = $36.67, approximately in line with the current market price of $37.44. Without franking credit gross-up, the basic DDM produces an estimated fair value of approximately $34-$35, placing the current share price above that estimate.
That wide spread illustrates why no single model produces a reliable answer in isolation. Using P/B as a cross-check (Westpac at 1.80x, at the top of its historical range) alongside the ROE-to-cost-of-equity comparison provides a more complete picture. A hybrid approach, DDM plus P/B plus ROE analysis, is more reliable than any single framework applied alone.
For investors who want to pressure-test the discount rate and growth rate inputs used in the DDM calculation above, our full explainer on ASX bank macro valuation assumptions walks through five qualitative dimensions, including RBA rate sensitivity, employment, and property market exposure, that produce radically different fair value outputs from identical models.
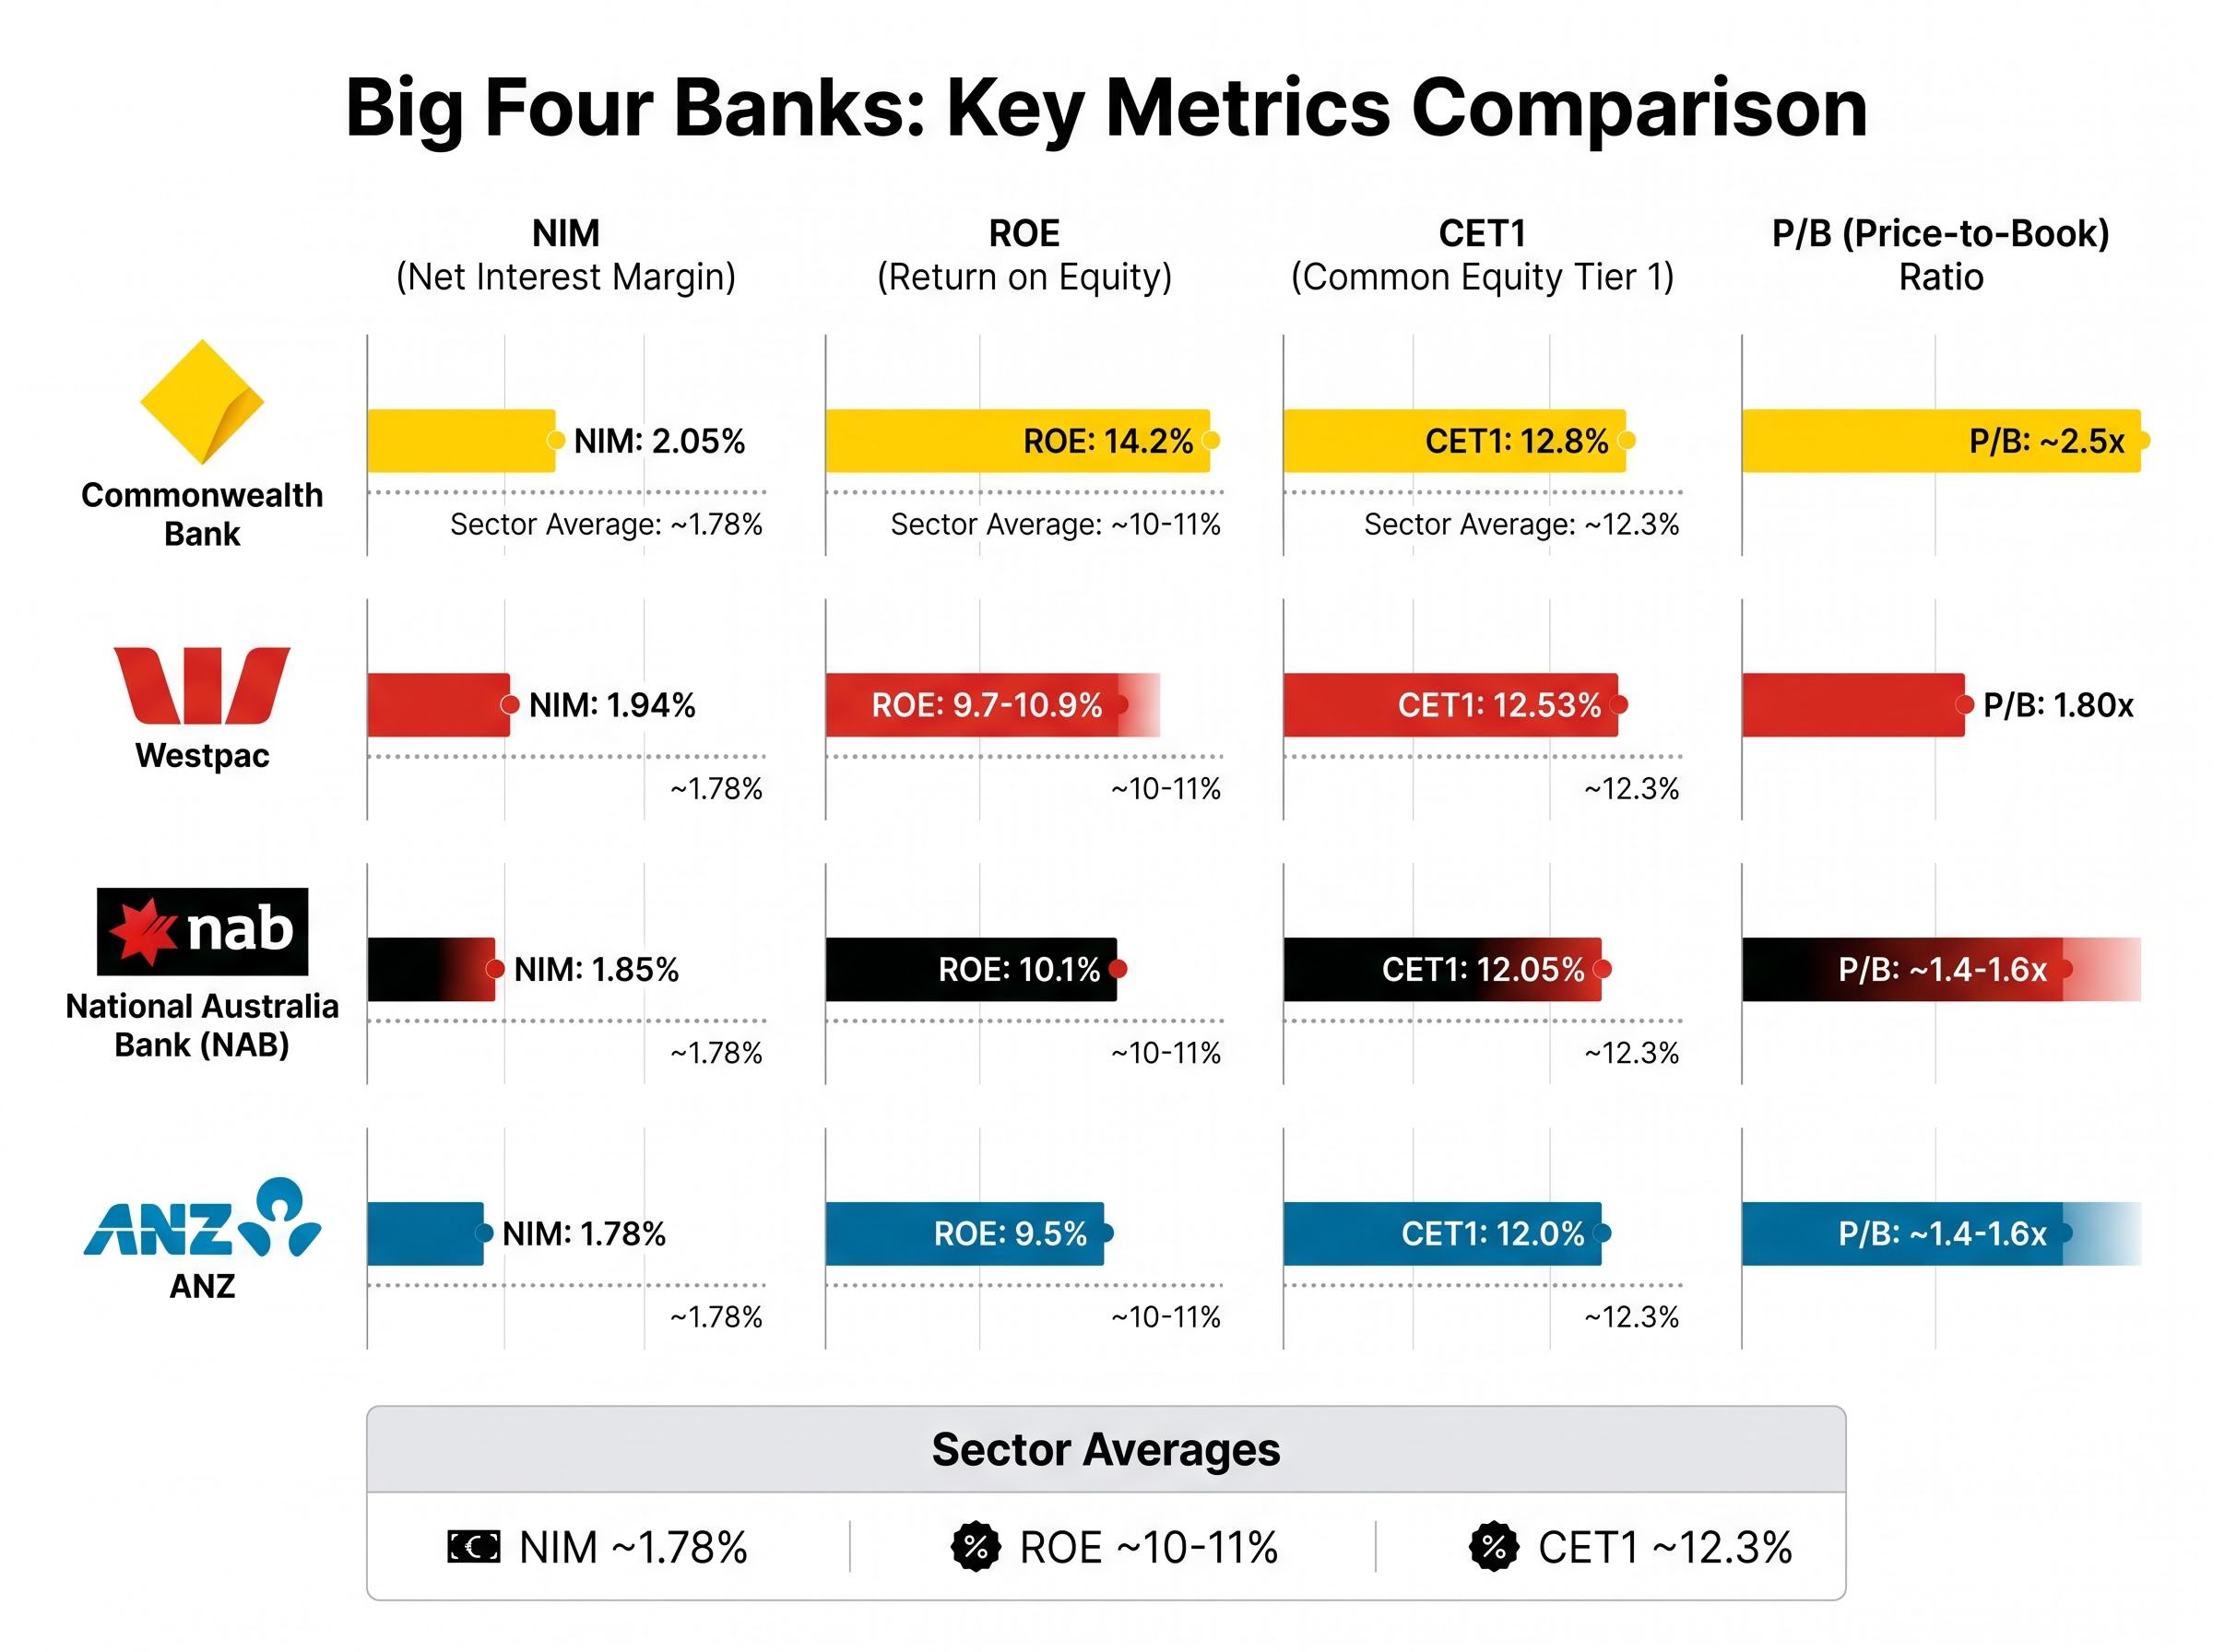
Seeing all four banks through the same lens transforms the individual metrics into a comparative decision tool. The table below consolidates the three metrics covered in this guide alongside the P/B ratio that ties them together.
| Bank | NIM (approx.) | ROE (approx.) | CET1 (approx.) | P/B |
|---|---|---|---|---|
| CBA | 2.05% | 14.2% | 12.8% | ~2.5x |
| Westpac | 1.94% | 9.7-10.9% | 12.53% | 1.80x |
| NAB | 1.85% | 10.1% | 12.05% | ~1.4-1.6x |
| ANZ | 1.78% | 9.5% | 12.0% | ~1.4-1.6x |
| Sector Average | ~1.78% | ~10-11% | ~12.3% | — |
CBA’s P/B premium of approximately 2.5x is justified by its sector-leading ROE of 14.2%, which sits well above its cost of equity. NAB and ANZ trade at more modest multiples with ROEs closer to the cost-of-equity threshold.
NAB’s H1 2026 results offer a concrete illustration of why surface-level price moves can mislead: its underlying profit grew 6.4% yet the share price fell nearly 3% on results day, a reaction that only makes sense when examined through the same NIM, ROE, and CET1 lens applied to Westpac above.
Westpac’s competitive position across each dimension:
No single metric determines which bank is the better investment. The right combination depends on whether an investor prioritises income yield, capital growth, or capital safety.
The NIM, ROE, and CET1 framework provides a structured starting point for comparative bank analysis. Westpac sits above the sector average on NIM, in the lower-mid range on ROE, above average on CET1, and at the top of its historical P/B range. Those readings give an investor clear reference points, but they are not a complete investment thesis.
Several factors sit outside this framework:
Westpac’s beta of 0.75 confirms its defensive profile but does not insulate against a sector-wide rerating if credit quality deteriorates across Australian housing markets.
The analyst consensus on ASX bank shares heading into mid-2026 is notably bearish despite the sector’s 8.87% year-to-date gain, with sell ratings concentrated on the names that have outperformed most on price momentum, a pattern that historically precedes periods where valuation fundamentals reassert themselves over sentiment-driven buying.
The practical takeaway is a hybrid approach: DDM for a fair value range, P/B as a cross-check against historical norms, and the ROE-to-cost-of-equity comparison to test whether the current price premium is earned. A framework that acknowledges where it stops is more useful than one that overpromises.
This article is for informational purposes only and should not be considered financial advice. Investors should conduct their own research and consult with financial professionals before making investment decisions. Past performance does not guarantee future results. Financial projections are subject to market conditions and various risk factors.
Net interest margin (NIM) is the difference between what a bank earns on its loans and what it pays for funding, expressed as a percentage of earning assets. It is the single most direct measure of a bank's core profitability, and for Australian banks like Westpac where lending income represents roughly 87% of total revenue, tracking NIM is more informative than headline earnings comparisons.
Franking credits represent company tax already paid, and eligible Australian investors can claim them as a tax offset or cash refund, which meaningfully increases the effective yield. For example, Westpac's headline dividend yield of approximately 4.11% grosses up to around 5.9% for qualifying taxpayers, which directly changes the fair value output of a dividend discount model.
The Common Equity Tier 1 (CET1) ratio measures a bank's highest-quality capital as a proportion of its risk-weighted assets, and APRA requires major Australian banks to maintain at least approximately 10.25-10.5%. Surplus capital above that minimum is what funds dividends and buybacks, so a higher CET1 ratio, like Westpac's 12.53%, signals greater capacity to sustain payouts through an economic downturn.
The dividend discount model values a bank by dividing its grossed-up annual dividend by the difference between the required rate of return and the expected long-run growth rate. Using Westpac's grossed-up dividend of $2.20 and a 9% discount rate with 4% growth, the model implies a fair value of $44.00, but shifting the discount rate to 10% drops the estimate to $36.67, illustrating how sensitive the output is to a single assumption.
The price-to-book (P/B) ratio is only justified above 1.0x if a bank's return on equity exceeds its cost of equity, making it a direct cross-check on valuation. Westpac trades at 1.80x book, at the top of its 10-year historical range, which is supported only while its ROE of approximately 9.7% remains above its estimated cost of equity of approximately 9%.