
Transurban’s dividend yield is sitting above its five-year historical average, yet the company’s distributions have been growing steadily, not shrinking. For investors who know how to read that signal, it opens a genuinely interesting valuation question.
Dividend yield is one of the most commonly cited metrics on the ASX. It is also one of the most misread. With Transurban (ASX: TCL) currently yielding approximately 4.26% against a five-year historical average of around 3.64%, the gap between those two numbers is not a conclusion. It is the starting point of an investigation.
This article explains how dividend yield works as a preliminary valuation tool, applies that framework directly to Transurban’s current situation, and sets out what else an investor needs to check before drawing any conclusions.
What dividend yield actually measures (and what it does not)
A high yield is not straightforwardly good news. It might be. It might also be a warning. The number itself cannot tell an investor which one it is without further context.
Dividend yield expresses the cash return a shareholder receives relative to the price they pay today. The formula is simple:
Dividend Yield (%) = Annual Distributions Per Share ÷ Current Share Price × 100
A stock paying 60 cents on a $15 share yields 4.0%. If the price falls to $12 with the same distribution, yield rises to 5.0%. The yield went up, but nothing improved.
That example illustrates the two-cause rule, which is the entire foundation of yield analysis. A yield rises for one of two reasons:
Dividend yield as a valuation signal is only as useful as the investor’s ability to separate its two causes: a rising yield driven by distribution growth carries fundamentally different implications from one driven by a falling share price, and conflating the two has historically produced significant capital losses for income-focused investors who chased apparent generosity at the wrong point in the cycle.
- Distributions increase while the share price holds steady or rises more slowly.
- The share price falls while distributions stay flat or decline more slowly.
Distinguishing between these two causes is the point of yield analysis. The yield figure itself is a snapshot, not a forecast. It captures the current relationship between price and past or guided distributions, and it changes whenever either variable moves. It does not indicate the direction of travel for either one.
When big ASX news breaks, our subscribers know first
Transurban’s business model: why this stock is built around distributions
Transurban is a toll road infrastructure operator holding long-term concession agreements across Melbourne, Sydney, Brisbane, and North America. Revenue is driven directly by traffic volumes and contracted toll escalators across a portfolio of 22 urban motorways.
The Australian assets include some of the busiest urban corridors in the country:
- CityLink (Melbourne)
- Hills M2 (Sydney)
- Logan Motorway (Brisbane)
Most tolls escalate annually by CPI or a fixed percentage, making Transurban’s revenue relatively insulated from general economic softness compared with most industrial businesses. When inflation rises, toll revenue tends to follow. When traffic grows, toll revenue compounds on top of that escalation.
How the payout policy works in practice
Transurban targets a 95-105% payout of free cash from operations. This is not a payout ratio built on accounting profit; it is tied directly to the cash the business actually generates from tolling.
Free cash from operations is the denominator the Board uses to set distributions, which means traffic performance and toll revenue are the direct operational levers. In FY2025, the 65.0 cents per security distribution was 99.5% covered by free cash, confirming the payout sat within policy.
Distributions are unfranked, a consideration worth noting for tax-sensitive investors including self-managed super funds and retirees who rely on franking credit refunds.
Reading Transurban’s yield against its own history
Transurban’s current yield of approximately 4.26% sits meaningfully above its five-year historical average of approximately 3.64%. The question is why.
Current yield: ~4.26% | Five-year average: ~3.64% The gap between these two figures is the valuation question this analysis investigates.
Applying the two-cause rule established earlier, the first step is to examine the distribution history. If distributions have been falling, the elevated yield may simply reflect a shrinking price. If distributions have been growing, something more interesting may be happening.
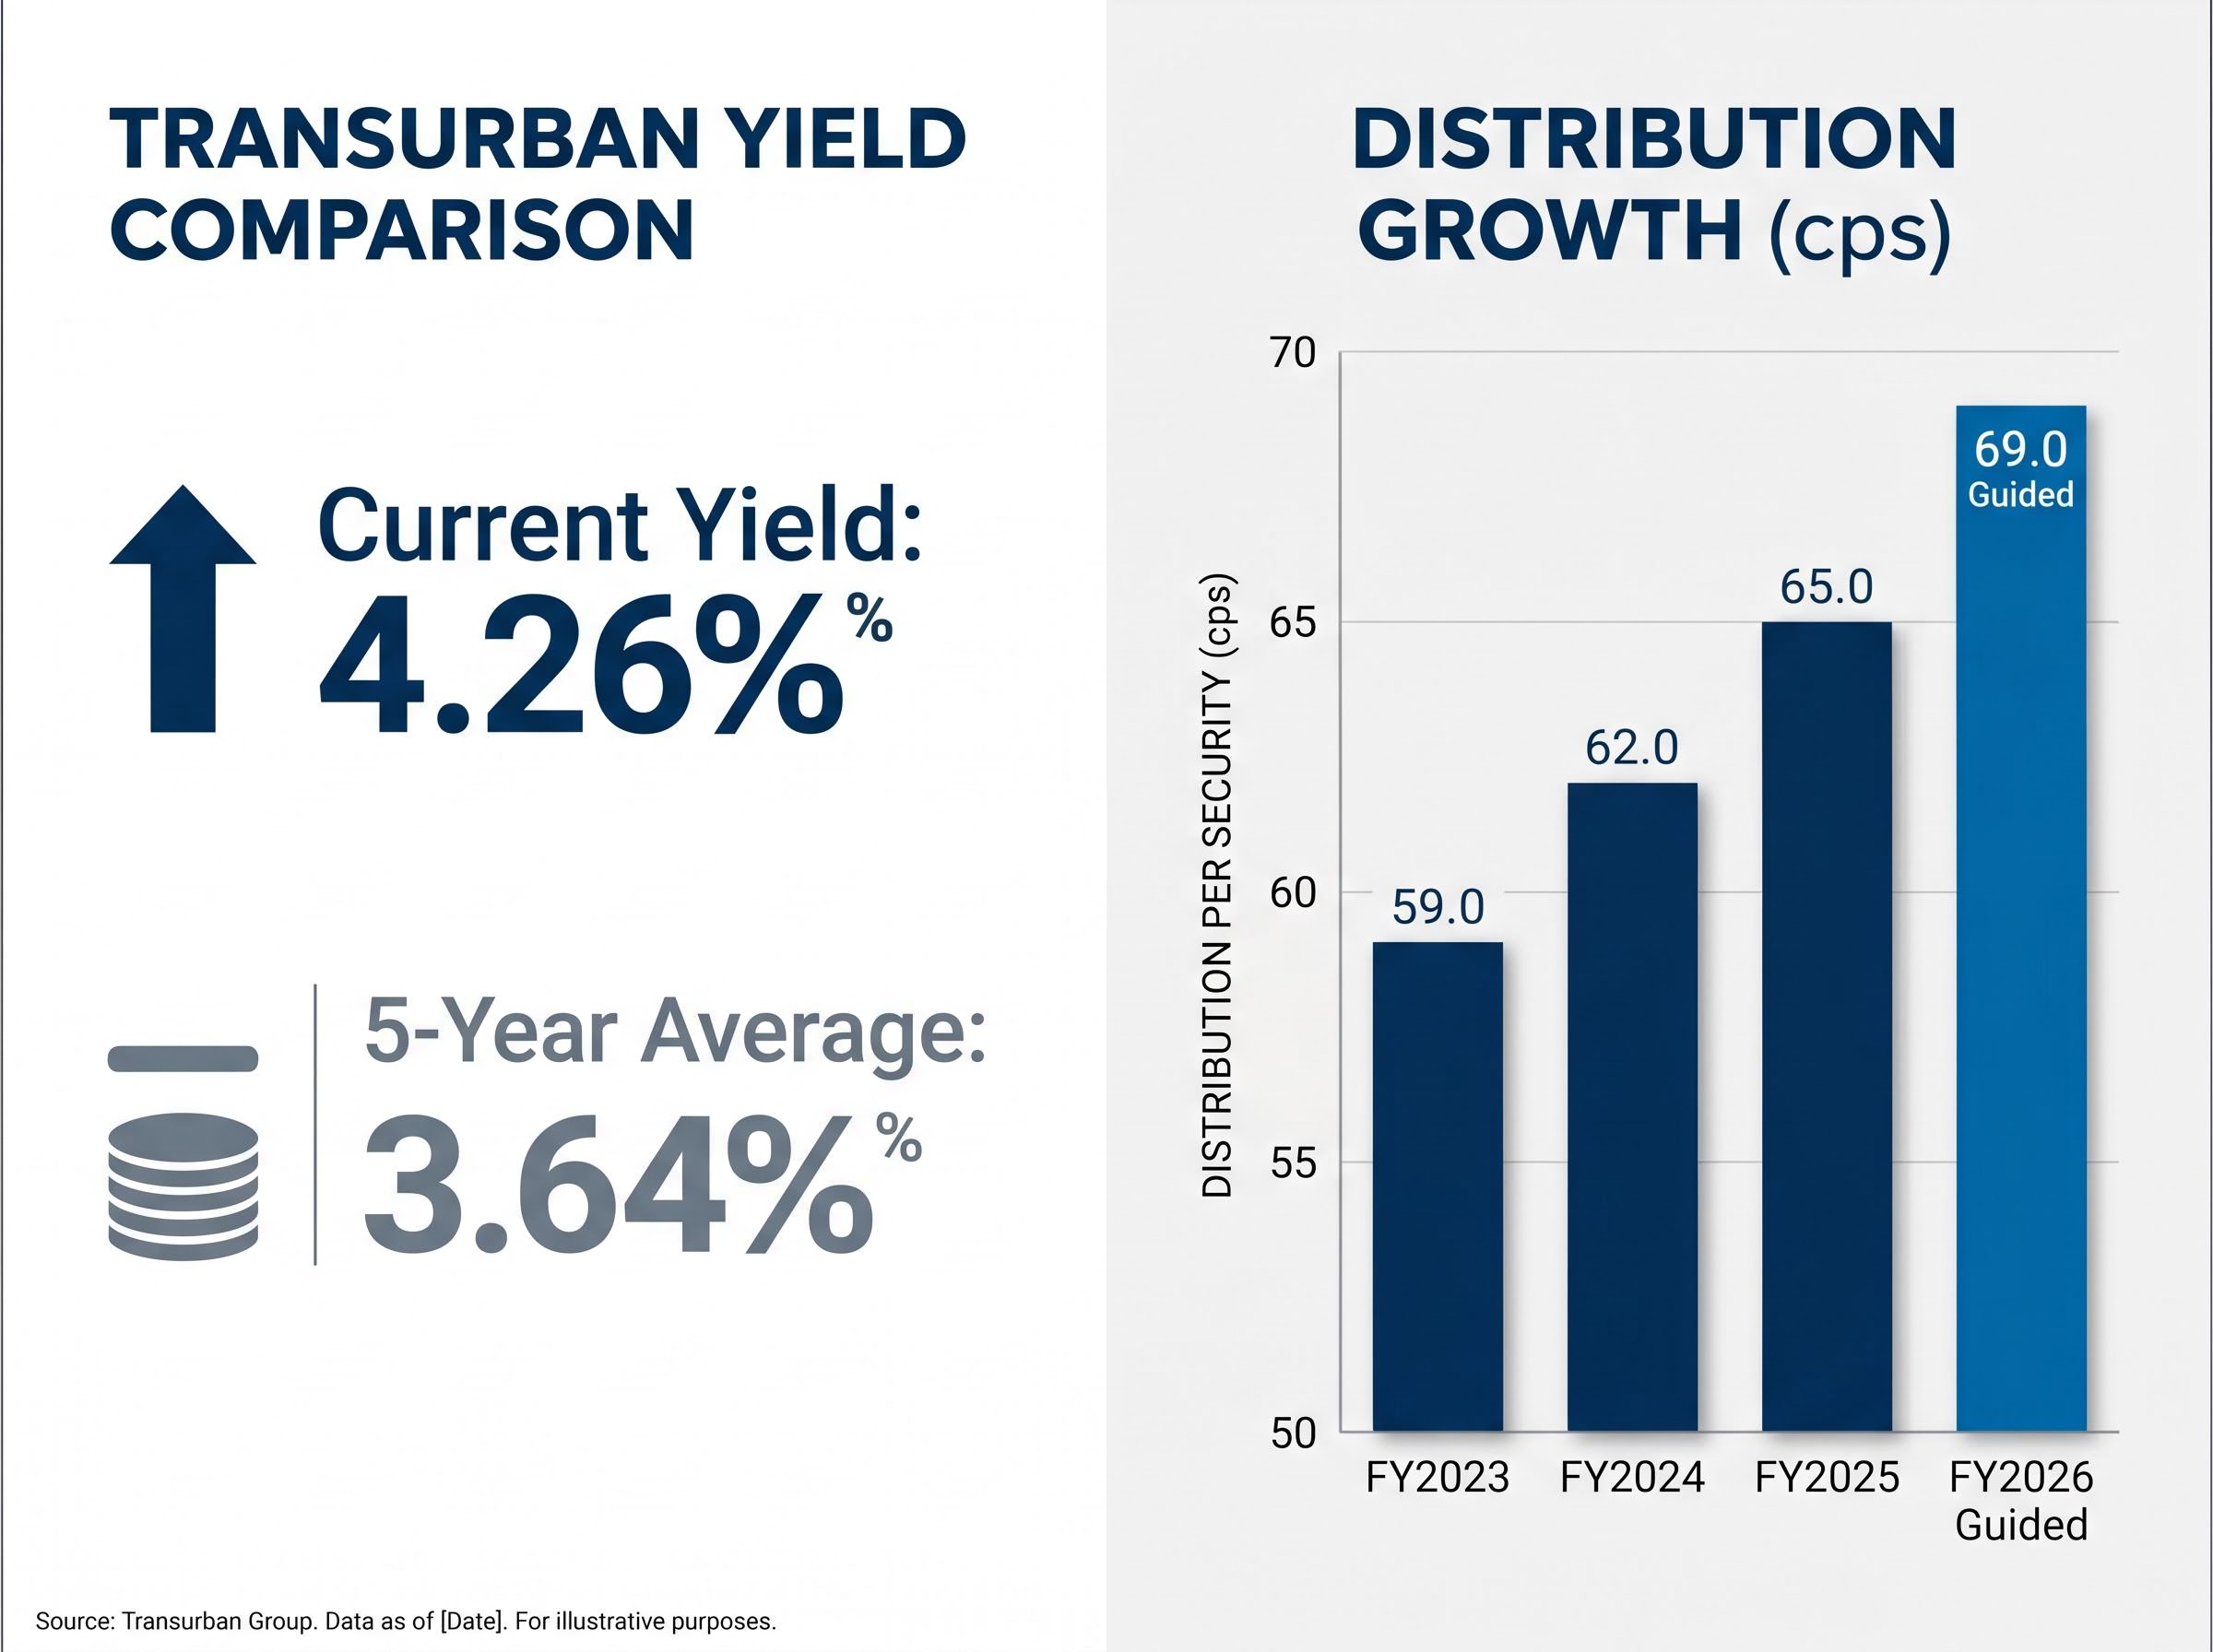
| Financial Year | Distribution (cps) | Year-on-Year Growth (%) | Free Cash Coverage (%) |
|---|---|---|---|
| FY2023 | 59.0 | — | Fully covered |
| FY2024 | 62.0 | ~5.1% | Fully covered |
| FY2025 | 65.0 | ~4.8% | 99.5% |
| FY2026 (guided) | 69.0 | ~6.2% | Target 95-105% |
The pattern is clear. Distributions have grown from 59.0 cps to 65.0 cps over three financial years, with guidance pointing to 69.0 cps in FY2026. Each step was covered, or near-fully covered, by free cash from operations.
On the price side, TCL’s share price gained approximately 2.5% from the start of 2025 through late May 2026, indicating no significant price decline that would mechanically inflate the yield. Growing distributions, rather than a depressed share price, appear to be the primary driver of the yield sitting above its historical norm.
That distinction matters. An elevated yield driven by distribution growth is a more constructive signal than one produced by a falling share price.
Toll road distribution coverage metrics are closely watched across the ASX infrastructure peer group; Atlas Arteria’s FY25 results, which showed 75% EBITDA margins and reaffirmed 40 cps guidance despite a French tax headwind, offer a useful parallel for calibrating what strong free cash coverage looks like in a comparable concession-based business operating under different regulatory and geographic conditions.
What drives Transurban’s distributions higher, year after year
The distribution growth visible in the table above is not arbitrary. It is mechanically produced by two compounding forces working simultaneously inside Transurban’s revenue engine:
- Traffic volume growth adds more toll transactions across the network.
- CPI-linked toll escalators increase the revenue earned per transaction.
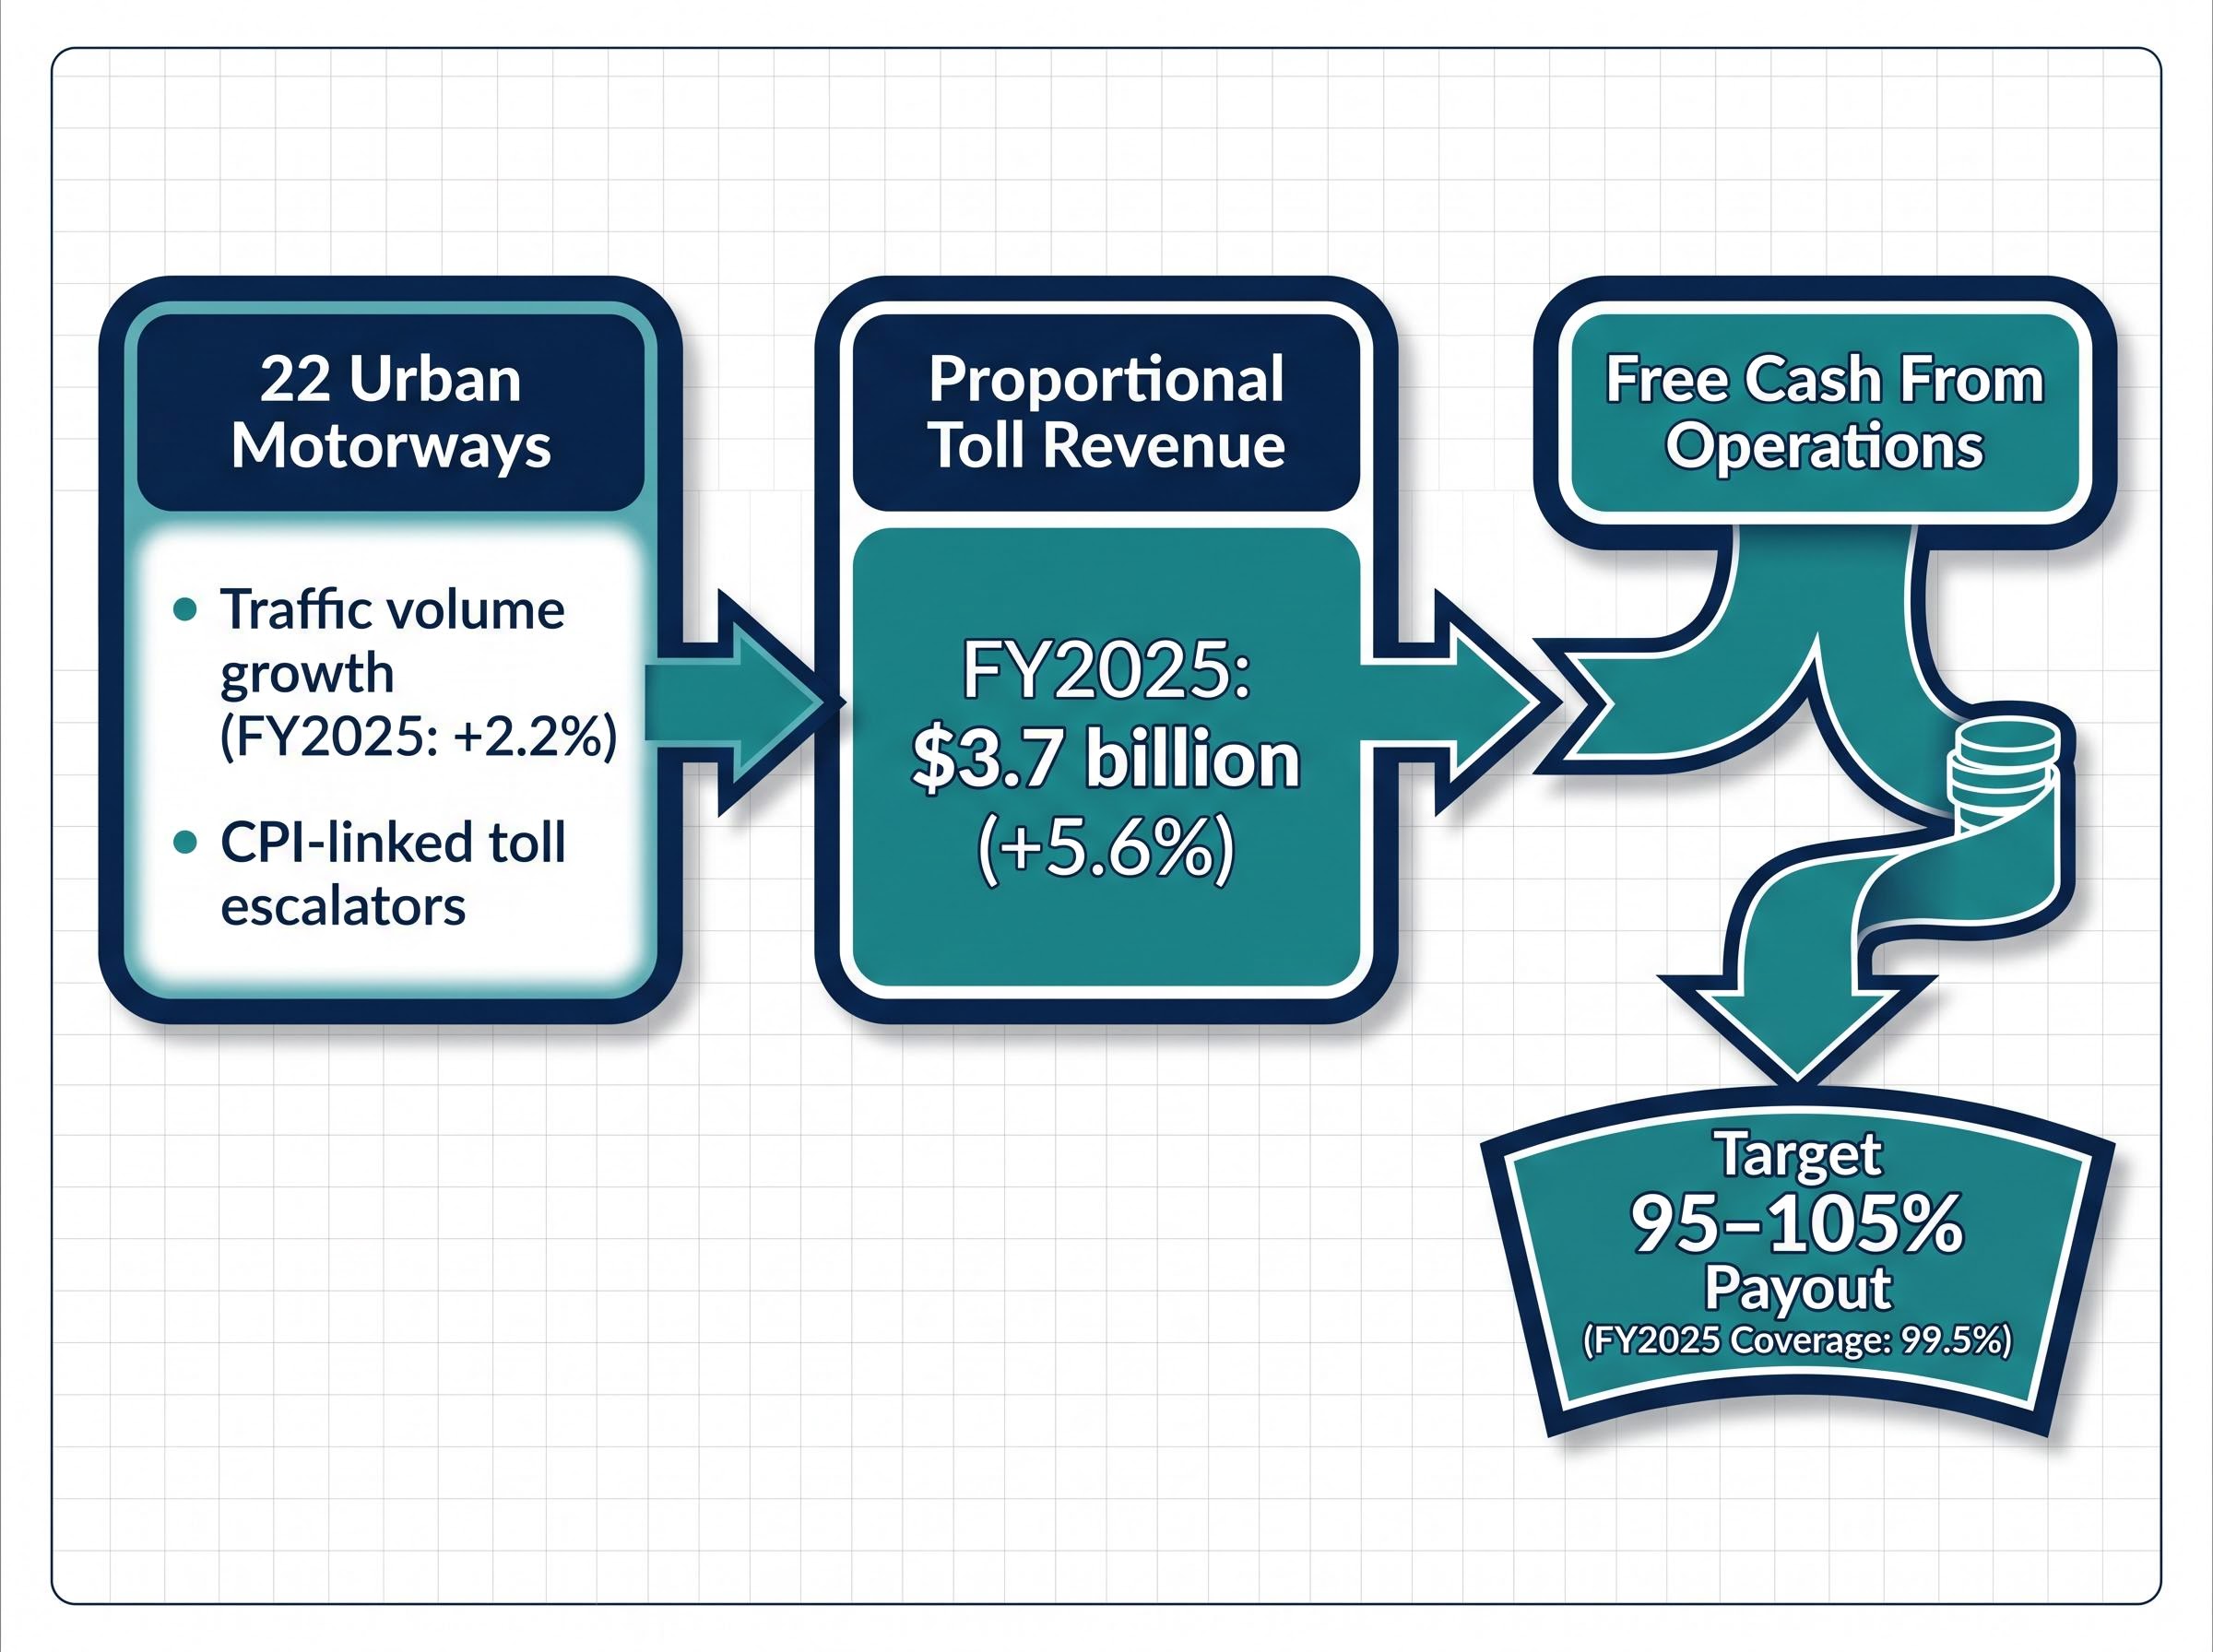
Both forces operate at the same time. More cars paying higher tolls produces compounding revenue growth that flows through to free cash and, under the 95-105% payout policy, directly into distributions.
The operational data confirms this dynamic. In FY2025, proportional toll revenue increased 5.6% to $3.7 billion, supported by group traffic growth of 2.2%. Toll revenue increased across all Australian markets. The March 2026 quarter showed group average daily traffic growth of 3.0%, with new assets and heavy-vehicle demand contributing.
The 1H FY2026 interim distribution of 34.0 cps was 102.5% covered by free cash, tracking in line with the full-year guidance of 69.0 cps.
The ASIC Regulatory Guide 231 disclosure benchmarks for infrastructure entities specifically require listed trusts to disclose distribution guidance and the basis on which it is set, which is why Transurban’s explicit free cash coverage figures and FY2026 guided distribution of 69.0 cps carry formal weight for retail investors assessing sustainability.
In the FY2025 results presentation on 20 August 2025, management explicitly connected distribution growth to free cash driven by toll revenue, noting that strong traffic performance and inflation-linked toll escalation had supported growth in both toll revenue and free cash.
This operational pipeline, from traffic counts through toll escalation to free cash and distribution cheques, is what gives analysts reasonable confidence that the FY2026 guidance is achievable, provided traffic trends remain stable.
The risks a yield comparison cannot capture on its own
The positive case has been made. Distributions are growing, coverage is strong, and the operational engine is producing compounding revenue. A yield above the five-year average, driven by distribution growth rather than price decline, is a more constructive signal than a mechanically inflated one.
That does not make it a buy signal.
For infrastructure stocks, yields above historical averages can reflect higher market discount rates rather than improved fundamentals or any deterioration in the business. As Livewire Markets commentary has noted, elevated infrastructure yields “often reflect higher discount rates rather than purely improved fundamentals.” Three material risk factors specific to Transurban deserve separate assessment:
- Interest rate and refinancing risk: Transurban operates a leveraged, capital-intensive business. Debt costs are a direct constraint on free cash and distribution growth. In a higher-rate environment, refinancing maturing facilities at elevated costs can compress the cash available for distributions even when toll revenue is growing.
- Unfranked distributions: All Transurban distributions are unfranked, which reduces after-tax value for investors who rely on franking credit refunds. This is particularly relevant for self-managed super funds and retirees in the pension phase.
- Regulatory and political risk: The NSW toll reform process represents the most visible near-term regulatory consideration.
NSW toll reform and what it means for investors
In December 2025, the NSW Government announced that the $60 weekly toll cap would become permanent from 1 July 2026, alongside other relief measures targeting Sydney motorway users. Transurban has engaged constructively with the reform process, indicating willingness to remove administration fees by mid-2026 as part of an enforcement-process overhaul.
Near-term concession terms are legally secure, and any reforms are expected to respect the value of existing contracts, with compensation to operators where required. The longer-term picture is more nuanced. The political environment for future toll road developments and renegotiations is more constrained, adding a pipeline risk that yield analysis alone cannot capture.
Analysts use discounted cash flow (DCF) and net asset value (NAV) models as the primary valuation anchor for infrastructure stocks like Transurban. Yield serves as one cross-check among several, not a standalone conclusion.
Investors wanting to stress-test the refinancing risk in more detail will find our deep-dive into Transurban’s profit and debt structure directly useful; it examines the A$18 billion net debt position, the 175.1% debt-to-equity ratio, and the material maturities running through FY28 that sit behind the distributions this article analyses.
Transurban’s yield is interesting, but here is what to do next
Transurban’s yield sits above its five-year average primarily because distributions have grown, not because the price has collapsed. That makes the elevated yield a more constructive signal than a mechanically inflated one, but it is still only a signal.
Dividend yield comparison is a screening tool. It narrows the field and sharpens the right questions. It does not answer them. DCF analysis, debt assessment, and regulatory monitoring are the necessary follow-on work. For investors tracking Transurban specifically, three metrics deserve ongoing attention:
- Free cash coverage of the FY2026 guided distribution of 69.0 cps, targeting 95-105% coverage.
- Quarterly traffic data, which Transurban releases regularly and which directly drives the free cash that funds distributions.
- NSW toll reform developments, including any further announcements around the permanent $60 weekly cap and its impact on revenue or concession terms.
The method demonstrated here, yield comparison surfaces a question, operational data tests the sustainability answer, and risk factors calibrate the confidence level, is transferable. It works for Transurban today. It works for any ASX income stock where the yield number catches an investor’s eye.
For investors ready to move from yield screening to a full valuation of TCL, our comprehensive walkthrough of ASX share valuation methods covers the five-step sequence of P/S screening, EV/EBITDA benchmarking, DCF analysis, and Dividend Discount Model application that analysts use to cross-check intrinsic value estimates for debt-heavy infrastructure businesses.
This article is for informational purposes only and should not be considered financial advice. Investors should conduct their own research and consult with financial professionals before making investment decisions. Past performance does not guarantee future results. Distribution guidance is forward-looking and subject to traffic performance and macroeconomic conditions.