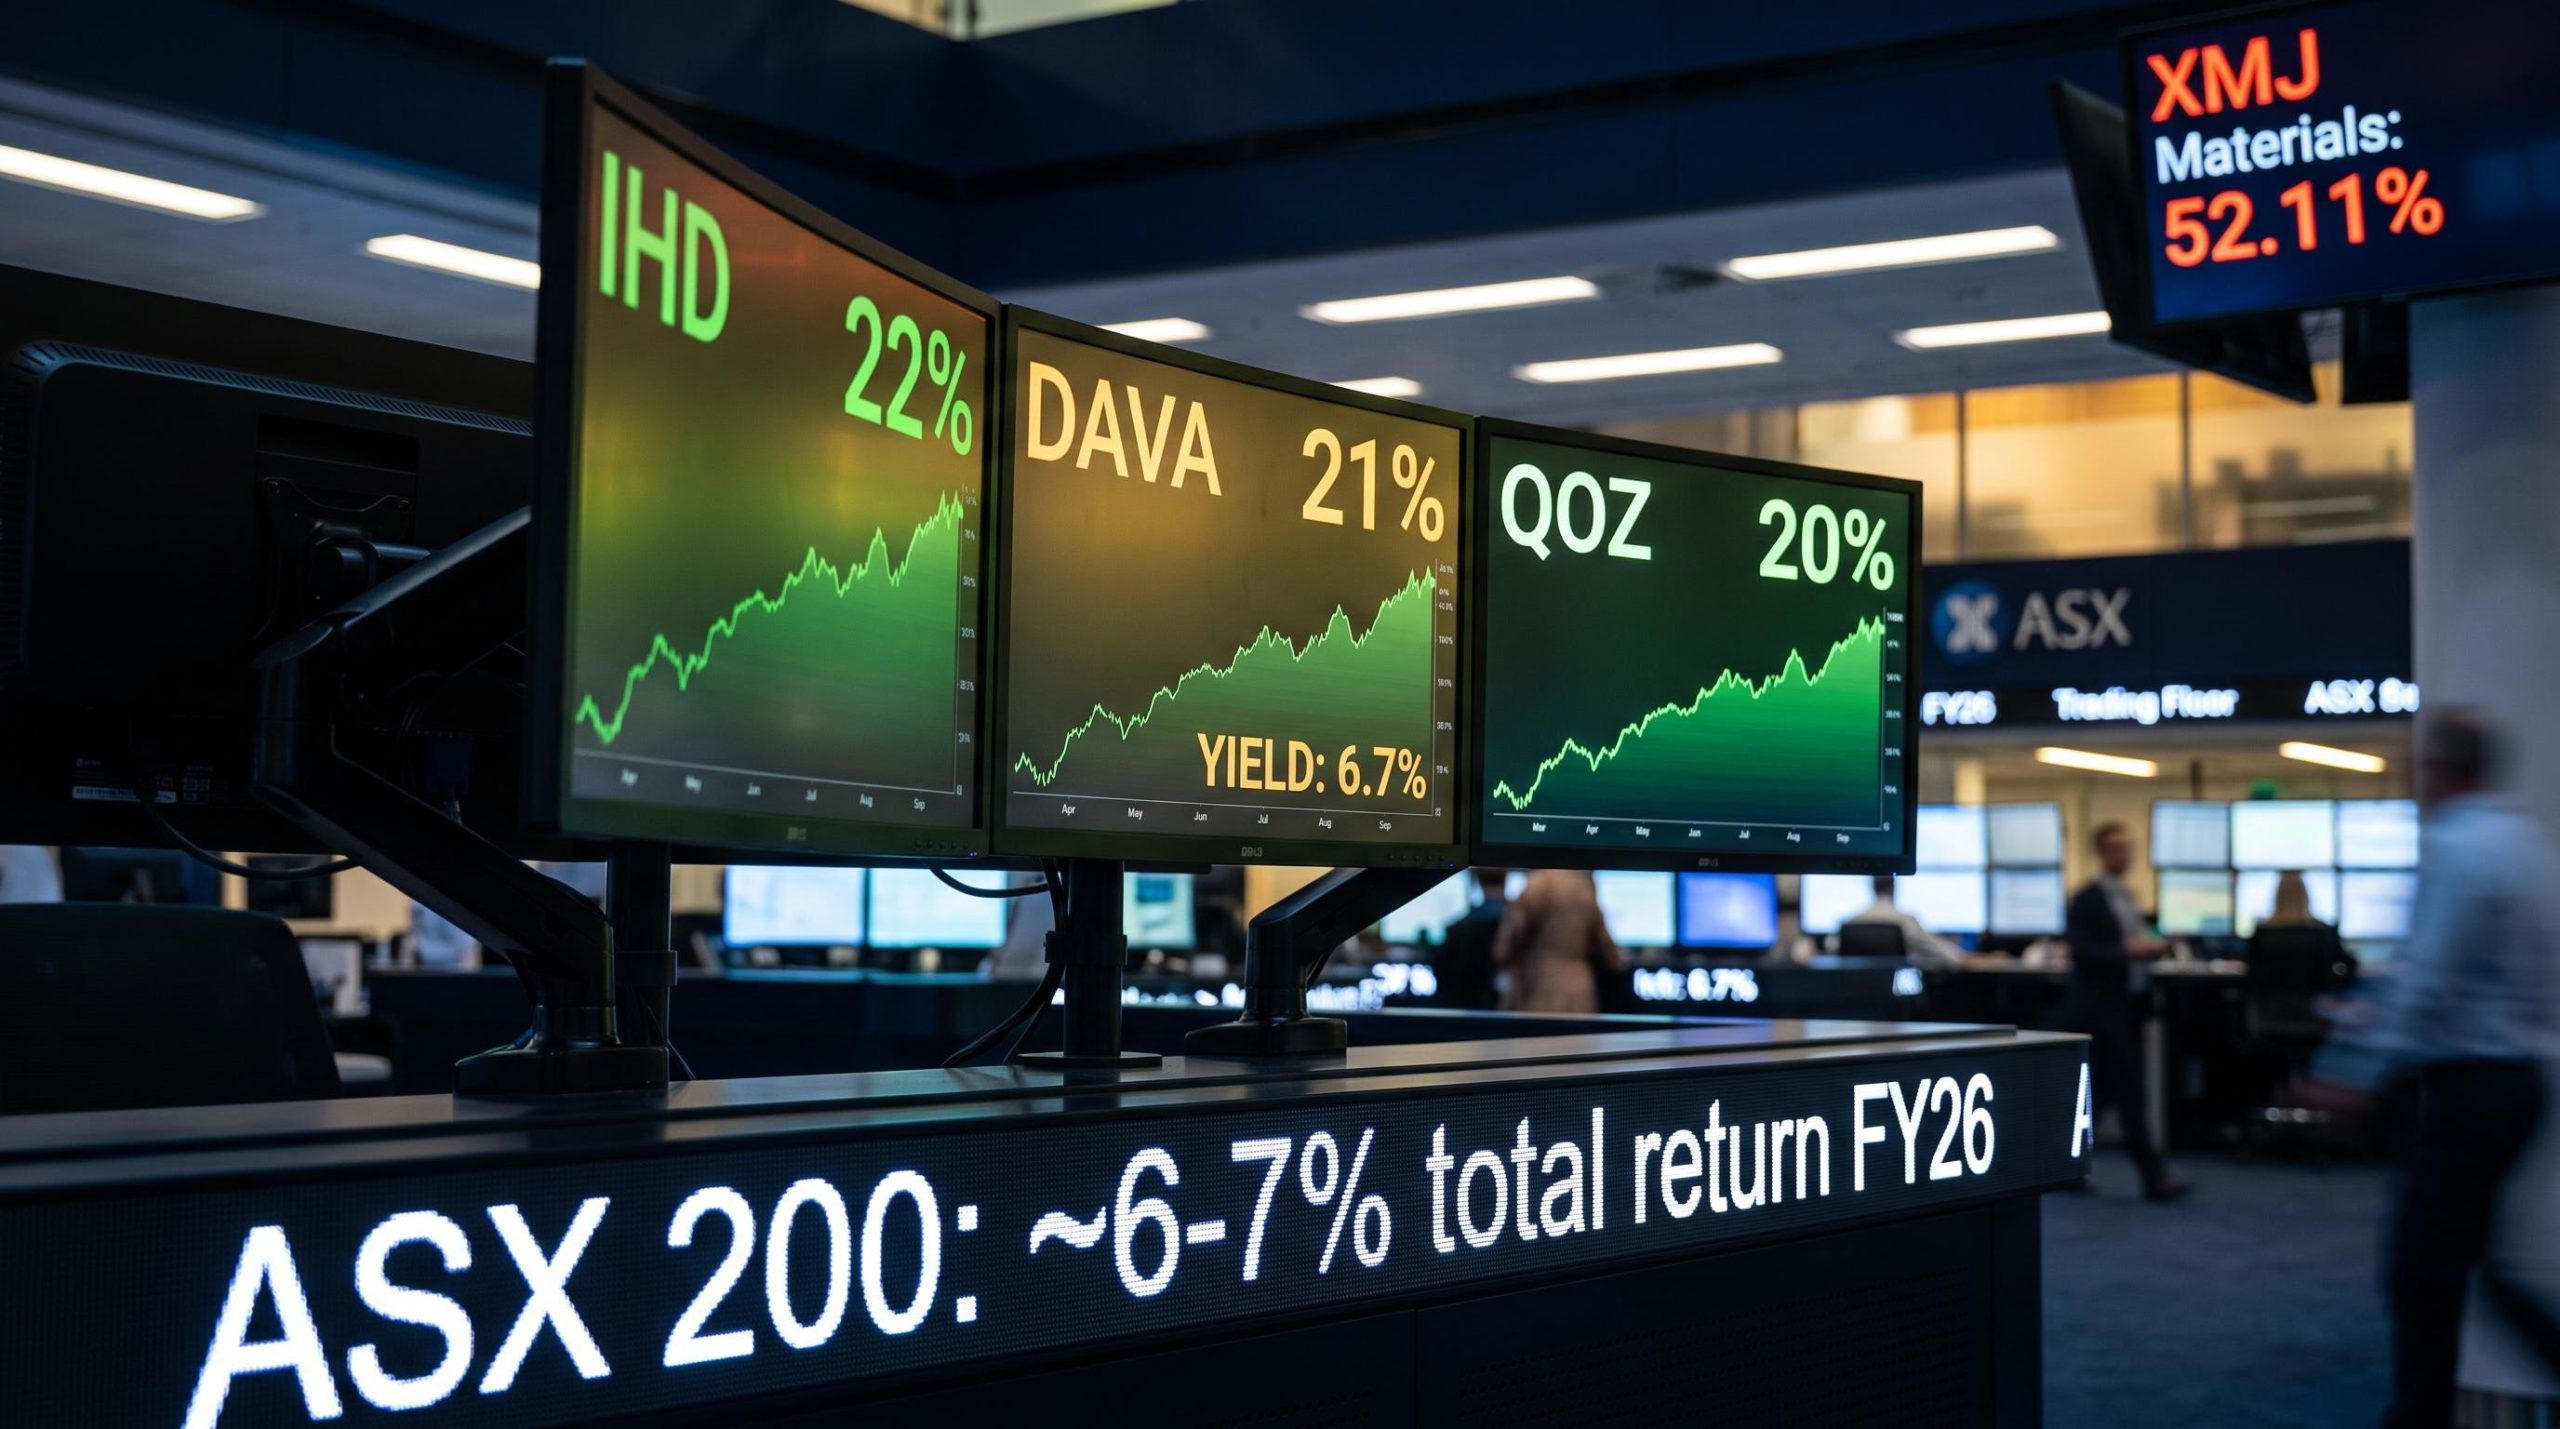
Mining ETFs posted 52% total returns in FY26. It was the headline, the dinner-party talking point, and the number that made every other strategy look like it was standing still. Three Australian equity funds with no deliberate resources tilt quietly returned 20-22% in the same period: iShares S&P/ASX Dividend Opportunities ESG Screened ETF (IHD), Dimensional Australian Value Trust Active ETF (DAVA), and BetaShares FTSE RAFI Australia 200 ETF (QOZ).
That matters if you avoided resources, whether out of ESG preference, sector-risk concerns, or simply because you missed the commodity run. The ASX 200 returned approximately 6-7% on a total-return basis in FY26. Each of these three funds delivered roughly three times that, without a single deliberate bet on mining or materials.
Here is how each of those strategies works, what risks come with them, and which investment philosophy, income-and-ESG, systematic value, or fundamental indexing, fits your own portfolio logic. The right answer is not whichever produced the biggest number.
Why FY26 looked like a mining-or-nothing year
The S&P/ASX 200 Materials Index (XMJ) delivered a 47.48% price return and a 52.11% total return in FY26. That is not a strong year. That is a generational outlier.
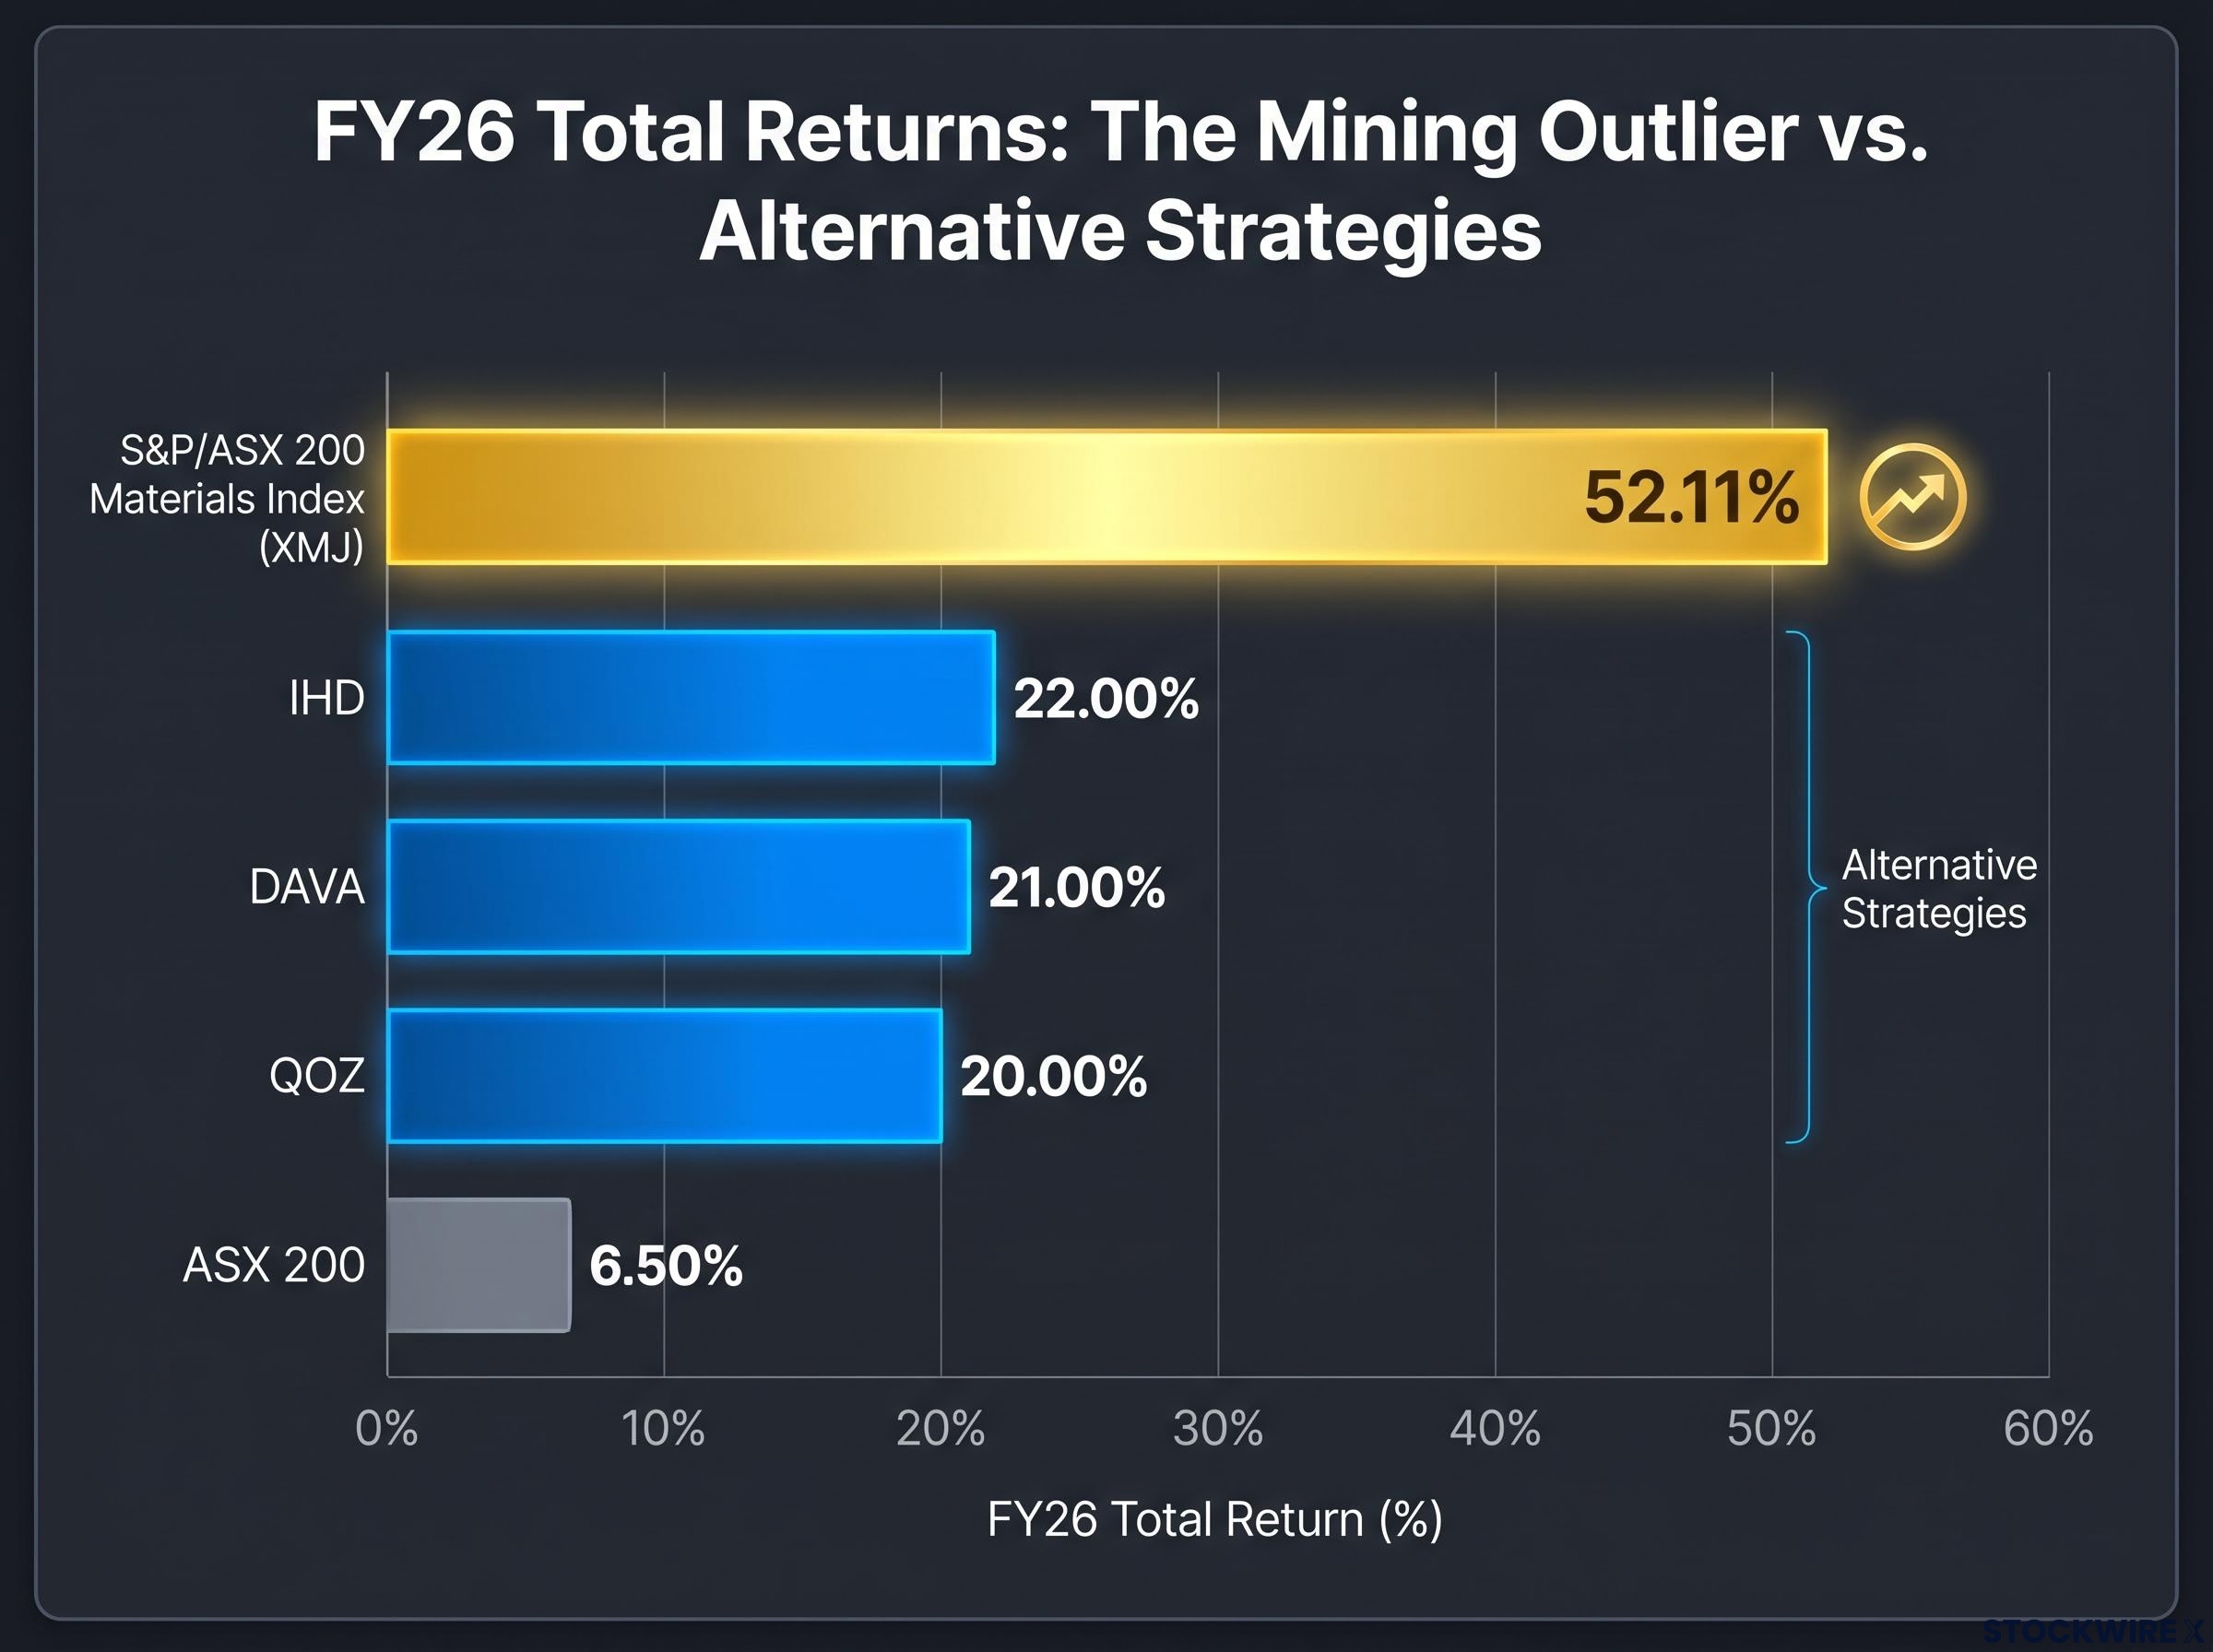
52.11% total return for the S&P/ASX 200 Materials Index in FY26, the single dominant sector return that shaped the year’s performance narrative.
Resources-heavy and commodity-linked ETFs filled the top of every performance table. Energy transition metals products like XMET, battery and lithium funds like ACDC, and rare earths strategies like GMTL captured most of the attention. The categories of outperformance were broad:
- Energy transition metals
- Battery and lithium
- Rare earths and critical minerals
Against the ASX 200’s approximately 6-7% total return, those numbers set a narrative trap. The gap between what resources did and what the broad market did made it easy to assume non-resources strategies were treading water. That assumption was wrong by a wide margin.
When big ASX news breaks, our subscribers know first
What makes an ETF truly “non-resources” in the Australian market
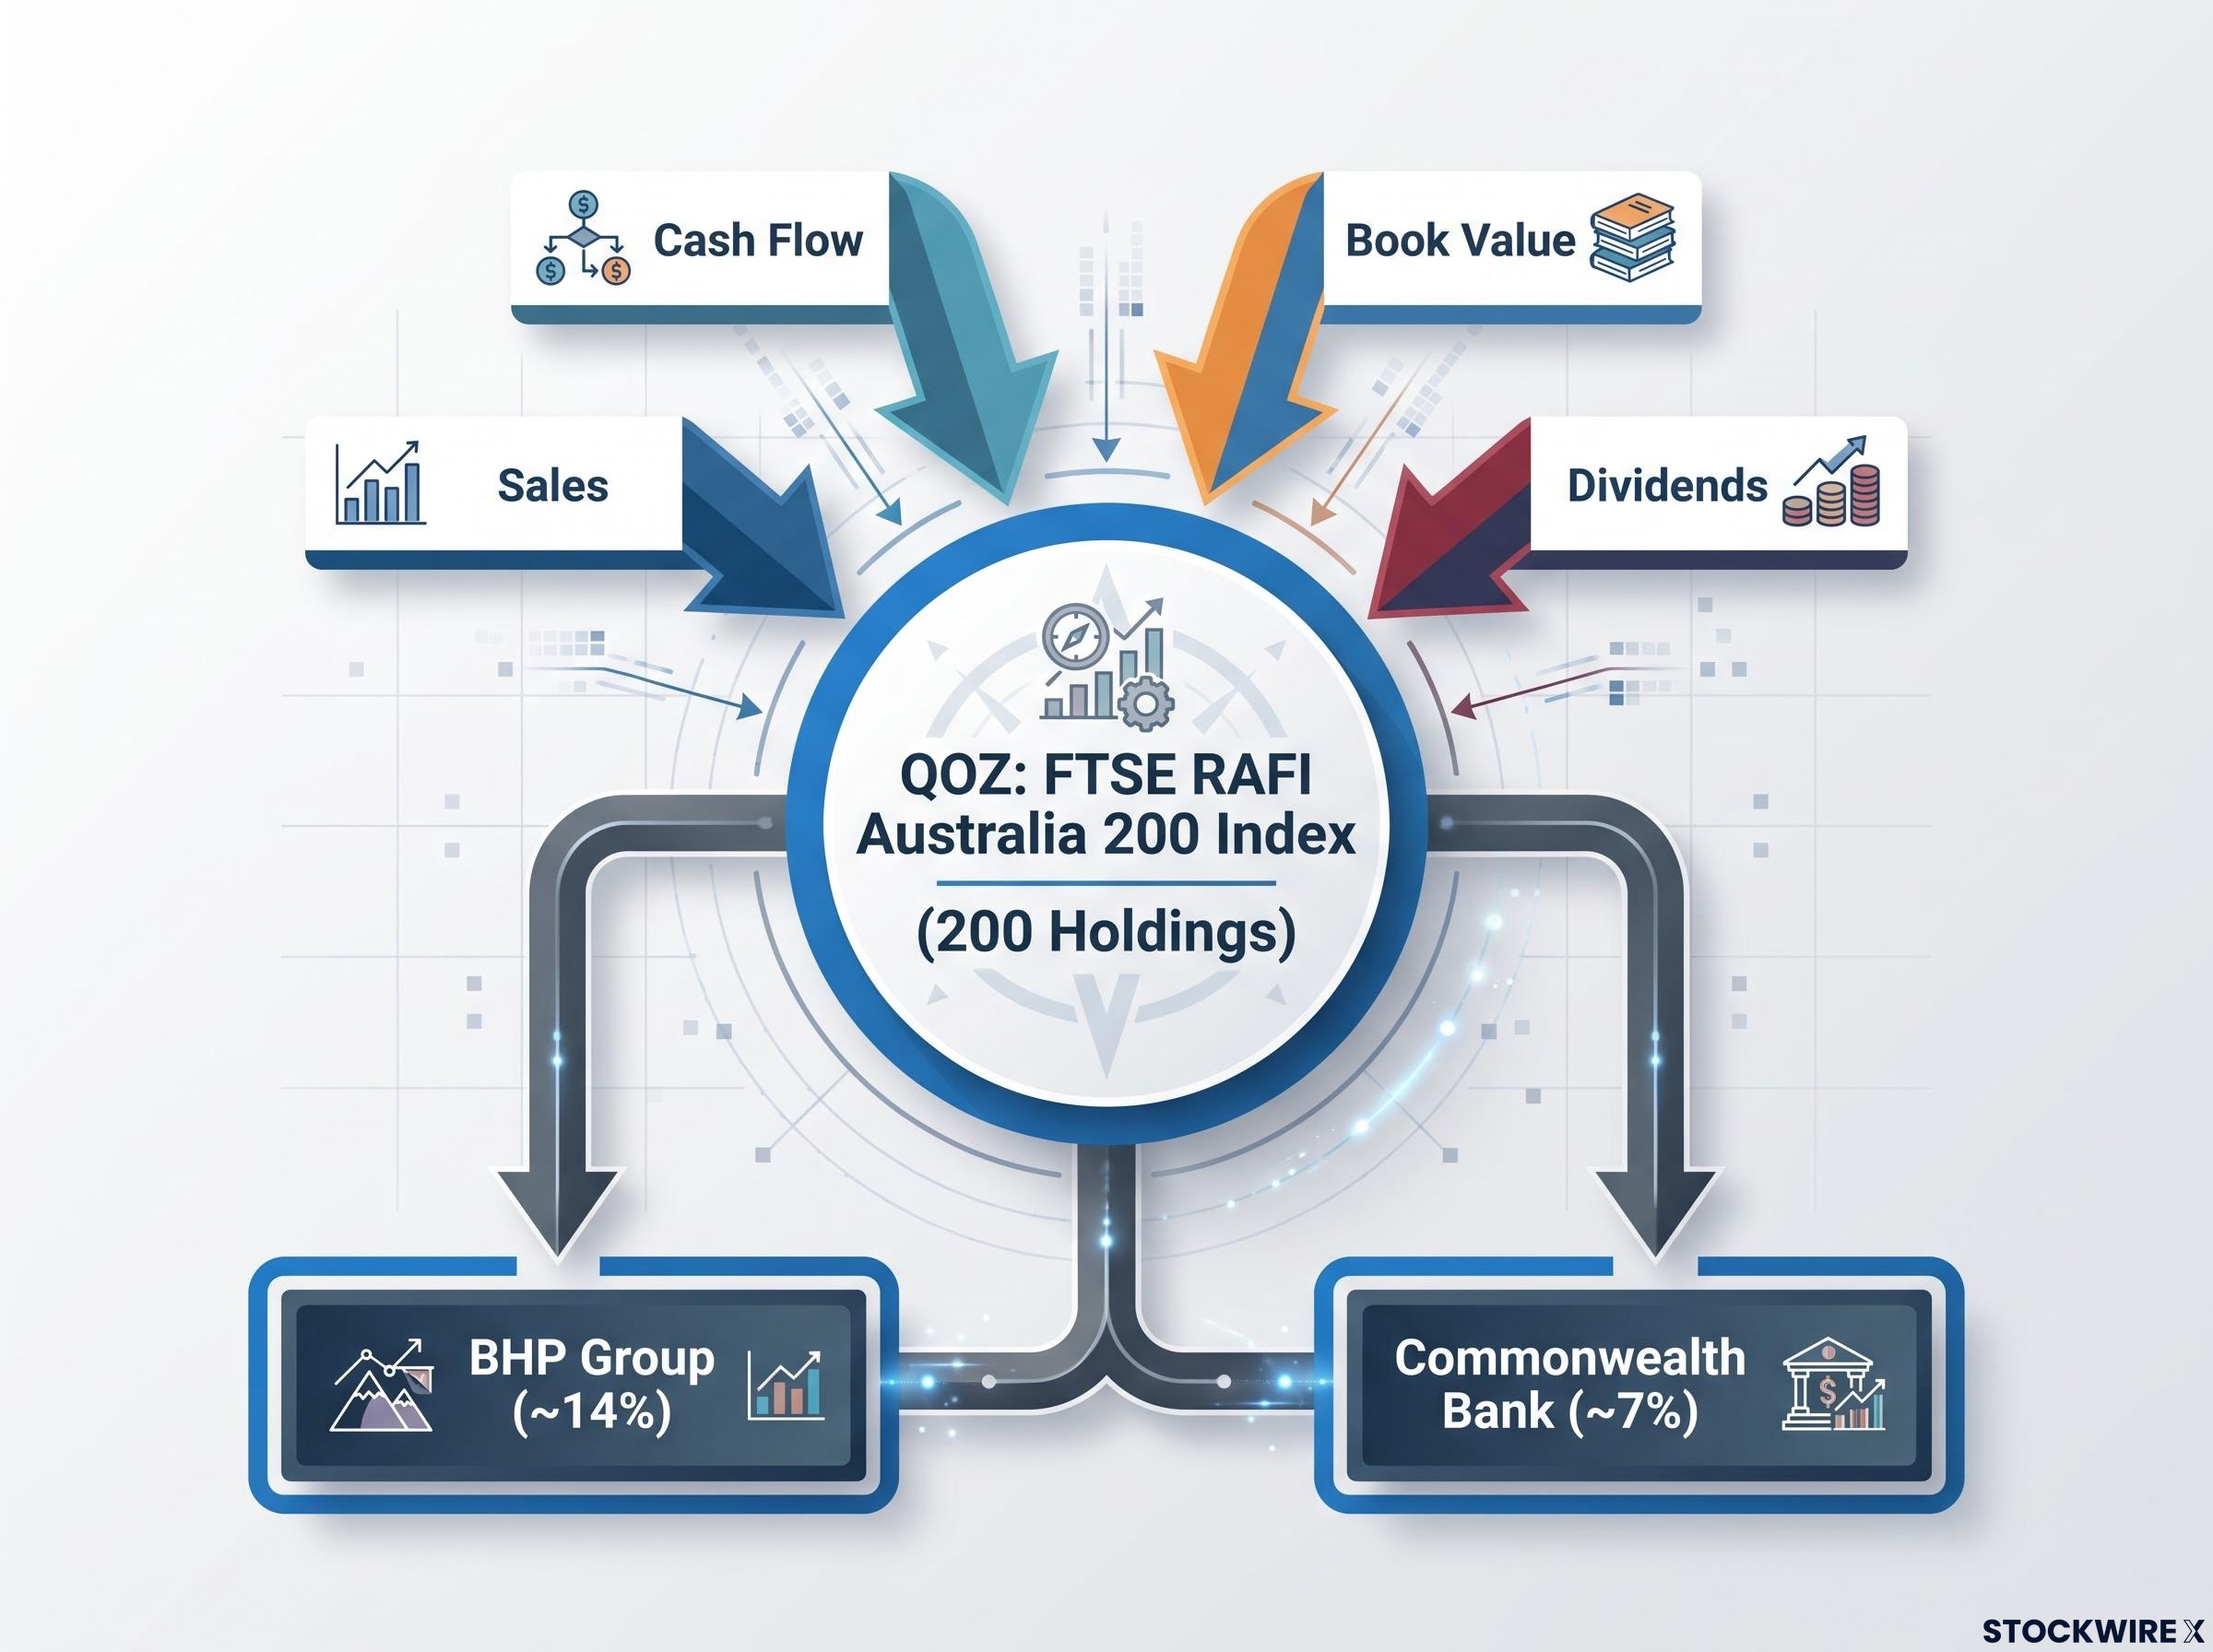
The Australian equity market is structurally tilted toward resources. Any domestic ETF will carry some indirect commodity exposure. QOZ, for instance, holds BHP Group at approximately 14% of the portfolio and Commonwealth Bank at approximately 7%, a weighting profile that reflects BHP’s economic scale, not a deliberate mining bet.
So “non-resources” in the Australian context is a spectrum, not a binary. The meaningful question is whether a strategy’s philosophy depends on commodity cycles for its returns. None of the three funds profiled here does. What they do instead falls into three distinct categories:
- IHD: ESG-screened income (high-dividend stocks filtered for ethical criteria)
- DAVA: Systematic value (rules-based selection targeting undervalued securities)
- QOZ: Fundamental indexing (weighting by economic measures rather than market price)
Knowing these are genuinely different approaches, not variations on the same theme, is what makes the performance comparison meaningful rather than cosmetic. These funds do not immunise you against commodity-driven volatility, but they do not depend on it for returns either.
IHD: 22% from dividend quality and ESG discipline
IHD returned 22% in FY26, the strongest result among the three.
22% total return for IHD in FY26, more than three times the ASX 200’s result, from a dividend-and-ESG strategy.
The ESG component works as an exclusions filter. IHD’s screen removes companies involved in controversial weapons, tobacco, and thermal coal. It does not wholesale exclude all resource companies. What remains is a concentrated portfolio of approximately 50 of the highest-yielding ASX shares, with sector weight concentrated in financials, consumer staples, healthcare, and infrastructure.
Distributions are paid quarterly, and the trailing 12-month yield sits at 4.0%, with franking credits available to boost after-tax income for eligible Australian investors. The fund carries an annual management fee of 0.23%, and its unit price was $17.06 on 24 July 2026.
Franking credit mechanics create meaningfully different after-tax outcomes across individual, super fund, and SMSF pension-phase accounts, with pension-phase SMSFs often receiving the full credit as a refundable tax offset, which can substantially lift the effective yield on a high-distribution fund like IHD beyond its stated 4.0%.
Three things to weigh before adding IHD:
- The 0.23% fee sits above the cheapest passive range (0.07-0.20%) but below active management levels
- Franking credits on distributions can meaningfully lift your after-tax yield, depending on your marginal tax rate
- Concentration risk is real: heavy exposure to banks and defensives means the portfolio’s fortunes track those sectors closely, and the ESG screen may exclude some high-yield names that would otherwise qualify
For an income-focused investor who avoided resources on ethical grounds, IHD’s FY26 result shows that a yield-and-screen strategy can generate capital growth well above the market average, not just reliable distributions.
DAVA: 21% through systematic value in a fundamentals-driven year
DAVA is likely the least familiar of the three for most retail investors. Dimensional Fund Advisors manages it as a systematic, rules-based strategy that targets securities appearing undervalued relative to fundamentals. This is not discretionary stock-picking. It is closer to “smart active”: disciplined, repeatable, and grounded in academic evidence about how value characteristics drive returns over time.
In FY26, that approach suited the environment outside resources. Earnings upgrades and fundamental re-ratings, rather than momentum or speculative flows, contributed to sector outperformance across the non-commodity parts of the market. The fund generated a total return of 21% over the period, carrying a trailing distribution yield of 6.7%, well above the other two funds profiled here, alongside an annual fee of 0.335%. As at 24 July 2026, units were priced at $30.86.
Three considerations for investors evaluating DAVA:
- The 0.335% fee is above the passive range (0.10-0.20%) but within normal bounds for active strategies; the premium pays for systematic methodology, not a star manager
- Distribution frequency is not confirmed in available source material; check the current Product Disclosure Statement (PDS) before assuming a payment cadence
- Style risk is the core trade-off: value strategies can underperform for extended periods when growth or momentum characteristics dominate, and one strong year does not eliminate that possibility
DAVA’s result is less a vindication of value investing broadly and more evidence that systematic, fundamentals-anchored selection can outperform even when one dominant sector captures all the headlines. If you are comfortable with the fee premium and the style-factor exposure that comes with it, DAVA offers a genuine alternative to passive or resources-heavy strategies.
QOZ: 20% by weighting companies on economic reality, not market price
Most Australian equity ETFs weight their holdings by market capitalisation: the bigger a company’s share price multiplied by shares outstanding, the larger its position. QOZ does something structurally different. It tracks the FTSE RAFI Australia 200 Index, which weights its 200 holdings by four measures of economic scale: sales, cash flow, book value, and dividends.
The practical effect is that companies trading at high valuations relative to their underlying economics get underweighted, while companies with strong fundamentals but lower market prices get overweighted. This is fundamental indexing, a methodology that systematically embeds a value tilt without being a pure value product.
Research Affiliates on fundamental indexing describes how weighting by economic measures such as sales, cash flow, book value, and dividends systematically breaks the link between market price and portfolio weight, delivering a dynamic value tilt that rebalances away from overvalued stocks as valuations stretch.
That is why BHP Group sits at approximately 14% of the portfolio. BHP’s weight reflects its economic scale measured by revenue, cash flow, and dividends, not a deliberate resources bet. The distinction matters. Commonwealth Bank follows at approximately 7%, rounding out a top-of-portfolio composition that looks different from a cap-weighted index in subtle but important ways.
The fund closed FY26 with a total return of 20%, a trailing distribution yield of 3.8%, and an annual management fee of 0.40%, the highest among the three funds covered here. Units were trading at $18.96 on 24 July 2026.
Three things to consider:
- The 0.40% fee is higher than most cap-weighted domestic ETFs (0.07-0.20%); the premium funds the differentiated RAFI methodology
- Tracking divergence versus the ASX 200 is a feature, not a flaw, but it means QOZ can lag meaningfully during momentum-driven rallies when highly valued growth stocks lead
- The BHP position means you are not avoiding resources entirely; you are accessing them through a fundamentals-justified weighting rather than a market-cap or thematic one
The true cost of owning an ETF extends well beyond the headline management fee, encompassing tracking difference, bid-ask spreads on every trade, and brokerage commissions that compound silently across long holding periods.
QOZ’s methodology is, at its core, a bet that company fundamentals matter more than market price over time. FY26’s result suggests that bet paid off even in a year when momentum, via mining, dominated the headline index.
Three different paths to the same result: choosing the right philosophy for your portfolio
The three funds landed within 2 percentage points of each other, yet the paths they took are genuinely different. The comparison below makes those trade-offs legible at a glance.
| Fund | Strategy | FY26 Total Return | Distribution Yield | Fee p.a. |
|---|---|---|---|---|
| IHD | ESG-screened dividend | 22% | 4.0% | 0.23% |
| DAVA | Systematic active value | 21% | 6.7% | 0.335% |
| QOZ | Fundamental indexing (RAFI) | 20% | 3.8% | 0.40% |
| ASX 200 | Cap-weighted benchmark | ~6-7% | — | — |
The selection question is not which returned the most. It is which philosophy is most likely to keep delivering in the conditions ahead of you, and that depends on what your portfolio is actually for.
If your priority is income with ethical guardrails, IHD offers the lowest fee and a quarterly distribution cadence suited to cash-flow-focused investors. If you want active management anchored in value characteristics and are comfortable with style-factor risk, DAVA offers the highest yield of the three but at a fee premium and with less certainty on distribution timing. If you want broad ASX coverage with a built-in value tilt and are willing to accept tracking divergence from the cap-weighted benchmark, QOZ provides a fundamentally different answer to how a domestic equity portfolio should be constructed.
Factor tilt construction in a live portfolio requires position limits, sector caps, and drift-based rebalancing triggers to prevent a value or fundamental screen from collapsing into an unintended concentrated bet, a consideration that applies directly to investors combining DAVA and QOZ within the same domestic equity allocation.
FY26 demonstrated that multiple non-resources philosophies can outperform the broad market by a wide margin. Past performance is not a reliable indicator of future returns. The appropriate choice depends on whether your goal is income, capital growth, or broad diversification with a fundamental anchor.
This article is for informational purposes only and does not constitute financial advice. Past performance is not a reliable indicator of future returns. Investors should read the relevant Product Disclosure Statement (PDS) and consider their personal financial circumstances before making any investment decisions.