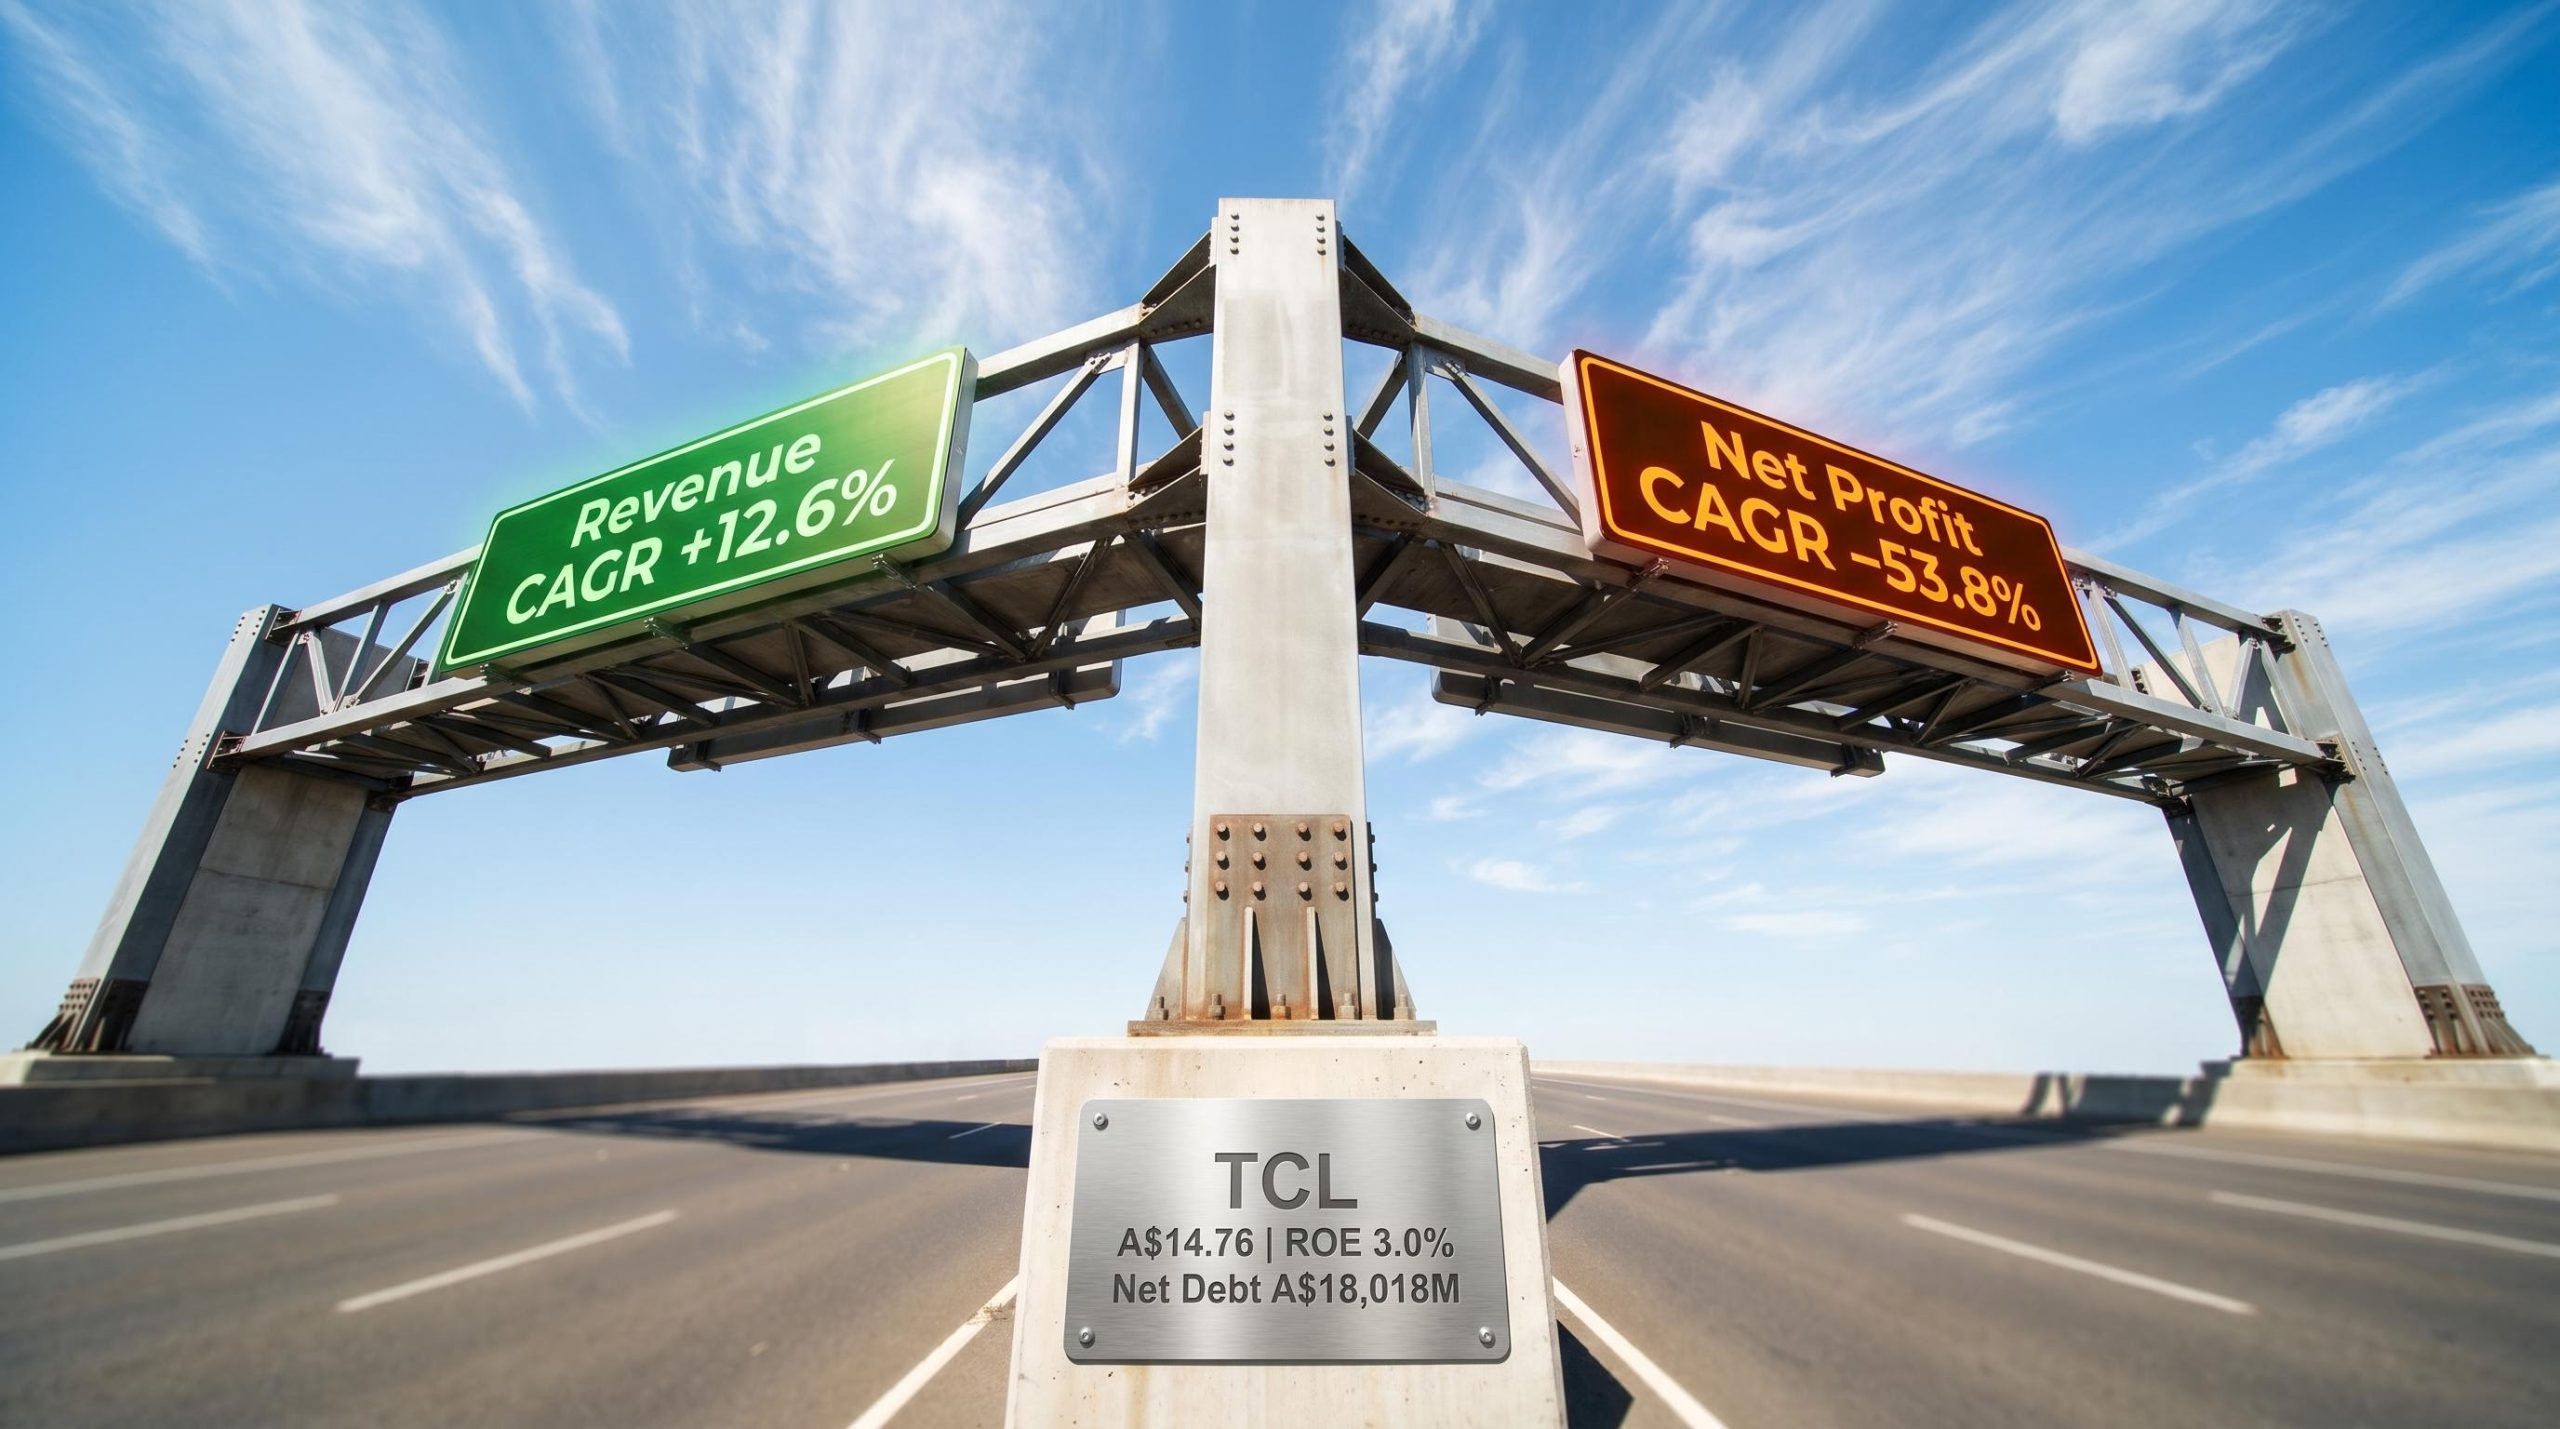
Transurban has grown revenue at a compound annual rate of 12.6% for three consecutive years. Over the same period, its net profit has fallen at a compound annual rate of 53.8%. Both statements are true, and together they define the central puzzle facing anyone researching the Transurban share price today. With the stock trading at approximately A$14.76 (close, 15 May 2026) and a market capitalisation of around A$45.68 billion, Transurban is one of the largest infrastructure names on the ASX. Its surface metrics look like a growth story. Its earnings metrics tell a different story entirely. This analysis unpacks what is actually driving the profit collapse, what the company’s debt load and low return on equity mean in practice for shareholders, how the higher-rate environment is reshaping the investment case for toll road operators broadly, and what questions investors should be asking before forming a position.
Revenue is rising strongly, but reported profit has collapsed
The numbers, placed side by side, do the work themselves.
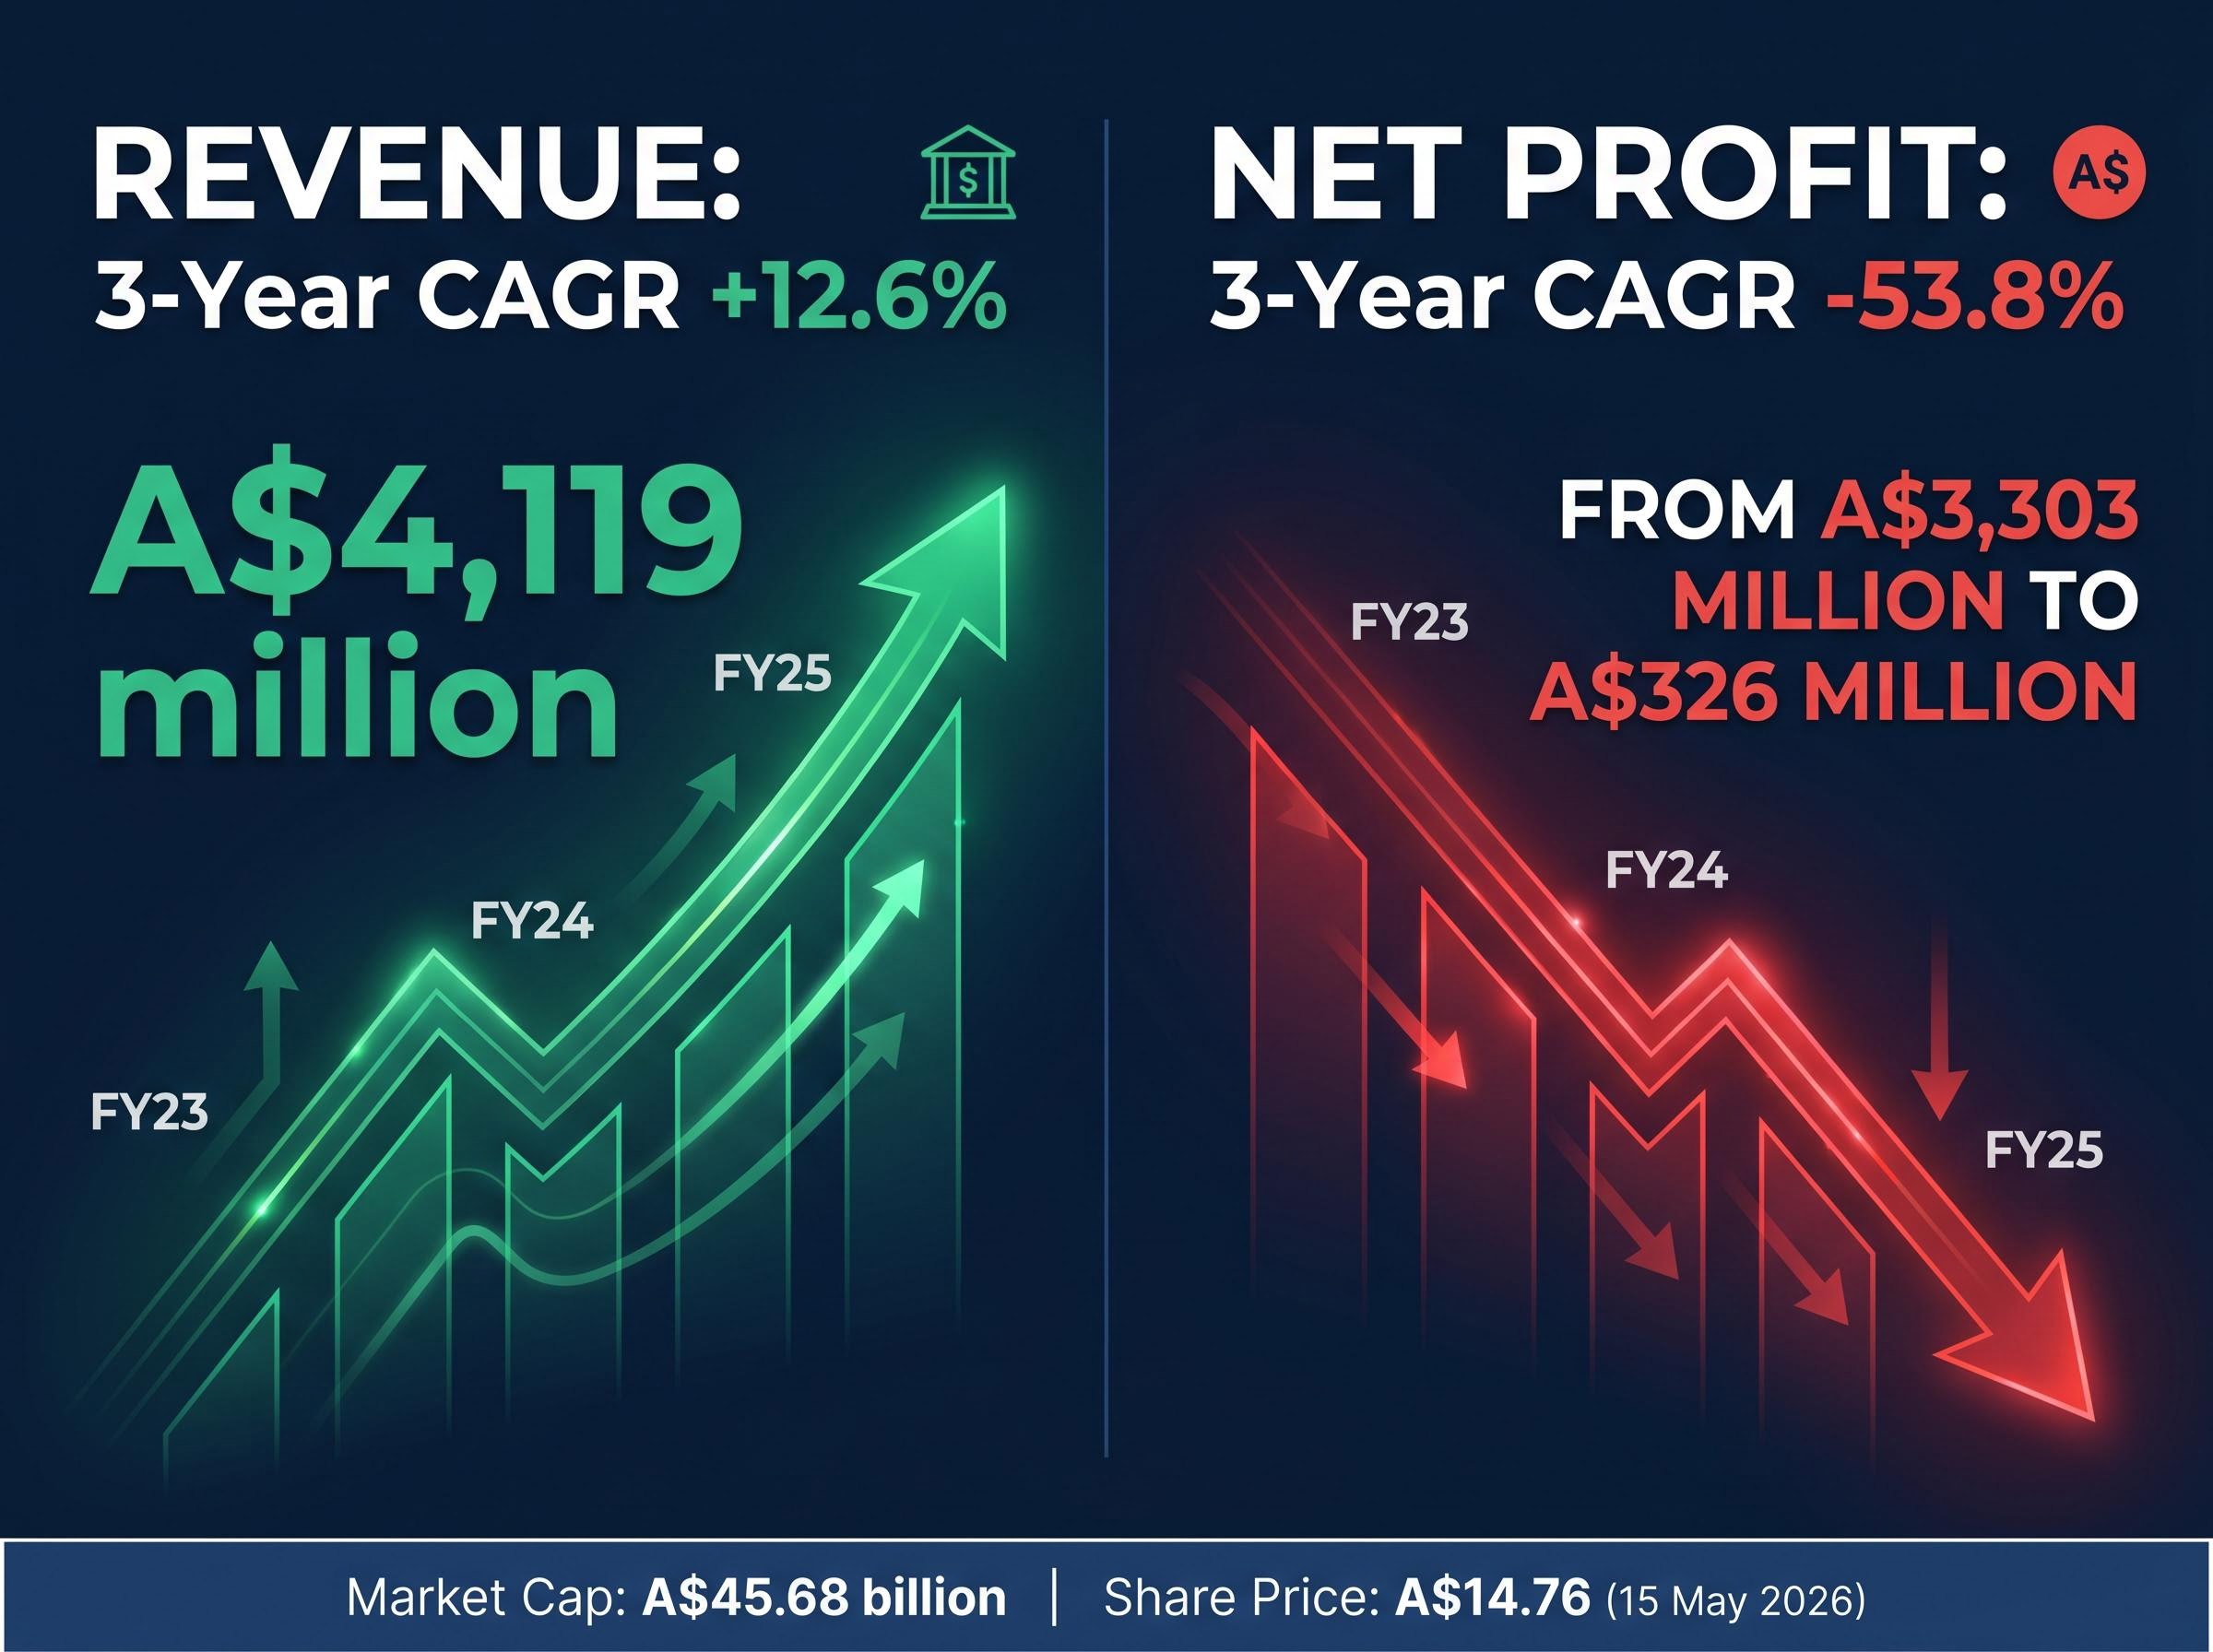
Transurban’s most recently reported annual revenue came in at A$4,119 million, the latest print in a three-year run of 12.6% compound annual growth. Over the same three-year window, net profit fell from A$3,303 million to A$326 million, a compound annual decline of approximately 53.8%.
A$326 million in net profit on A$4,119 million in revenue, after three years of double-digit top-line growth. The earnings CAGR over that period: approximately -53.8%.
That gap is not a rounding error. It is the single most important framing question for anyone evaluating this stock at A$14.76 and a market capitalisation of A$45.68 billion.
| Metric | Three-year CAGR |
|---|---|
| Revenue | +12.6% |
| Net profit | -53.8% |
Revenue growth has not translated into earnings growth. The sections that follow explain why, and whether the divergence is temporary, structural, or some combination of both.
When big ASX news breaks, our subscribers know first
What is actually driving the profit decline
Management’s own commentary, across the FY24 results release (8 August 2024) and the 1H25 half-year report (6 February 2025), identifies four primary drivers. They range from accounting noise to structural cost pressures, and the distinction between the two categories matters more than the headline number.
Non-recurring items that inflated prior-year profit
The first two drivers are volatile and, in management’s framing, largely non-recurring:
- Lower non-cash revaluation gains. In FY23, Transurban booked large fair-value gains on financial instruments and certain concession assets. These did not repeat in FY24 or 1H25, creating a steep year-on-year decline in statutory profit that had little to do with the operating business.
- Foreign exchange remeasurements and one-off items. FX translation effects on North American assets, combined with transaction costs and impairment of certain development costs, were flagged as significant items affecting reported profit.
These are real accounting entries, but they are not repeatable revenue streams. Their absence deflates reported profit without signalling operational deterioration.
Structural pressures that will not simply reverse
The remaining two drivers are harder to dismiss:
- Higher net finance costs. Interest expense rose materially as floating-rate and refinanced debt repriced at higher base rates, and total debt balances increased as projects were funded. Net finance costs have grown faster than toll revenue, compressing reported earnings.
- Rising depreciation and amortisation. As new assets entered service and concession lives shortened, the non-cash D&A charge increased. This widened the gap between statutory profit and cash flow generation.
Management has been explicit that the profit decline is not attributed to collapsing traffic or toll revenue. Free cash flow per security increased in FY24, and distributions are set by cash flow, not statutory profit. That framing is accurate on its own terms, but it does not make the earnings decline irrelevant. Equity valuations ultimately track earnings power, not just distribution capacity.
Understanding Transurban’s business model and why profit looks different here
Toll road operators are not conventional equities, and reading their financials as though they were leads to consistent misinterpretation.
Transurban operates 22 urban motorways across Australia, Canada, and the United States. The Australian corridors, including CityLink in Melbourne, Hills M2 in Sydney, and Logan Motorway in Brisbane, form the core of the portfolio. The business model follows a three-step logic:
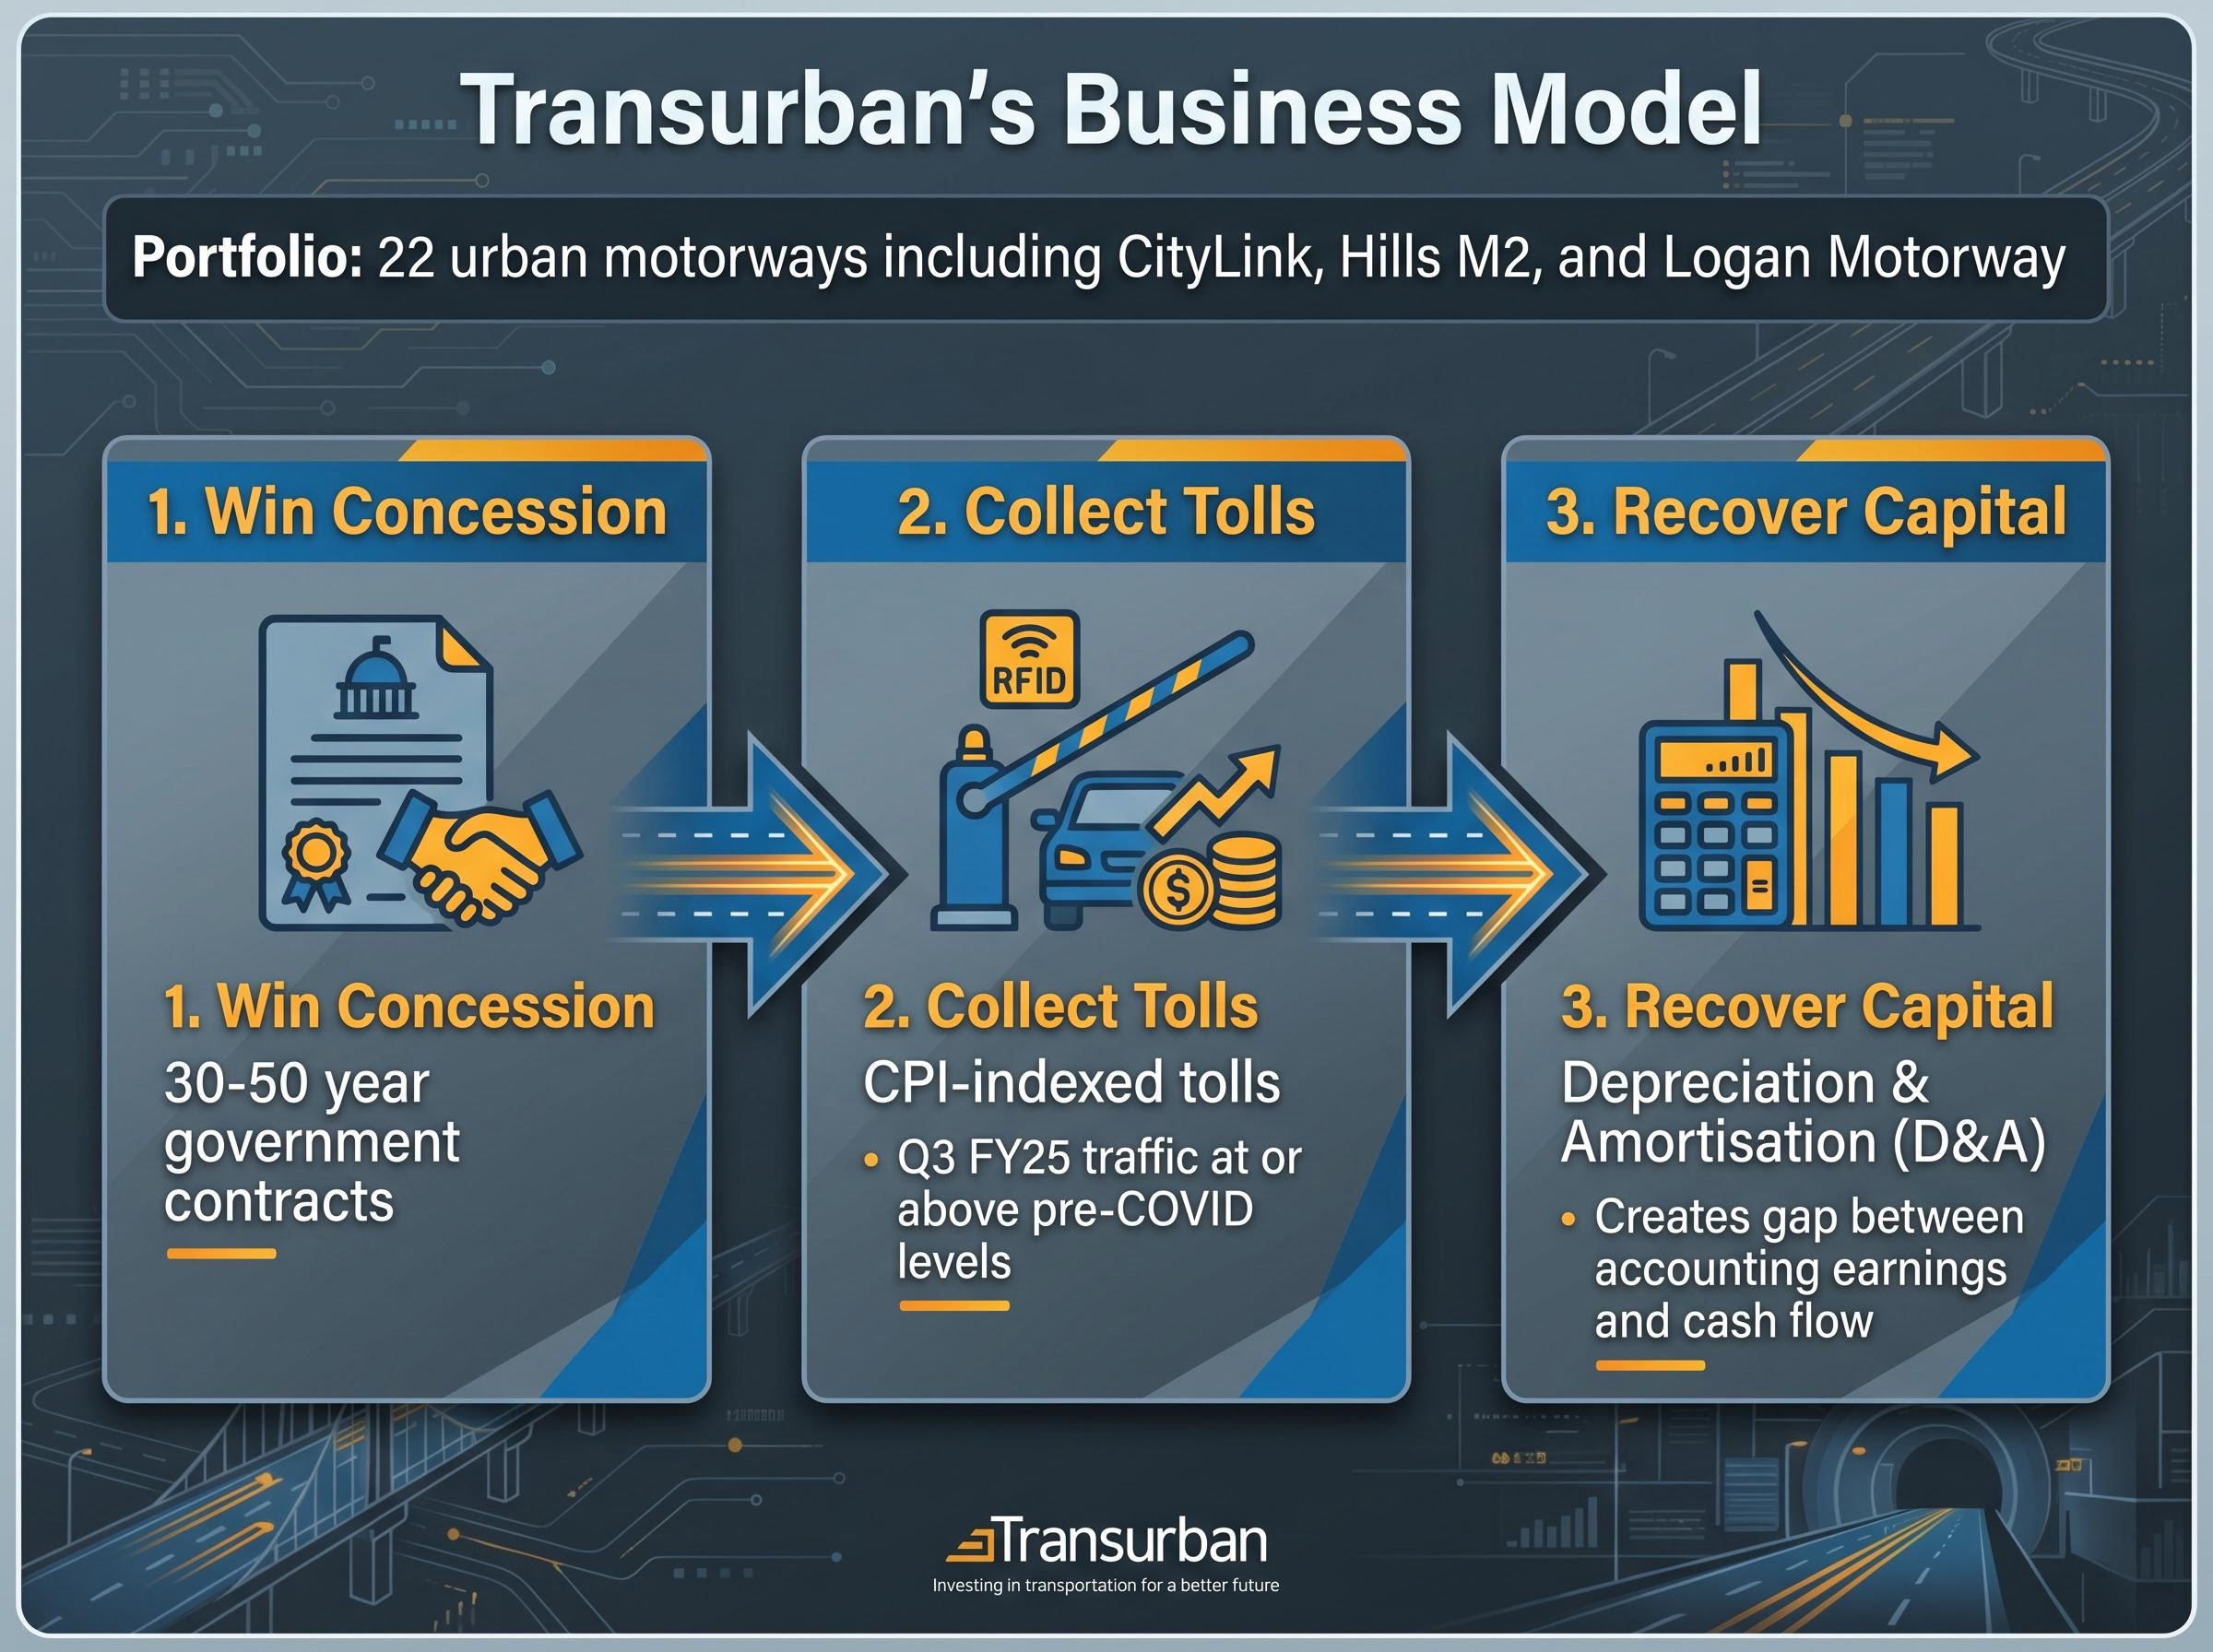
- Win a long-dated government concession to build, operate, and toll a motorway, typically for 30-50 years. The upfront capital cost is enormous.
- Collect tolls indexed to CPI over the concession life, generating cash flows that grow with inflation and traffic. The Q3 FY25 traffic and revenue update (17 April 2025) confirmed all major corridors are operating at or above pre-COVID traffic levels, with revenue growing via both volume and CPI-indexed toll increases.
- Recover the capital cost through depreciation and amortisation charged against statutory profit over the concession life, creating a persistent gap between accounting earnings and cash generation.
This structure means statutory net profit will almost always understate the cash the business produces. Fair-value movements on financial instruments and concession revaluations add further volatility to reported earnings that has no cash equivalent.
The Grattan Institute’s October 2025 report, “Paying for Roads in a High-Rate World,” noted that private toll road concessions designed in a low-rate environment can still be viable, but equity returns are squeezed as financing costs normalise. The implication: equity holders, not taxpayers, will bear more of the pain.
CPI linkage provides a partial inflation hedge. It does not, however, protect against rising interest costs when debt levels are as high as Transurban’s.
Debt, ROE, and what they tell investors about the real cost of owning TCL
The explanatory framework above accounts for why reported profit looks weak. This section asks a different question: is shareholder capital working hard enough to justify the current share price?
| Metric | Value | Risk implication |
|---|---|---|
| Net debt | A$18,018 million | Material refinancing exposure as legacy low-rate debt matures through FY28 |
| Debt-to-equity | 175.1% | Amplifies sensitivity to rate movements and credit spread widening |
| Return on equity (FY24) | 3.0% | Below cost of equity; implies accounting value destruction, not creation |
A 3.0% ROE against a cost of equity estimated in the high teens (a comparison drawn in Australian Financial Review commentary on Transurban’s capital efficiency) implies the business is currently destroying rather than creating economic value in accounting terms.
Management’s counterargument is that distributions are cash-flow-supported and that statutory ROE understates the real return profile of long-dated infrastructure assets. There is merit to this view. But the tension between a healthy distribution yield and a sub-5% accounting return on equity is one that broker coverage has consistently flagged. Morgan Stanley retained an underweight stance on TCL, citing elevated net debt and rate sensitivity. UBS noted the stock trades at an EV/EBITDA premium to global peers despite the sub-5% post-tax ROE. Morningstar characterised TCL as “roughly fairly valued” for a long-duration bond substitute.
At A$14.76, investors need to judge whether the distribution yield compensates adequately for the balance-sheet risk the numbers describe.
Credit rating mechanics for leveraged infrastructure operators, illustrated by APA Group’s April 2026 Moody’s affirmation, show that investment-grade ratings are preserved through FFO/debt thresholds rather than absolute debt levels, a framework that contextualises why Transurban’s A$18 billion net debt position is not automatically a credit concern if cash flow coverage ratios remain within agency parameters.
The rate environment is the swing factor the market cannot yet price with confidence
Listed infrastructure stocks like TCL function as bond proxies. Their long-dated, inflation-linked cash flows attract capital seeking yield and duration, which means their share prices move inversely with long-term bond yields. When yields rise, the present value of those distant cash flows falls, and the multiple investors are willing to pay compresses.
The same rate transmission channels that compress REIT valuations apply with equal force to listed toll road operators: rising discount rates reduce the present value of distant cash flows, higher debt service costs eat into distributable income, and yield competition from government bonds narrows the premium investors demand for holding equity risk.
This mechanism is the single largest unresolved variable in the Transurban investment case. Three distinct but related risks sit within it:
- Rate sensitivity. The RBA Financial Stability Review (March 2025) noted that elevated interest rates reduce the present value of long-duration cash flows for highly leveraged infrastructure entities. Macquarie research reached a similar conclusion: toll road price-to-cash-flow multiples should compress in a higher-for-longer scenario unless operators materially deleverage or accelerate growth.
- Refinancing risk. With A$18,018 million in net debt and material maturities through FY28, the cost at which Transurban refinances will directly affect earnings per security. Higher base rates and wider credit spreads flow straight to the bottom line.
- Regulatory risk. Policy scrutiny in NSW, including the IPART tolling review and the state government’s weekly toll cap scheme, has intensified. These developments have not yet altered concession economics, but they represent a medium-term risk to future negotiations and renewals.
The WestConnex debt structure offers a concrete illustration of how Transurban manages refinancing risk at the asset level: the April 2026 dual-tranche bond issuance staggered A$660 million of maturities to 2032 and A$550 million to 2036, ring-fenced from the TCL group balance sheet and sized to avoid a single concentrated refinancing event.
The RBA Financial Stability Review (April 2025) identified elevated leverage as a key vulnerability for corporate entities exposed to prolonged higher interest rates, noting that stress has picked up in pockets of the corporate sector where profits are under pressure, a dynamic that maps directly onto Transurban’s widening gap between cash generation and statutory earnings.
Regulatory risk is real but not yet crystallised
The NSW weekly toll cap is a government-funded rebate to motorists, not a direct reduction in Transurban’s contracted tolls. The IPART review has been completed and signals a potential shift toward distance-based tolling, but as at May 2026, no ASX disclosure has announced a formal concession restructuring. The risk is prospective, not current; investors should monitor it without pricing in a change that has not been formally proposed.
The NSW Independent Toll Review final report recommended that tolls shift to a declining distance-per-kilometre basis with IPART oversight of future toll setting, a structural change to the pricing framework that, if legislated, would represent a material departure from the CPI-indexed concession model Transurban’s current asset valuations assume.
Infrastructure Partnerships Australia’s May 2025 market update captured the sector tension precisely: listed infrastructure operators benefit from CPI-linked pricing but face margin pressure when interest and construction costs escalate faster than traffic or toll revenue growth.
What investors should weigh up before taking a position on TCL
The preceding analysis leaves the investment case in genuine tension. Transurban owns high-quality assets with inflation-linked revenue that is growing. It also carries A$18 billion in net debt, a 3.0% ROE, and a share price that broker coverage describes as ranging from roughly fair (Morningstar) to “expensive defensive” (Goldman Sachs, as characterised in media coverage).
Before forming a position at A$14.76 and a market capitalisation of A$45.68 billion, the following questions deserve specific answers:
- What is your view on long-term Australian bond yields over the next three to five years? TCL’s valuation is more sensitive to this single variable than to any operational metric. If rates stay elevated, the multiple compresses. If rates fall, the stock re-rates.
- Can you distinguish which parts of the profit decline are non-recurring and which are structural? Treating the entire -53.8% earnings CAGR as accounting noise would be as misleading as treating it all as operational failure.
- What is the current trailing distribution yield, verified against Transurban’s investor centre? Research identified uncertainty around yield calculations at recent price levels; the actual figure should be confirmed directly before drawing income conclusions.
- How does TCL’s debt-to-equity ratio of 175.1% compare to global infrastructure peers? A premium valuation on a high-leverage name requires conviction that refinancing risk is manageable at current spreads.
- Does a 3.0% ROE, against a cost of equity estimated in the high teens, represent a return profile you are willing to accept? The cash-flow story may be sound, but the accounting return on equity implies value destruction. These two readings need to be reconciled, not ignored.
- Have you benchmarked TCL against other ASX-listed infrastructure names on yield, debt, and ROE? Relative value is where the practical investment decision lives, not in TCL’s numbers in isolation.
Atlas Arteria’s results from FY25 provide a direct comparison point: the ASX-listed toll road operator posted 9.4% proportional revenue growth and maintained 75% EBITDA margins while statutory profit was compressed by French tax headwinds, a pattern structurally similar to the divergence between Transurban’s top-line growth and its reported earnings.
TCL’s contradiction will resolve one way or the other, and investors need a view on which
The investment case for Transurban sits in a genuine tension between strong asset quality and CPI-linked revenue on one side, and a sharply deteriorating profit trajectory with material balance-sheet risk on the other. Morningstar’s “roughly fairly valued” assessment and Goldman Sachs’s “expensive defensive” characterisation leave investors in uncertain territory rather than facing a clear signal.
TCL may be appropriate for investors with a specific, considered view on the rate cycle. It is less suitable as a default allocation made on the comfort of infrastructure’s defensive reputation alone. The revenue-versus-profit divergence will resolve, either through lower rates easing finance costs, or through a sustained re-rating that acknowledges the structural pressures. Investors should verify the current distribution yield directly from Transurban’s investor centre before drawing income conclusions.
This article is for informational purposes only and should not be considered financial advice. Investors should conduct their own research and consult with financial professionals before making investment decisions. Past performance does not guarantee future results. Financial projections are subject to market conditions and various risk factors.