
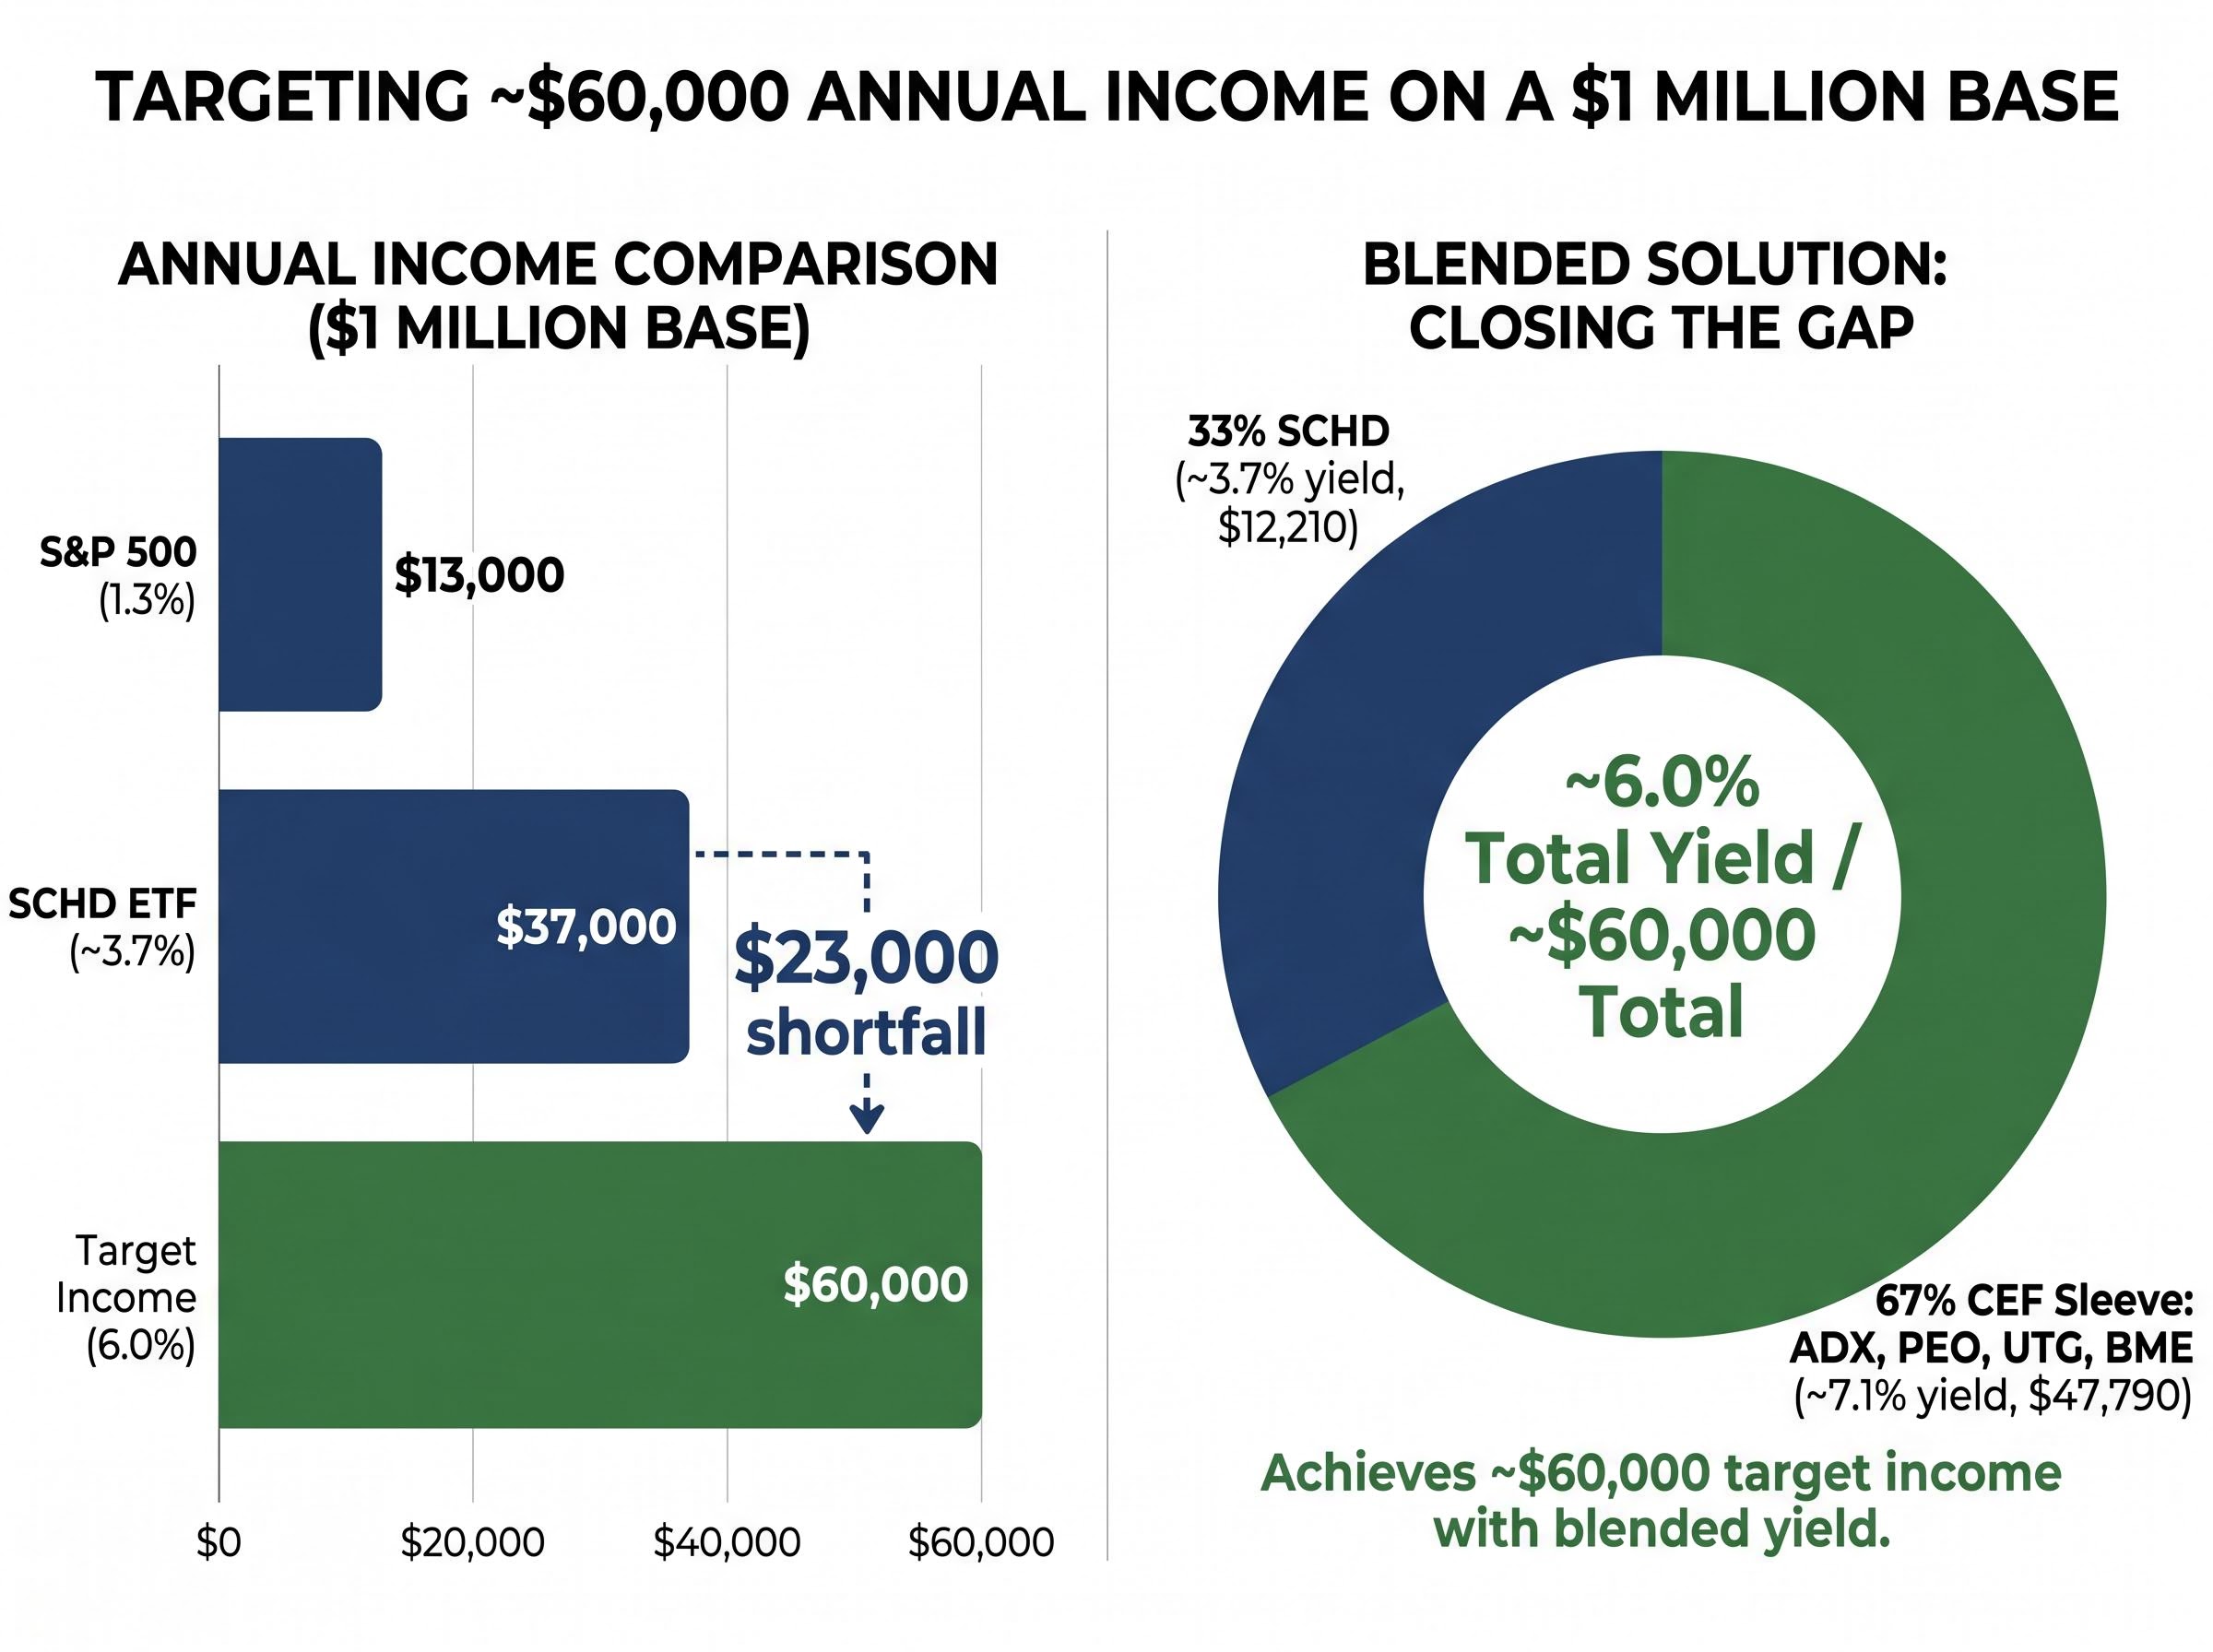
A $1 million portfolio invested in the S&P 500 yields roughly 1.3%, which translates to about $13,000 a year. For a retiree targeting $60,000 in annual income, that figure is not close. It is not even half. Reaching $60,000 requires a 6% weighted average yield across the portfolio, and most dividend-focused ETFs fall well short of that threshold in isolation. Schwab U.S. Dividend Equity ETF (SCHD), one of the most widely held dividend growth funds, yields approximately 3.7%, enough to generate about $37,000 on a million-dollar base but still $23,000 short of the target.
The gap between SCHD’s yield and the 6% target is precisely where portfolio construction decisions become critical. What follows is a concrete framework: how SCHD anchors a dividend retirement portfolio for quality and growth, which closed-end funds close the yield gap, how a 33/67 allocation blends to 6%, and what the real sustainability risks are at that income level.
How SCHD selects the stocks that drive its dividend growth
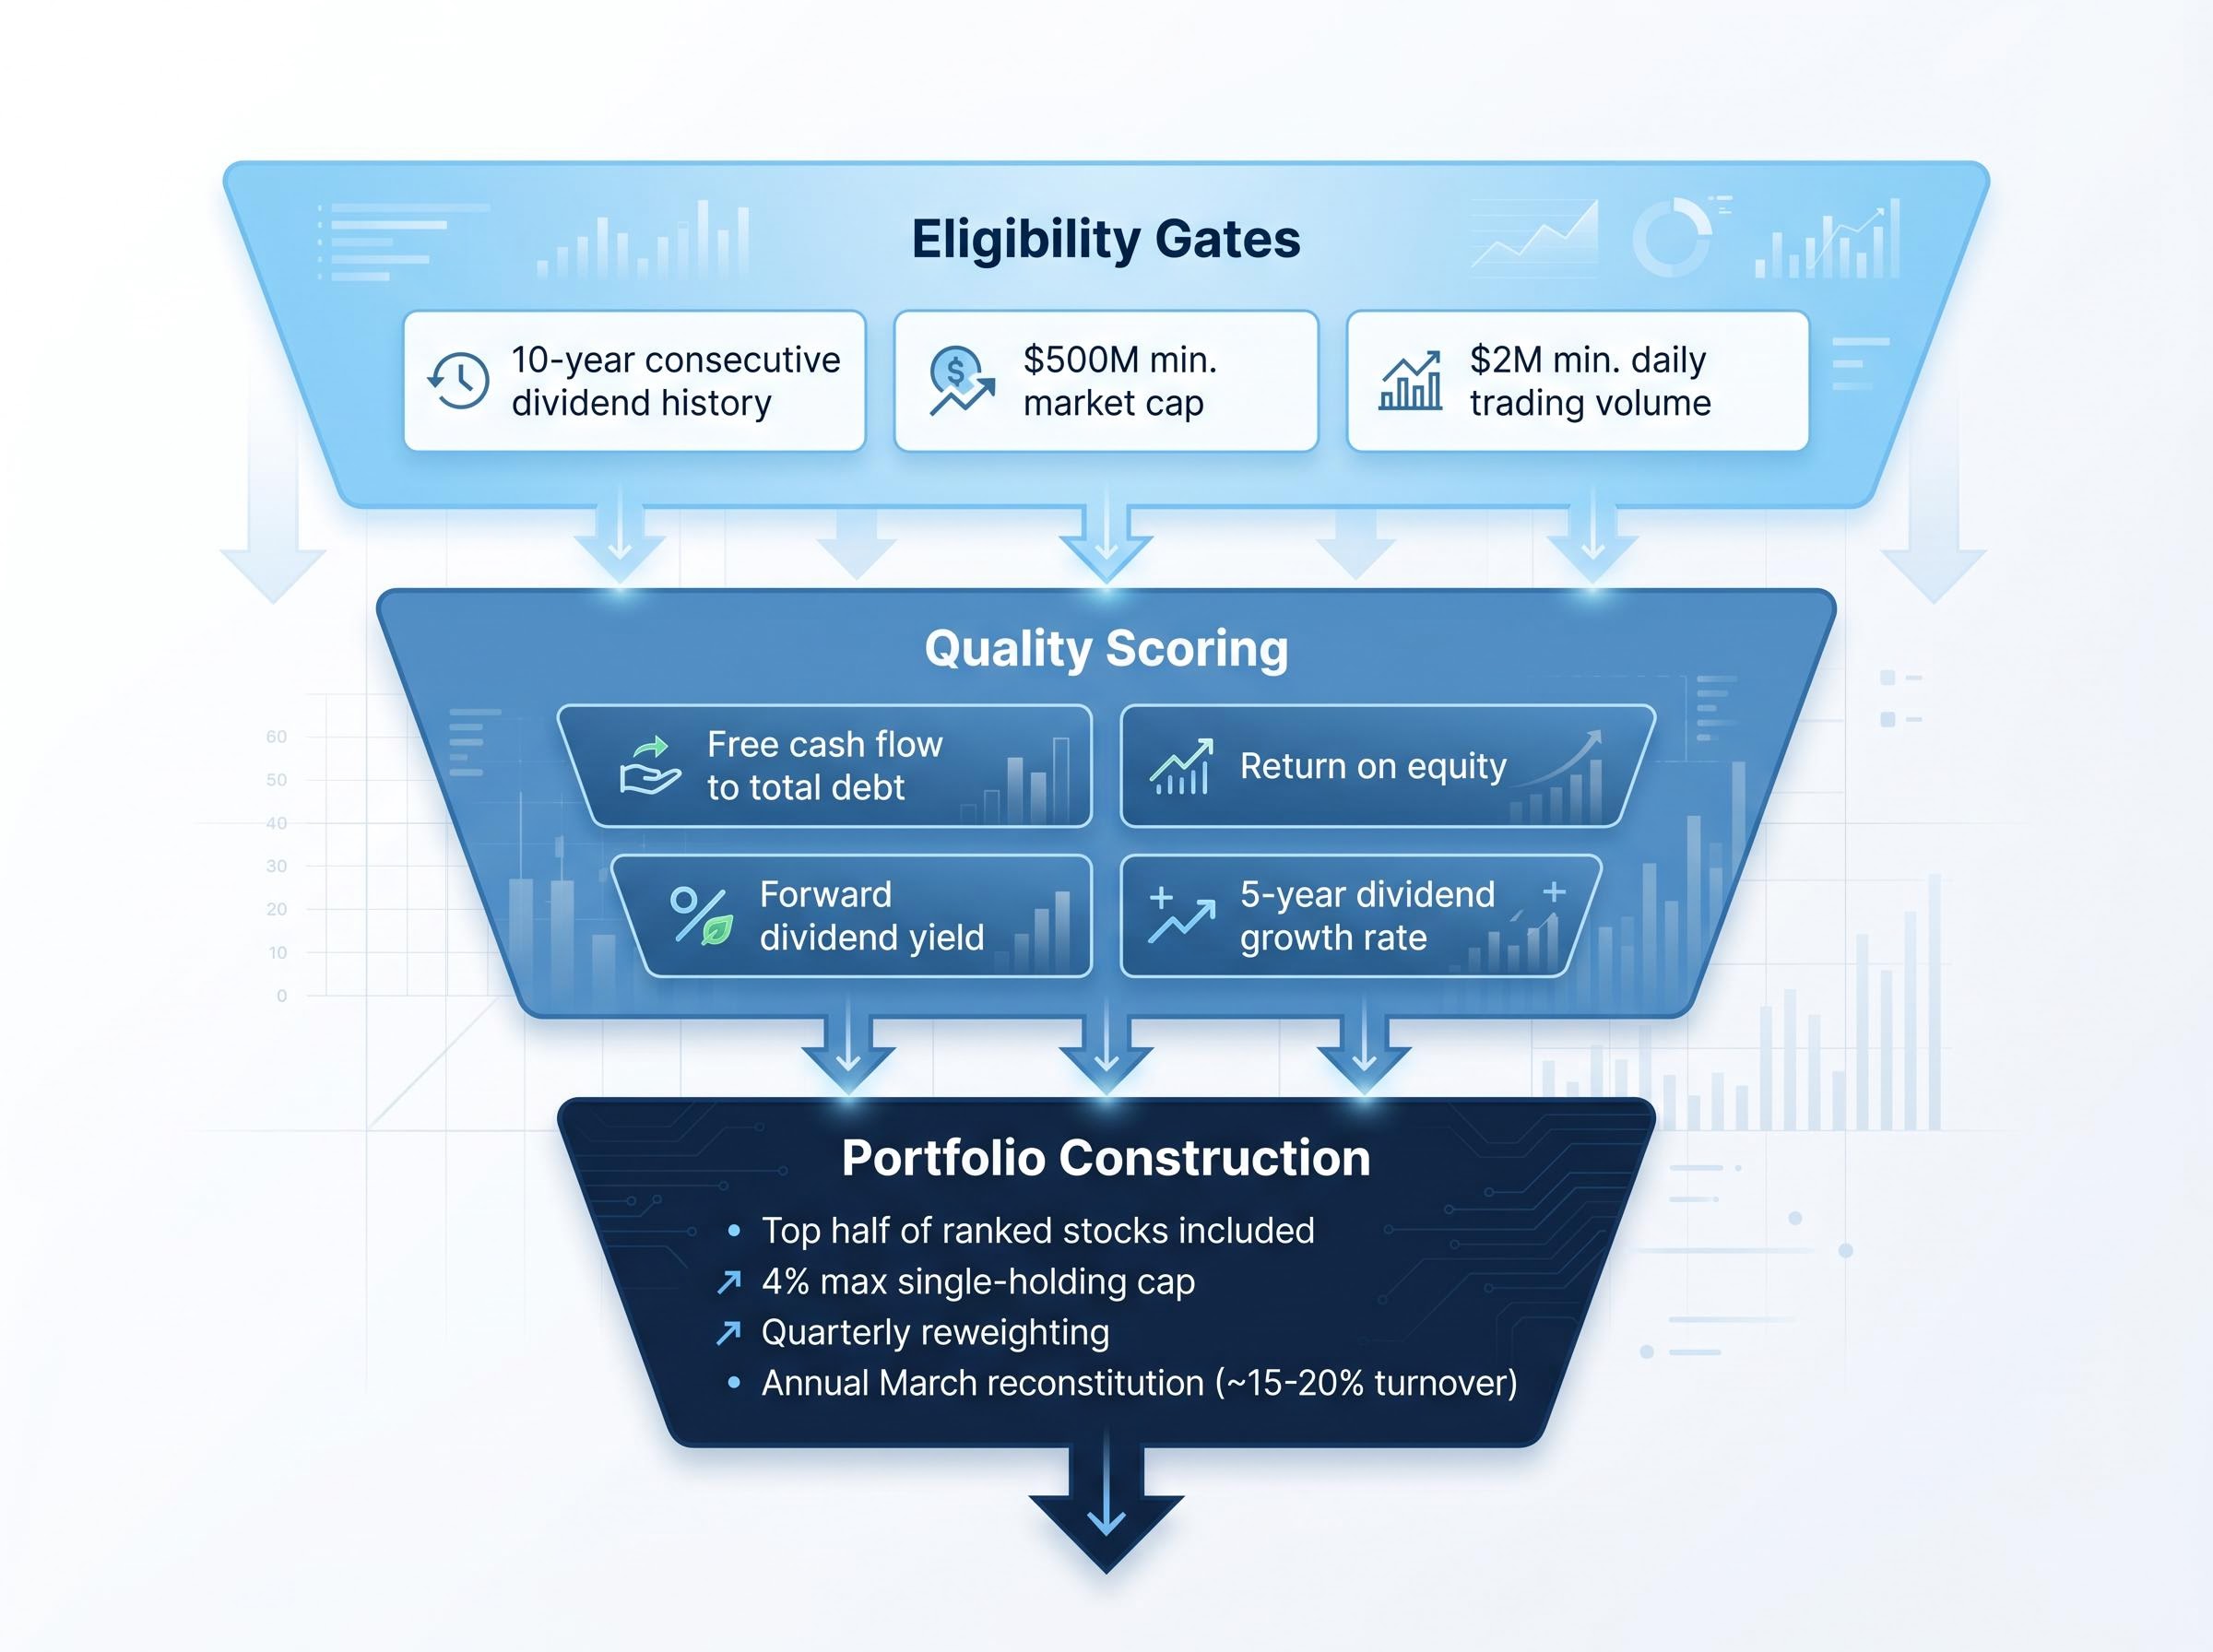
Before a company can even be ranked for inclusion in SCHD’s underlying index, it must pass three eligibility gates:
- A minimum 10-year consecutive dividend payment history
- A market capitalisation of at least $500 million
- Average daily trading volume of no less than $2 million
Only stocks clearing those thresholds enter the quality ranking process. The index then scores eligible companies on four fundamental metrics, each screening for durability rather than just current payout:
- Free cash flow to total debt: measures whether a company generates enough cash to service obligations while still funding dividends
- Return on equity: captures how efficiently management converts shareholder capital into profit
- Forward dividend yield: identifies companies paying meaningfully above average without chasing unsustainable payouts
- Five-year dividend growth rate: rewards companies that have consistently raised distributions, filtering out stagnant payers
The top half of ranked stocks earn inclusion. A 4% maximum single-holding weighting cap prevents concentration, and holdings are reweighted quarterly.
What the annual March reconstitution means for income investors
The annual March reconstitution is the mechanism that keeps SCHD’s quality bar from eroding. Each year, roughly 15-20% of holdings may turn over as the index removes companies whose fundamentals have weakened and replaces them with higher-scoring names.
The March 2025 reconstitution, reported by Morningstar on 8 April 2025, changed approximately 15% of holdings. The rebalance added several large-cap energy and financial names while trimming exposure to technology and consumer staples, a modest sector tilt rather than a wholesale shift. The result was a marginal uptick in portfolio dividend yield, confirming that reconstitution refines the portfolio incrementally rather than dramatically reshaping it.
Daniel Sotiroff of Morningstar concluded that SCHD “remains a compelling core U.S. equity income ETF” following the adjustments. That annual renewal process is a significant reason the fund’s 10-year average dividend growth rate of approximately 10% has been repeatable by construction, not coincidence.
When big ASX news breaks, our subscribers know first
Why SCHD alone cannot reach the 6% income target
The arithmetic is straightforward. SCHD yields between 3.72% (Charles Schwab Asset Management fact sheet, 31 March 2025) and 3.76% (Morningstar, 28 February 2025). On a $1 million base, that produces approximately $37,000 in annual income, leaving a $23,000 shortfall against the $60,000 target.
The capital needed to live off dividends is substantially higher than most investors expect, because generating $60,000 annually at typical portfolio yield levels requires between $1.5 million and $3 million depending on how aggressively the portfolio is constructed, a figure that changes significantly once Social Security or pension income is factored into the income gap.
Closing that gap requires a complement that lifts the weighted average yield to 6%. The blended portfolio math that achieves this allocates approximately 33% to SCHD at roughly 3.7% and approximately 67% to higher-yielding closed-end funds averaging above 7% on their share of the allocation.
| Portfolio Sleeve | Allocation % | Approximate Yield | Annual Income ($1M Base) |
|---|---|---|---|
| SCHD | ~33% | 3.7% | $12,210 |
| CEF Sleeve (ADX, PEO, UTG, BME) | ~67% | ~7.1% | $47,790 |
| Total Portfolio | 100% | ~6.0% | ~$60,000 |
A 6% weighted average yield on a $1 million portfolio produces approximately $60,000 in annual income. The same framework scales proportionally: a $500,000 portfolio at 6% generates roughly $30,000.
The choice of closed-end funds as the yield complement, rather than high-yield bonds or REITs, reflects their structural role as professionally managed equity vehicles with distributed income. That structure introduces its own mechanics, which the next section addresses directly.
What closed-end funds are and why their mechanics matter in a retirement portfolio
A closed-end fund (CEF) differs from an open-end ETF like SCHD in three structural ways that directly affect how it behaves in a portfolio:
- Fixed share count: A CEF issues a set number of shares at launch. Unlike an ETF, it does not create or redeem shares based on investor demand.
- Price divergence from net asset value: Because the share count is fixed, a CEF’s market price can trade above (at a premium) or below (at a discount) its net asset value (NAV), which is the per-share value of the fund’s underlying holdings.
- Leverage availability: Many CEFs borrow capital to amplify investment exposure. This leverage magnifies both returns and losses.
These structural features explain why CEFs can offer distribution rates of 6-8% or more, according to Amy C. Arnott of Morningstar (10 February 2025). They also explain the risks.
Arnott characterises CEFs as a “satellite” position around core low-cost ETFs for retirees seeking higher cash flow, not a dominant portfolio position.
Understanding how distributions are sourced matters just as much as the headline yield. CEF distributions can come from three sources, each with different implications:
FINRA guidance on closed-end fund distributions classifies payouts into four categories: interest income, dividends, capital gains, and return of principal, with return of principal being the category that reduces a fund’s NAV over time even as the distribution amount appears unchanged to the investor.
- Net investment income: dividends and interest earned by the fund’s underlying holdings, the most sustainable source
- Capital gains: profits from selling appreciated securities, dependent on market conditions
- Return of capital: a return of the investor’s own money, which reduces the fund’s NAV over time even though the distribution cheque looks the same
John Rekenthaler of Morningstar (7 April 2025) warned that leveraging CEFs heavily can create sequence-of-returns risk, as discounts widen and distributions may be cut during bear markets. Investors who rely on CEF income in retirement need to distinguish between a fund trading at a discount because it represents a buying opportunity and one discounting because fundamentals are deteriorating.
Exploring high-yield closed-end funds to bridge the income gap
The four CEFs in this framework span broad equity, natural resources, utilities, and health care. That sector diversity is intentional: it prevents the CEF sleeve from concentrating in a single industry while still producing the yield required. Each fund introduces a different risk and return profile.
| Fund | Sector Focus | Distribution Rate | NAV Discount/Premium | Data Date |
|---|---|---|---|---|
| ADX | Broad U.S. equity | 6.0% of NAV | ~15% discount | Jan 2025 |
| PEO | Energy / natural resources | 6.0% of NAV | ~13% discount | Mar 2025 |
| UTG | Utilities / infrastructure | ~7.5% annualised | ~2% discount | Apr 2025 |
| BME | Health care | ~6.2% annualised | ~1% premium | May 2025 |
ADX and PEO, both managed by Adams Funds, share a distribution policy targeting at least 6.0% of NAV annually (Adams Funds 2024 Annual Report, 13 February 2025). Both trade at steep discounts: ADX at approximately 15% below NAV (Barron’s, 27 January 2025) and PEO at roughly 13% below NAV (Barron’s, 3 March 2025). Those discounts boost effective yield for buyers, but they can widen substantially in downturns, compounding price losses. Andrew Bary of Barron’s described PEO as a tactical income enhancer rather than a core retirement holding, citing commodity price volatility and sector cyclicality.
UTG and BME sit on the other end of the discount spectrum. UTG pays $0.19 per share monthly, an annualised yield of approximately 7.5% based on its market price as of 9 April 2025 (Reaves Asset Management). It traded at only a 2% discount to NAV (18 March 2025, Seeking Alpha). Stanford Chemist, writing for Seeking Alpha, recommends pairing it with broader equity income ETFs to avoid over-concentration in utilities.
BME distributes $0.24 per share monthly, equating to approximately 6.2% annualised (BlackRock, 1 May 2025), and traded at about a 1% premium to NAV (2 May 2025, Seeking Alpha). Its covered-call strategy supports the distribution but may limit upside in strong equity rallies. Nick Ackerman of Seeking Alpha frames its health-care focus as defensively oriented, suitable as a complement rather than a complete solution.
All distribution rates and discount figures above are point-in-time snapshots and should not be treated as current live values.
The real risks of targeting a 6% withdrawal-equivalent yield in retirement
Mainstream expert guidance from 2024-2025 is consistent: sustainable withdrawal rates for diversified portfolios over 25-30 year retirements sit in the 3.5-4.5% range. A 6% target sits explicitly above that consensus.
Morningstar’s safe withdrawal rate research for 2026 estimates a 3.9% starting withdrawal rate for a 30-year horizon at a 90% probability of success, placing a 6% yield-equivalent target firmly outside the range associated with high portfolio survival odds over a multi-decade retirement.
According to Morningstar’s John Rekenthaler and Amy C. Arnott (21 October 2024), a “safe” starting withdrawal rate is approximately 3.8% for a 30-year horizon for a balanced portfolio.
Vanguard research by Jonathan Kahler and colleagues (September 2024) reached a similar conclusion: fixed real withdrawal rates above roughly 4% materially increase the risk of depleting assets over a 30-year retirement. BlackRock (April 2025) added that targeting spending rates near 6% typically requires accepting a meaningful probability of principal decline.
Christine Benz of Morningstar (3 February 2025) addressed the yield-only framing directly: a 6% yield-only strategy, taking distributions without selling shares, does not guarantee principal stability. High-income assets tend toward lower expected total returns and higher volatility.
The yield-as-safety narrative intensified in early 2026 precisely when it was least supported by data: the MSCI World High-Dividend Yield Index fell approximately 7.6% peak to trough while the broader MSCI World fell 8.9%, and the broad index recovered to all-time highs by mid-April while high-dividend holdings continued to lag, a sequence that illustrates why sector concentration in rate-sensitive industries creates fragility rather than shelter.
Why the yield-only framing does not eliminate principal risk
The distinction matters because living off distributions sounds like it preserves the original investment. In practice, if distributions include return of capital, each payment reduces the fund’s NAV. The principal base generating income shrinks even when the investor never sells a share.
The 2% annual income growth assumption embedded in the model adds another layer of fragility. That target requires actual portfolio income to grow; if CEF distributions are cut during a downturn, the income growth target fails and real purchasing power erodes.
Five risk categories warrant specific attention for investors considering this framework:
- Sequence-of-returns risk: Leveraged CEFs with wide discounts (ADX at approximately 15%, PEO at approximately 13%) can compound losses in early-retirement downturns, precisely when the damage is most lasting
- Return-of-capital erosion: Distributions sourced from return of capital reduce NAV over time, gradually shrinking the income-generating base
- Leverage amplification: Borrowed capital in CEFs magnifies both gains and losses; rising borrowing costs can squeeze fund income
- Discount widening: CEF market prices can fall faster than their underlying holdings during market stress, as seller pressure compounds with declining NAV
- Inflation above the 2% growth assumption: If inflation persistently exceeds the model’s income growth assumption, real purchasing power declines even if nominal distributions hold steady
Backtested performance of the proposed blended portfolio showed a 12.4% total return inclusive of distributions from 2012 to 2026, with lower maximum drawdowns than the S&P 500. That history is informative but not forward-looking. Past performance does not guarantee future results, and a 14-year backtest that began during a long bull market does not capture all possible retirement sequences.
For investors concerned about the sequence-of-returns risk this framework explicitly flags, our dedicated guide to the retirement bucket strategy explains how to build and size all three buckets, including how to use Bucket 1 liquid holdings to avoid selling equities or CEF positions during a bear market, which is the precise scenario where leveraged funds at steep discounts cause the most lasting portfolio damage.
This article is for informational purposes only and should not be considered financial advice. Investors should conduct their own research and consult with financial professionals before making investment decisions.
What this framework actually buys you and what it cannot promise
The portfolio has genuine structural strengths. SCHD’s quality screen and annual reconstitution create a dividend growth engine that has historically delivered approximately 10% annual income growth, helping offset inflation over time. The four CEFs diversify across broad equity, energy, utilities, and health care, avoiding single-sector dependence. The framework scales to any portfolio size: a $500,000 base at 6% produces approximately $30,000 annually. Backtested total returns of 12.4% inclusive of distributions from 2012 to 2026, with lower drawdowns than the S&P 500, suggest the blend has offered a reasonable risk-return profile over that specific historical period.
What this strategy does well:
- Combines dividend growth (SCHD) with high current income (CEF sleeve) to target a specific annual payout
- Diversifies across multiple sectors and fund structures
- Scales proportionally to any starting portfolio size
- Provides a repeatable allocation framework with annual rebalancing
What it requires from you:
- Annual rebalancing to maintain the 33/67 allocation as market values drift
- Ongoing monitoring of CEF distribution sustainability, NAV trends, and discount dynamics
- Spending flexibility: willingness to reduce withdrawals if distributions are cut during market stress
- Supplemental income sources or cash reserves to buffer a poor sequence-of-returns year
- Acceptance that the 6% target sits above the expert consensus range for sustainable withdrawals over a 30-year retirement
Both Amy C. Arnott and John Rekenthaler of Morningstar position CEFs as satellite holdings, not core allocations, and frame this type of approach as a complement to broader retirement planning rather than a standalone solution. That positioning matters.
Retirement asset allocation frameworks that rely on age-based rules of thumb, such as the widely taught ‘100 minus age’ heuristic, systematically underweight equities for investors now facing 20-30 year retirements, which is one reason researchers including Michael Kitces and Wade Pfau now advocate glide paths that actually increase equity exposure after age 75 rather than continuing to reduce it.
This framework is best suited for finance-educated investors who prioritise income over total return maximisation, who understand that yield and safety are not synonyms, and who have the flexibility to adjust spending when markets do not cooperate. For investors meeting those conditions, the structure offers a clear, replicable path to a 6% yield. For those without spending flexibility or supplemental reserves, the risks described in the preceding section are not disclaimers to skim past. They are the conditions under which the strategy strains.
These statements regarding future performance are speculative and subject to change based on market developments and portfolio-level conditions.