VAS vs VHY: Why the Lower-Yield ETF Wins in Retirement
1 hr ago

A $1 million portfolio tracking the S&P 500, fully invested and paying dividends, generates roughly $11,000 a year before tax. For most Americans picturing financial independence, that number lands like cold water.
Interest in dividend investing has grown steadily through 2025 and into 2026, particularly among younger investors drawn to the idea of passive income replacing a salary. But the concept of living off dividends is rarely paired with the actual arithmetic. The gap between the idea and the maths is large, and for most households, understanding that gap is the most useful thing a piece of writing can do.
What follows walks through the exact formula used to calculate dividend income, applies it at realistic yield levels with concrete income targets, anchors those numbers against median American net worth, and covers the tax and risk considerations that shape real-world outcomes. By the end, readers will know precisely what capital they need, what yield assumptions they are making, and whether the strategy makes sense for their situation.
The formula itself is simple. Two steps handle the entire calculation:
The first version tells an investor what a given portfolio produces. The second, more useful version tells them what they need. Both equations hinge on a single variable: yield.
At the S&P 500’s current yield of approximately 1.10%, a $1 million portfolio produces roughly $11,000 a year in dividends before tax.
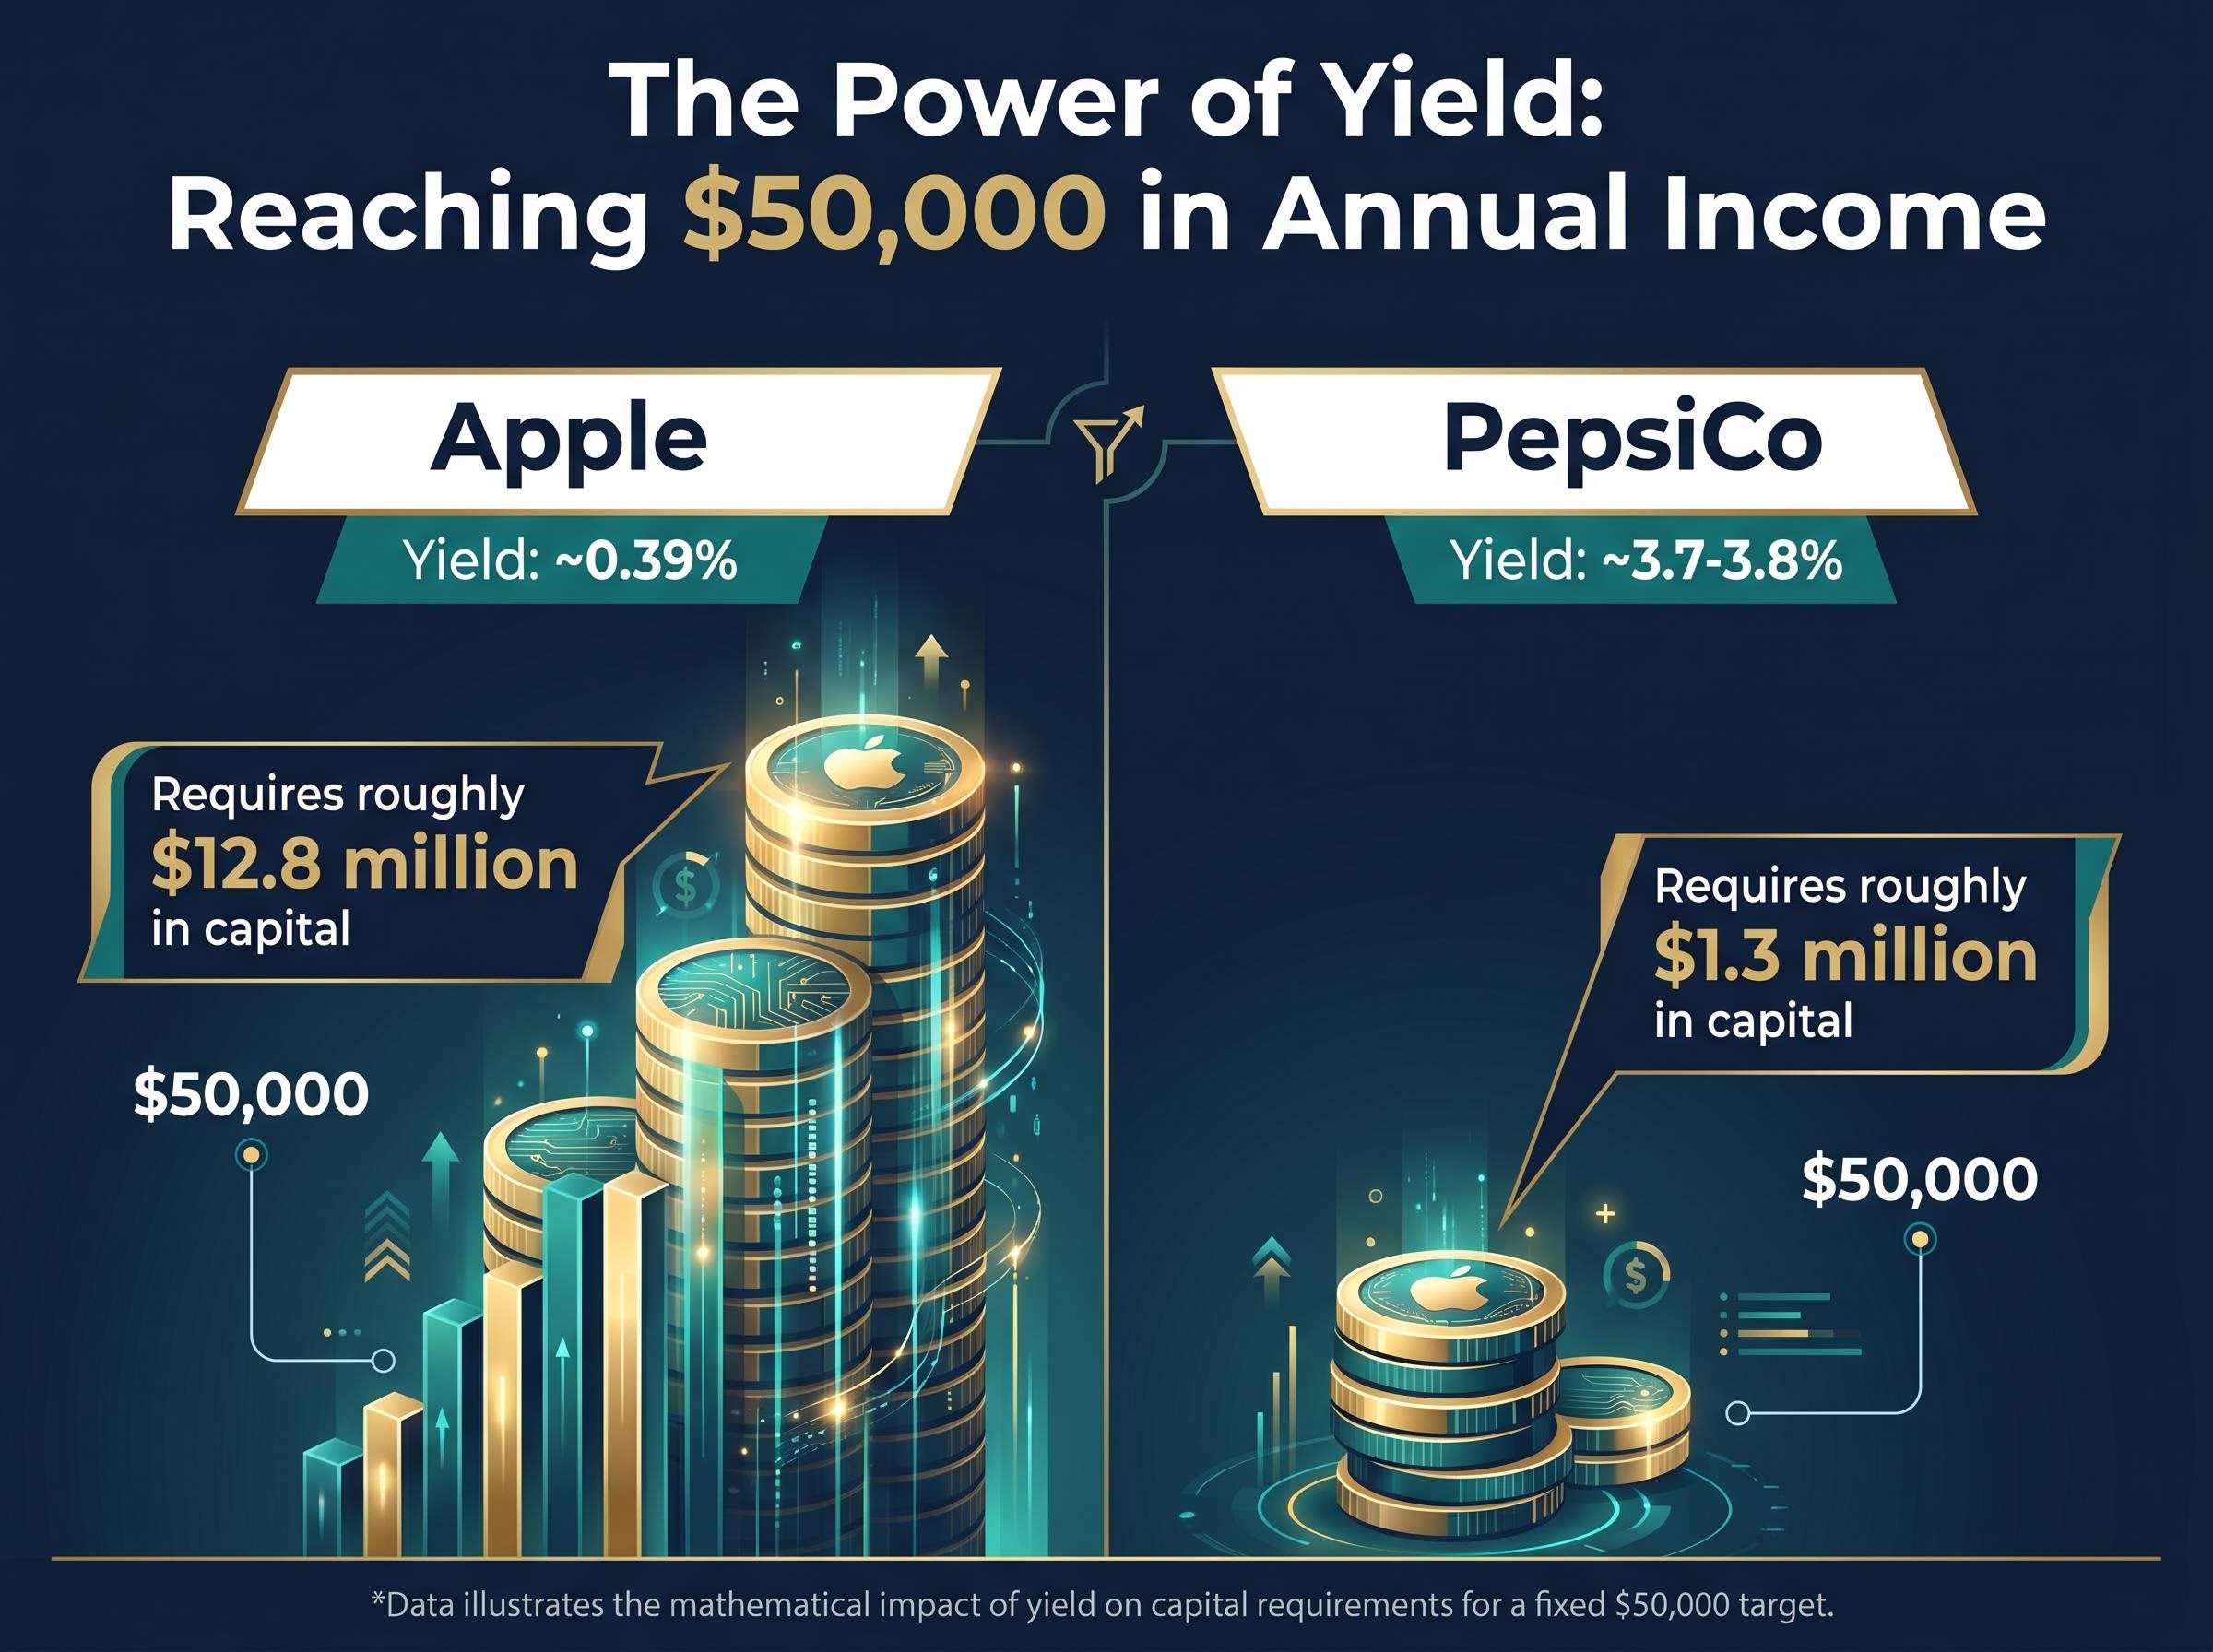
That yield is not fixed. It changes based on which assets sit inside the portfolio, and the difference between a low-yield and high-yield selection is not marginal. It is the difference between needing $5 million and needing $1.3 million.
Consider a $50,000 income target. At Apple’s current yield of approximately 0.39%, each $100 invested generates just $0.39 annually, and reaching $50,000 would require roughly $12.8 million in capital. At PepsiCo’s yield of approximately 3.7-3.8%, the same income target requires roughly $1.3 million.
The difference is nearly tenfold, driven entirely by one number.
Most real-world dividend portfolios cluster in the 2.5-3.5% range once properly diversified. That range narrows the extremes but still leaves the capital requirement substantial. At 3%, reaching $50,000 demands approximately $1.67 million. Yield is not a detail; it is the variable that determines whether the strategy is plausible or out of reach.
Every capital requirement figure in this article is stated before tax. What investors actually keep depends on how their dividends are classified.
Qualified dividends, which apply to shares held for approximately 60 days or longer (a threshold most buy-and-hold investors meet automatically), are taxed at preferential rates: 0% on taxable income up to $49,450, 15% from $49,451 to $545,500, and 20% above that. Nonqualified dividends are taxed at ordinary income rates, which reach as high as 37% at the federal level.
The 0% threshold creates a notable planning opportunity. An investor with a $1 million dividend portfolio yielding 5% and no other earned income could potentially owe zero federal tax on that $50,000 in qualified dividend income after the standard deduction.
An investor with $1 million in dividend stocks at a 5% yield and no other earned income could potentially owe zero federal tax on that $50,000, after the standard deduction.
For investors with tax-advantaged accounts, a Roth IRA eliminates the tax drag entirely; dividends earned within a Roth IRA are never taxed, making it the single most efficient vehicle for dividend income in retirement.
The current rate environment also presents alternatives that compete with dividend stocks on pure income generation:
| Income Vehicle | Approximate Yield | Risk Category |
|---|---|---|
| S&P 500 Index Fund | 1.10% | Equity risk |
| SCHD | 3.29% | Equity risk |
| VYM | 2.24% | Equity risk |
| 10-Year Treasury | 4.42% | Interest rate risk; no equity risk |
| High-Yield Savings Account | Up to 5.00% | Minimal (FDIC insured) |
SCHD at 3.29% currently yields less than the 10-year Treasury at 4.42%. High-yield savings accounts offering up to 5.00% APY (such as Varo Bank as of May 2026) exceed the yield of every dividend ETF listed above, with no equity risk. Dividend stocks offer potential capital appreciation that fixed-income vehicles do not, but for investors whose sole priority is income, the comparison is worth acknowledging.
Three income targets frame the arithmetic: $30,000 (a minimal baseline), $60,000 (which approximates median U.S. household expenditure and serves as a practical reference point), and $100,000 (a comfortable urban lifestyle). Three yield assumptions, 2%, 3%, and 4%, bracket the range most diversified dividend portfolios fall within.
| Target Annual Income | At 2% Yield | At 3% Yield | At 4% Yield |
|---|---|---|---|
| $30,000 | $1.5 million | $1 million | $750,000 |
| $60,000 | $3 million | $2 million | $1.5 million |
| $100,000 | $5 million | $3.33 million | $2.5 million |
The pattern is clear. Even at an aggressive 4% yield, generating $60,000 requires $1.5 million in invested capital. At the S&P 500’s current yield of 1.10%, that same income target demands approximately $5.45 million.
At the S&P 500’s current yield, reaching $60,000 in annual dividend income would require a portfolio of roughly $5.45 million.
A practical shorthand: multiplying the desired annual income by 22-28x approximates the required portfolio size. That range implies a yield assumption of roughly 3.5-4.5%, which is achievable with high-dividend ETFs such as SCHD (yielding 3.29% as of May 2026) or concentrated individual stock selections, but not with broad index exposure. The multiplier is useful for quick estimation; the table above is useful for precision.
The Dividend Aristocrats, a group of S&P 500 companies that have raised their dividends for 25 or more consecutive years, represent the highest-profile quality filter in dividend investing. As of 2026, 69 companies carry the designation. Their yields generally range from 1% to 4%, and the long track record of annual increases signals financial discipline and stable cash flow.
That signal is real, but it is not a guarantee.
3M raised its dividend for 66 consecutive years before cutting it in 2024. At the time, 3M was frequently cited as a high-yield example with a yield exceeding 4%. Walgreens cut after more than 40 consecutive years of annual increases. AT&T reduced its dividend by 46% in 2022. Each of these companies appeared on lists of reliable income payers before the cut arrived.
The dividend discount model formalises the intuition behind yield-focused investing by treating a stock’s value as the sum of its future dividend payments discounted to the present, a framework that makes explicit what every income investor is implicitly assuming when they accept a 3% yield on a stock rather than a 4.42% risk-free Treasury.
Diversification is the primary defence. Effective dividend portfolio construction typically requires 20 or more individual stocks, with no single position exceeding 5% of the portfolio, to mitigate the impact of any single dividend cut.
A dividend trap occurs when an elevated yield reflects a falling share price rather than generous income. The yield rises because the denominator (the stock price) is shrinking, not because the company is paying more. Three warning signs distinguish a trap from a genuine high-yield opportunity:
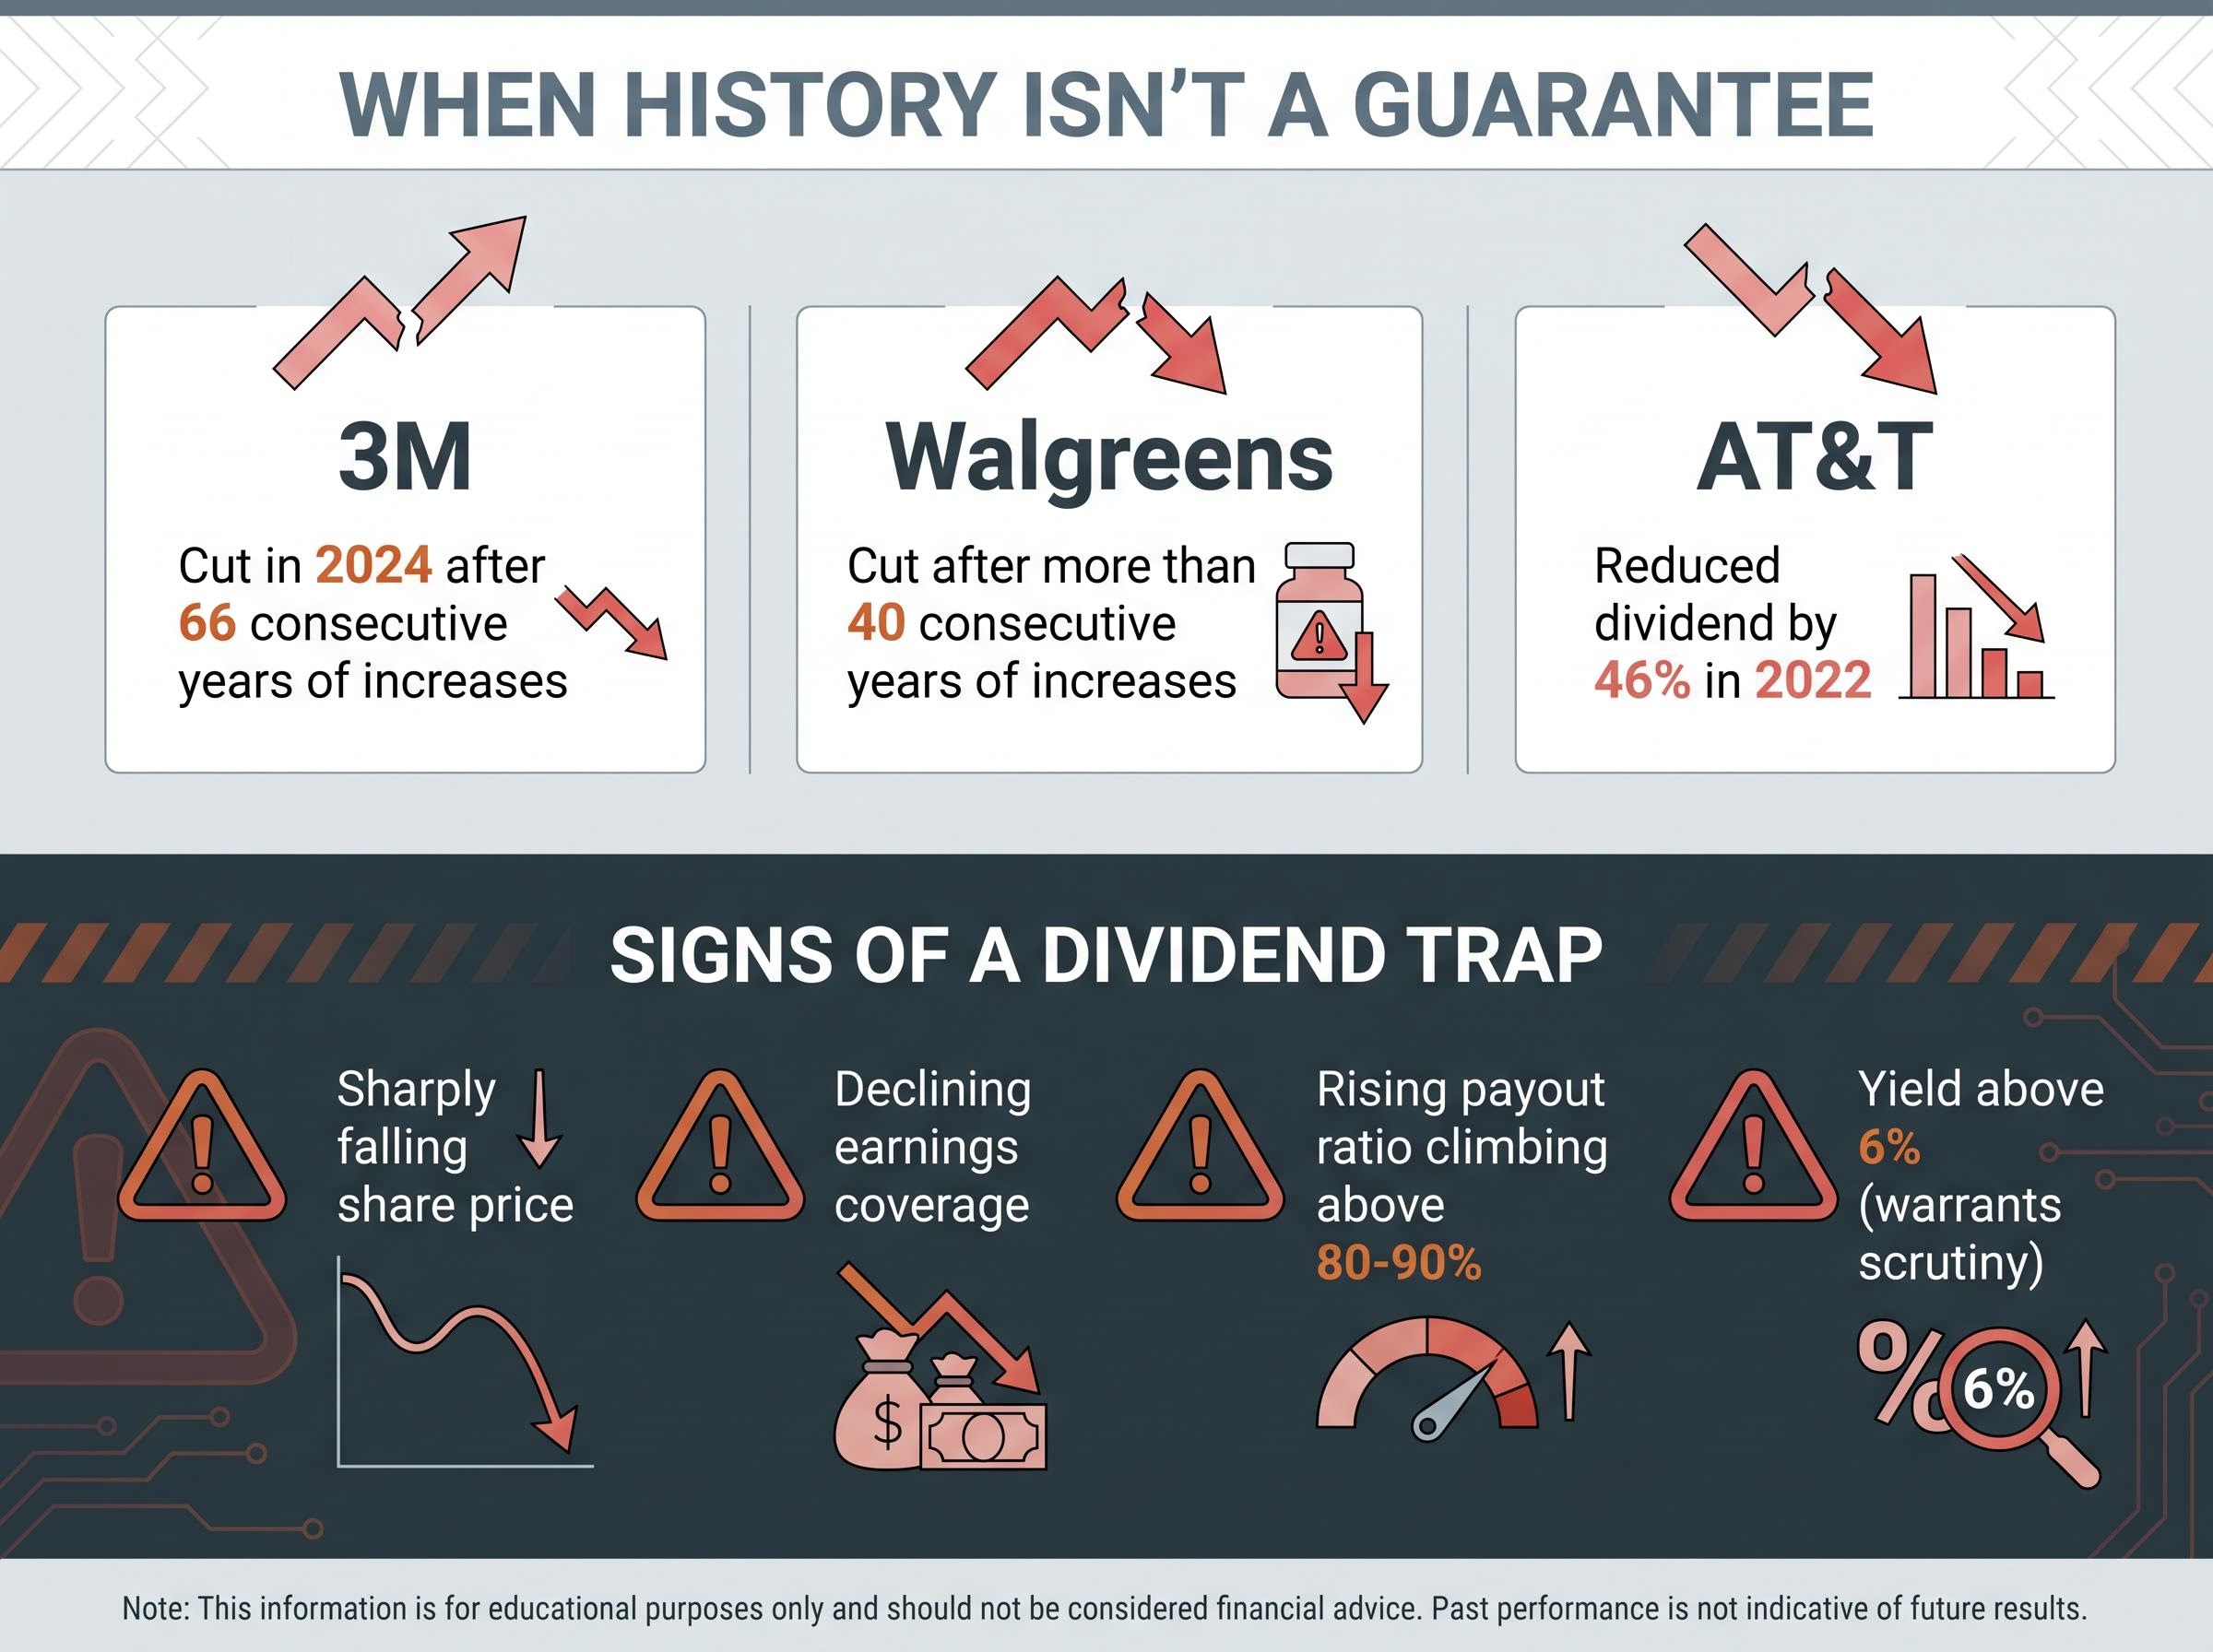
A yield above 6% on a broad-market stock in a low-yield environment warrants closer scrutiny, not automatic enthusiasm. The yield itself is the warning.
The most recent Federal Reserve Survey of Consumer Finances, published using 2022 data, places median U.S. household net worth at approximately $193,000. The next SCF release is expected in late 2026 or early 2027. Adjusted for inflation to the present, that figure rises to approximately $217,000.
The Federal Reserve Survey of Consumer Finances, the definitive government source for U.S. household wealth data, places median net worth at approximately $193,000 using 2022 figures, with the next release expected in late 2026 or early 2027.
That number, however, overstates what is available for dividend investing. Net worth includes:
The investable liquid capital available to direct toward a dividend portfolio is a fraction of total net worth for the typical household.
Even investing the full inflation-adjusted median net worth at an aggressive 5% yield produces less than $11,000 a year in dividends.
At $217,000 and a 5% yield, the resulting $10,850 annually does not approach any reasonable threshold for covering living expenses. The gap between the $1.5-2 million portfolios required for meaningful dividend income and the $193,000-$217,000 median net worth is roughly 8-10x. The maths does not require editorial commentary. The numbers make the scale of the challenge visible on their own.
The capital gap is real. It does not, however, make dividend investing irrelevant. It makes it a question of staging, supplementation, and realistic expectations.
| Life Stage | Suggested Dividend Allocation | Rationale |
|---|---|---|
| Under 35 | 0% | Growth compounding is the priority; reinvested gains outperform income over long horizons |
| Late 30s | 5-10% | Begin introducing dividend positions via ETFs such as SCHD or VYM as a foundation |
| 40s | 15-30% | Increase allocation as retirement approaches; balance growth with income generation |
| 50s | 30-50% | Shift toward income production as Social Security and pension timelines become visible |
These brackets are starting points, not prescriptions. Growth should remain the portfolio core throughout for most investors.
Social Security and pensions are the most practical offsets to the capital requirement gap. If Social Security covers $24,000 annually, the required dividend portfolio for a $60,000 lifestyle drops from $2 million to approximately $900,000 at a 4% yield. That reduction transforms the strategy from implausible to achievable for a larger share of households.
The total-return tradeoff deserves attention. A 2016-2025 backtest comparing a dividend-focused portfolio to the total market shows the dividend portfolio returning 9.43% annualised versus 10.49% for the total market, a gap of approximately 1.06 percentage points per year. That gap is not an argument against dividends; it is an argument for using them deliberately rather than exclusively.
The total-return gap between dividend portfolios and the broader market, approximately 1.06 percentage points per year in the 2016-2025 backtest cited here, is one reason most financial planners position dividend income as one component within a broader set of long-term investing strategies rather than a standalone wealth-building engine.
Morningstar’s analysis of dividend versus total market returns over a 15-year horizon shows dividend-focused funds trailing the broad market by roughly 1-2 percentage points annually, a finding that reinforces the case for treating dividend investing as a complement to a total-return strategy rather than a standalone approach.
Three steps frame the practical calculation:
Living off dividends entirely requires $1.5-2 million or more for most income targets, a threshold far above the median American household’s net worth of approximately $193,000. The arithmetic is unambiguous on this point.
The strategy’s genuine value lies elsewhere. Dividend investing is a powerful accumulation and income-supplement tool, particularly when combined with Social Security, pensions, and tax-advantaged accounts such as Roth IRAs. It works best as a complement to income, not a replacement for it.
One step is available today: take a target annual income, subtract any expected Social Security or pension income, and divide the remainder by a realistic yield (between 2.5% and 4%). The resulting number is the capital target. The gap between that number and current investable assets is the honest measure of the timeline ahead.
This article is for informational purposes only and should not be considered financial advice. Investors should conduct their own research and consult with financial professionals before making investment decisions. Past performance does not guarantee future results. Financial projections are subject to market conditions and various risk factors.
The amount depends on your target income and the yield of your portfolio. At a 3% yield, generating $60,000 annually requires roughly $2 million in invested capital, while a 4% yield lowers that requirement to $1.5 million.
The formula has two steps: Annual Dividend Income equals Portfolio Value multiplied by Dividend Yield, and Required Capital equals Target Income divided by Dividend Yield. These two equations let investors calculate either what a portfolio produces or what capital is needed to hit a specific income goal.
Qualified dividends, which apply to shares held for approximately 60 days or longer, are taxed at preferential rates of 0%, 15%, or 20% depending on taxable income, while nonqualified dividends are taxed at ordinary income rates that can reach as high as 37% federally.
A dividend trap occurs when a stock's yield appears high because its share price has fallen sharply, not because the company is paying more income. Investors can spot traps by watching for declining earnings coverage, a payout ratio climbing above 80-90%, and a falling share price driving the yield higher.
For most households, living off dividends entirely is a long-term goal rather than an immediate option. The median U.S. household net worth is approximately $193,000, while generating even $30,000 annually at a 4% yield requires $750,000 in invested capital, a gap of roughly 3-4 times the median figure before accounting for illiquid assets like home equity.