
Most investors think the path to better returns runs through better stock picks. Ray Dalio spent the first decade of his career believing that too, until a single catastrophic bet destroyed his firm, his staff, his savings, and his confidence in the entire approach.
The insight that rebuilt his career was not about finding superior assets. It was about engineering independence between the assets he already held. Dalio’s analysis demonstrated that building a portfolio of 15-20 truly uncorrelated return streams had the potential to cut portfolio volatility by around 80% while leaving expected returns largely intact. That is not a rounding error. It is the difference between a portfolio that compounds steadily and one that swings violently enough to force bad decisions.
Here is what this principle actually means, why the mathematics behind it work, and how you translate it into practical portfolio decisions at any scale, whether you manage $5,000 or $5 million.
The painful origin of a powerful idea
Bridgewater Associates was founded in 1975. By the early 1980s, Ray Dalio had become publicly vocal about a conviction that emerging market nations were accumulating unsustainable debt loads. When Mexico defaulted in August 1982, it looked like vindication. Dalio testified before Congress. The call appeared prescient.
Then the broader economy moved in the opposite direction to everything else he had predicted. His macro bets proved catastrophically wrong, costing both himself and his clients real money.
The fallout was total. Dalio dismissed every employee at Bridgewater and borrowed $4,000 from his father to keep his household afloat. The experience did not harden his conviction. It shattered it and forced him to rebuild on fundamentally different ground.
What emerged from that collapse was not a better directional bet. It was a rejection of directional concentration altogether. Dalio redirected his entire approach toward assembling systematic, uncorrelated return streams, a framework designed to survive being wrong about any single position. The humiliation of 1982 is what makes the concept legible: he was not theorising about diversification from an armchair. He was solving the specific problem of what happens when a highly confident, concentrated portfolio turns out to be simply wrong.
Dalio’s mantra: “15 good uncorrelated return streams, risk balanced.”
When big ASX news breaks, our subscribers know first
What “uncorrelated” actually means (and why most portfolios miss it)
The instinct most investors carry into diversification is straightforward: own more things. Spread your money across enough names, and risk goes down. That instinct is not wrong in spirit, but it misses the mechanism entirely.
Owning 40 stocks in the same sector, or 20 growth names that all respond to the same interest rate environment, is not diversification. It is a single concentrated bet wearing multiple tickers. The assets move together during calm markets because they share the same underlying economic drivers, and they move together more violently during stress events, which is precisely when you need them not to.
Hidden concentration risk is particularly common in ETF-based portfolios, where the top 10 stocks in a broad index can account for close to half the fund’s total weight, meaning investors who hold several funds believing they are diversified may in practice own a single concentrated bet on a small cluster of names.
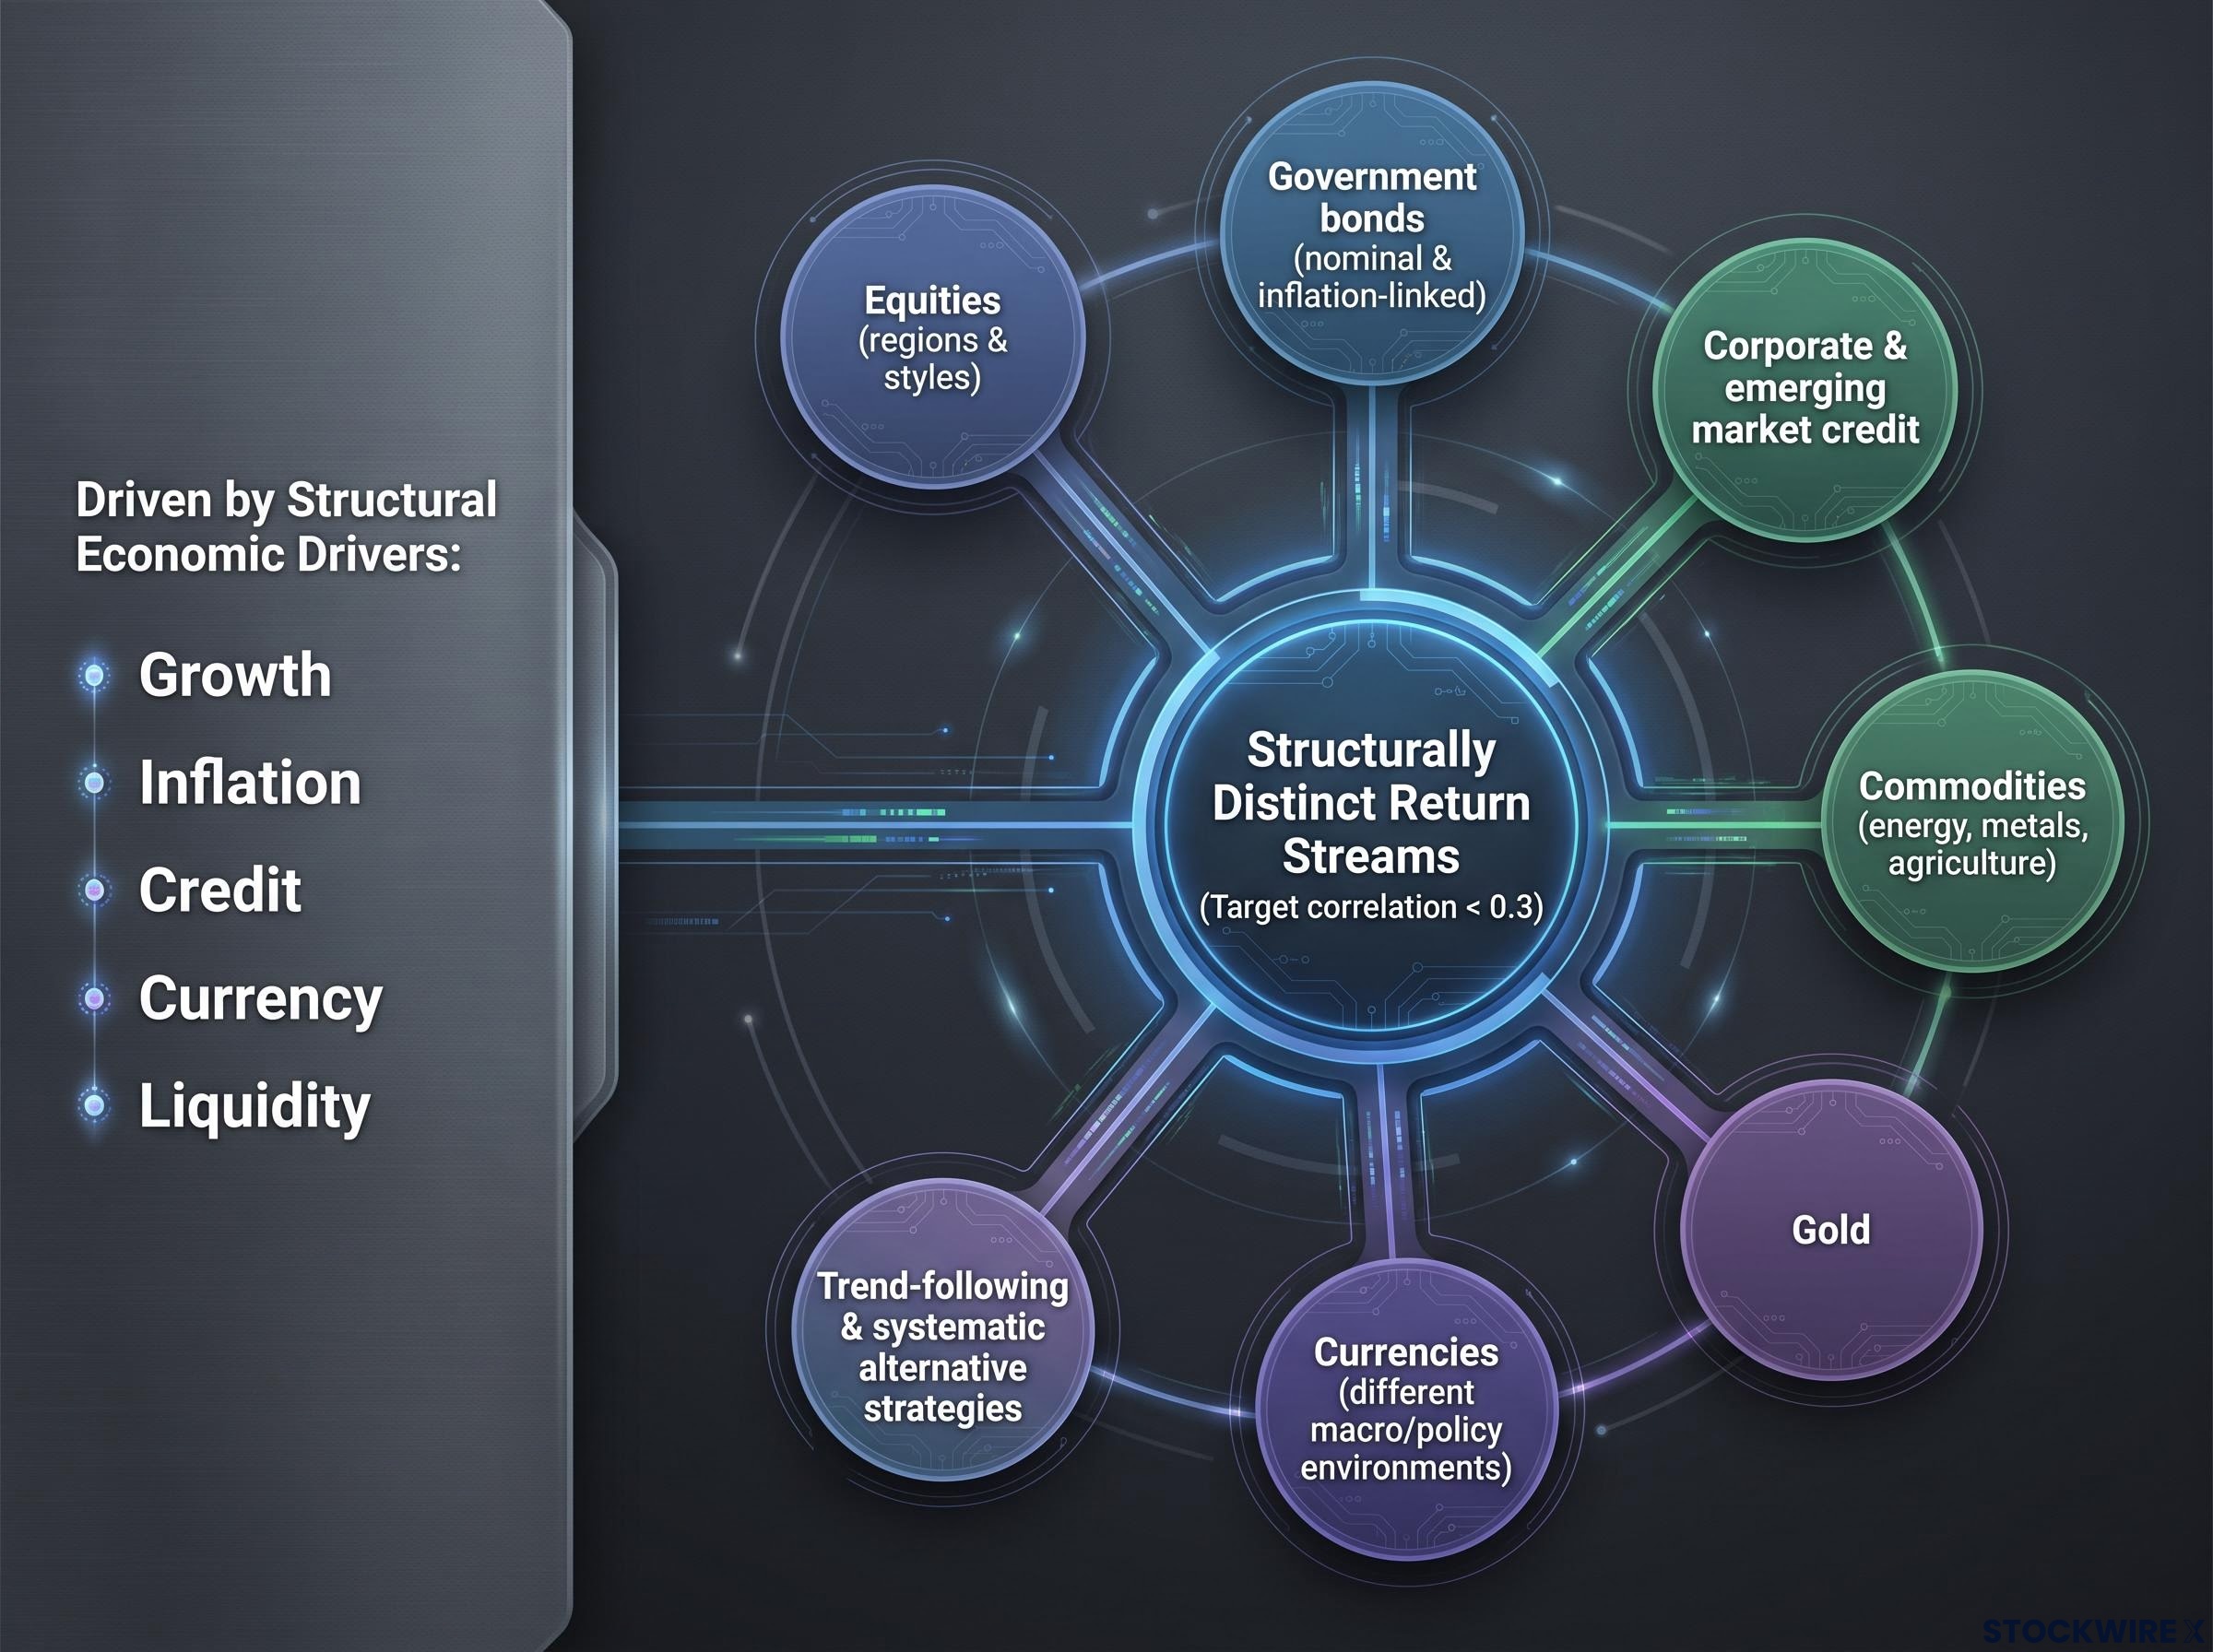
Dalio’s framework requires each return stream to satisfy two conditions: a positive expected return, and low correlation with every other stream in the portfolio. The target correlation threshold is below approximately 0.3, with lower being better and negative correlations being particularly valuable. The correct lens for assessing true independence is not recent price history but structural economic drivers: growth, inflation, credit, currency, and liquidity. Structural differences tend to be far more durable than statistical correlation estimates derived from a few years of calm-market data.
Examples of structurally distinct return streams include:
- Equities across different regions and investment styles
- Government bonds of varying maturities (nominal and inflation-linked)
- Corporate and emerging market credit
- Commodities (energy, metals, agriculture)
- Gold
- Currencies reflecting different macro and policy environments
- Trend-following and systematic alternative strategies
For you as a retail investor, this means auditing your portfolio not by counting positions but by asking how many genuinely different economic stories your holdings are telling. A portfolio of 40 tech stocks is, by this definition, a single bet.
Why normal-market correlations can deceive you
Statistical correlations are calculated from historical price data, and that data overwhelmingly reflects calm-market conditions. Most trading days are ordinary. The problem is that during genuine stress events, correlations across seemingly different assets can converge sharply, compressing the diversification benefit at the exact moment you need it most.
This is not a reason to abandon the framework. It is the reason that structural economic driver analysis matters more than backward-looking correlation statistics. Two assets driven by fundamentally different forces (say, agricultural commodities and government bonds) are more likely to maintain their independence under stress than two assets that simply happened to show low correlation during recent bull markets.
The mathematics of the 80% risk reduction
The logic starts with a simple observation. If you hold a single asset with 15% annual volatility, your portfolio volatility is 15%. Add a second, completely uncorrelated asset, and your portfolio volatility drops, not by half, but meaningfully. Add a third. A fourth. Each additional uncorrelated stream reduces portfolio volatility further, but each new addition contributes less marginal benefit than the one before it.
Modern Portfolio Theory, formalised by Harry Markowitz, provides the mathematical foundation underlying this logic: combining assets whose returns move independently reduces the portfolio’s aggregate volatility without requiring you to sacrifice expected return from any individual position.
The simplified formula captures this: for n uncorrelated assets each with volatility σ, portfolio volatility is approximately σ / √n. In plain language, you divide the individual risk by the square root of the number of streams. With 15 positions at 15% individual volatility and near-zero correlation, portfolio volatility falls to approximately 3.9%, a reduction of roughly 75-80%.
The key finding: 15 uncorrelated streams, each with 15% individual volatility, produce a portfolio volatility of approximately 3.9%.
The expected return stays roughly the same, because you are not diluting your return sources; you are just neutralising their individual risks against each other. The result is that the Sharpe ratio (the ratio of return to risk, which measures how efficiently your portfolio converts risk into reward) improves by a factor of approximately √15 ≈ 3.87. Dalio rounds this to “five times” in his public discussions. The gap between 3.87 and 5 reflects heuristic rounding, not a contradiction.
The diminishing returns pattern is the reason Dalio specifies 15-20 streams, not 50 or 500. Beyond 20, each additional stream adds negligible further benefit relative to the complexity it introduces.
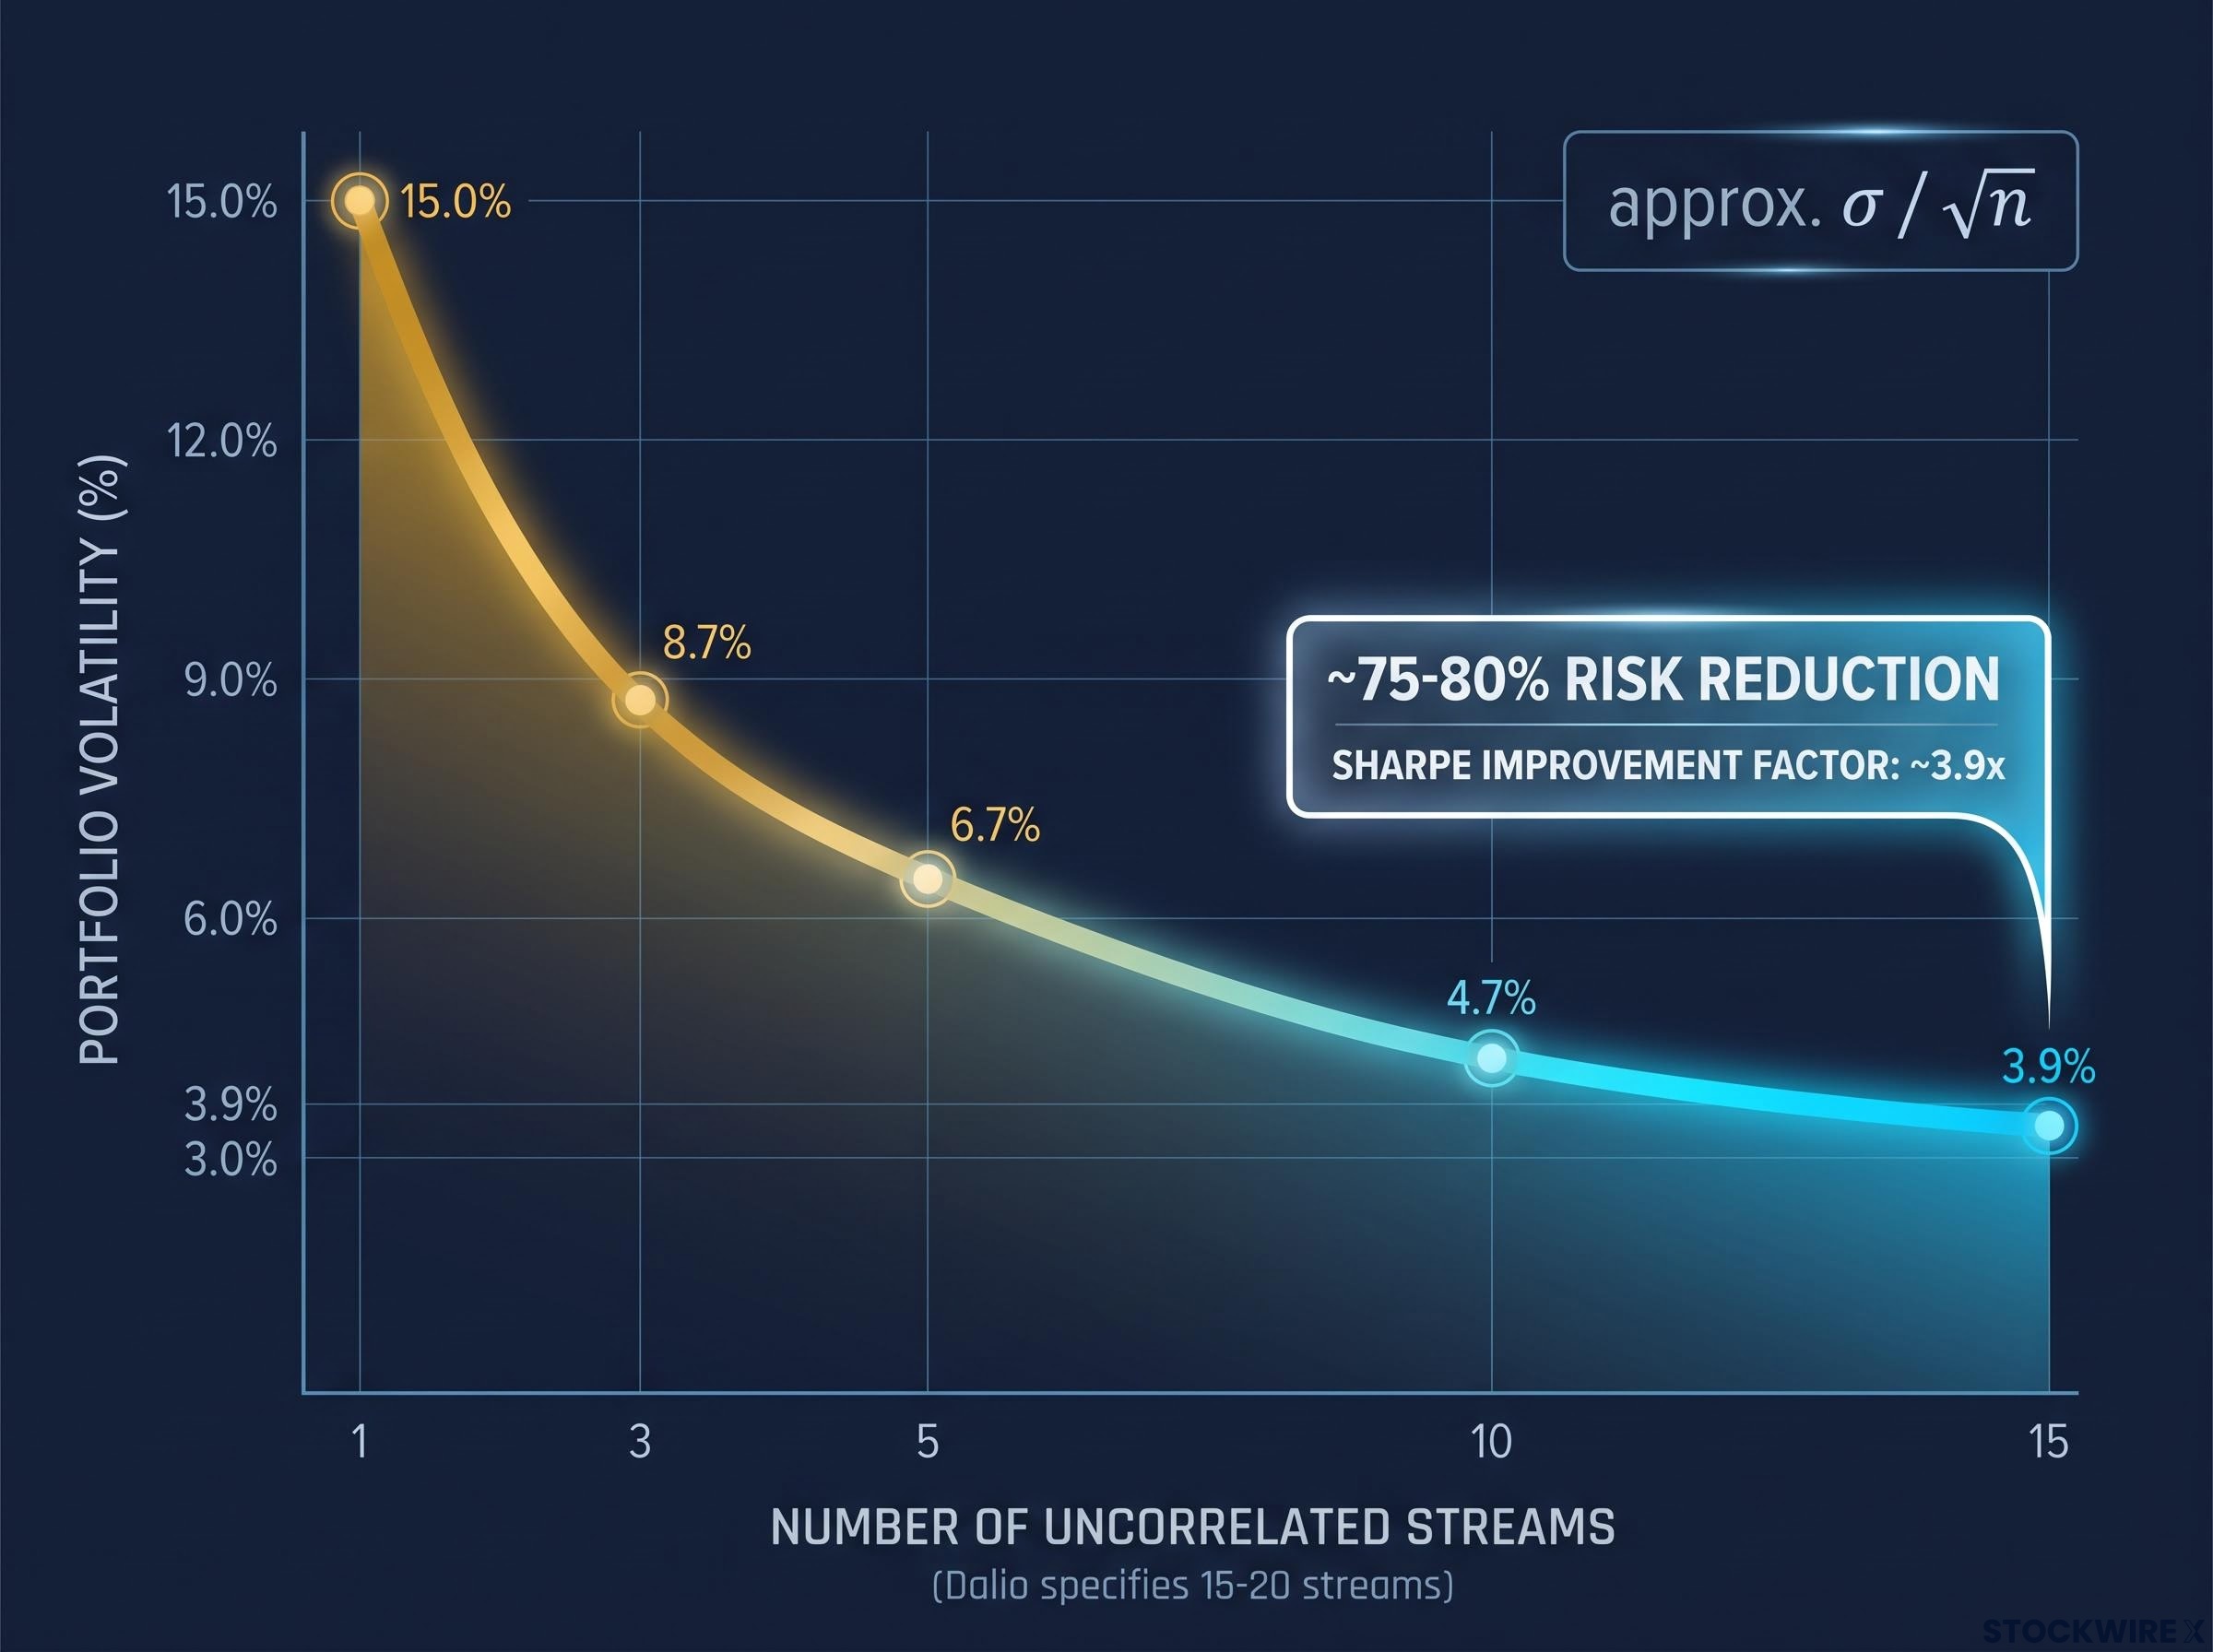
| Number of streams | Individual volatility | Approx. portfolio volatility | Risk reduction vs single stream | Sharpe improvement factor |
|---|---|---|---|---|
| 1 | 15% | 15.0% | 0% | 1.0× |
| 3 | 15% | 8.7% | ~42% | ~1.7× |
| 5 | 15% | 6.7% | ~55% | ~2.2× |
| 10 | 15% | 4.7% | ~69% | ~3.2× |
| 15 | 15% | 3.9% | ~75-80% | ~3.9× |
The Sharpe ratio improvement of roughly 4-5 times is the quantitative case for why this principle matters. It means a portfolio built on 15 uncorrelated streams can deliver the same expected return as a concentrated bet while carrying only a fraction of the risk. That is the closest thing to a free lunch that systematic portfolio construction offers.
How to apply the principle without a hedge fund’s resources
You cannot replicate Bridgewater’s infrastructure. You do not have a team of systematic researchers, decades of back-tested decision rules, or access to institutional-grade alternative strategies. But the core logic of assembling uncorrelated streams is scale-independent. What changes is the toolkit, not the principle.
The practical translation follows directly from the framework:
- Map your current holdings to economic drivers. Go beyond ticker names. Ask what forces actually move each position. If your equities, your managed fund, and your superannuation or retirement account all respond primarily to the same growth and interest rate environment, you own fewer independent bets than you think.
- Identify concentration. A single dominant position, such as heavy allocation to one country’s equity market, will overwhelm any diversification benefit regardless of what else you hold. If one stream contributes most of your portfolio’s volatility, the other streams are decorative.
- Add structurally different streams via ETFs or funds. Combine equities across regions and styles with bonds of varying maturities, commodities, gold, and where accessible, systematic alternative strategies. The aim is low correlation between streams, not sheer quantity.
- Risk-balance across streams. Equalise each stream’s contribution to portfolio volatility, not just its dollar allocation. A small allocation to a highly volatile asset and a large allocation to a stable one can contribute similar risk.
- Avoid excessive cash drag. Dalio views cash as the asset that most reliably underperforms over long time horizons. It lowers expected return without adding an independent return engine. Holding cash is not the same as holding a diversifying position.
The practical mechanics of risk-balancing your positions go deeper than the principle alone: beta-weighted sizing converts each holding into market-risk equivalent dollars, revealing that a 50/50 dollar split between a high-beta technology ETF and a low-beta utilities fund can produce a 90/10 risk split that is invisible on a standard brokerage statement.
The key operational question: “Does this holding respond to different economic conditions than what I already own?”
Dalio’s view is that investors should hold somewhere in the range of 5-15% of their portfolio in gold, sized according to their overall portfolio construction, with the possibility of tilting that allocation higher on a tactical basis. He has identified periods of debt crisis and aggressive government monetary expansion as particularly suitable windows for that kind of overweighting. Reports suggesting his family office held 70-75% of assets in gold ETFs were explicitly denied by Dalio as inaccurate.
Your portfolio will use approximate uncorrelation, not mathematical perfection. That is fine. The goal is many reasonably independent bets, and approximate independence still delivers most of the benefit.
The limits of the framework: what the Holy Grail does not promise
The 80% risk reduction figure holds under specific conditions: near-zero correlations and similar volatilities across all streams. In practice, those conditions are idealised. When correlations sit at 0.2-0.3, the risk reduction is smaller but still meaningful. When correlations spike during genuine stress events, the diversification benefit compresses at precisely the moment you need it most.
This crisis correlation convergence is the most important practical limitation of the framework. It does not invalidate the principle, but it means your real-world portfolio will not match the idealised mathematics during the worst periods.
The stock-bond correlation assumption that underpinned four decades of conventional portfolio construction broke down visibly in 2022, when both equities and bonds fell simultaneously during an inflationary shock, illustrating exactly the kind of crisis-period correlation convergence that Dalio’s framework is designed to anticipate.
The Holy Grail reduces volatility and drawdown risk substantially. It does not eliminate the possibility of loss, prolonged underperformance in individual streams, or the catastrophic impact of bubble deflations on concentrated positions. During a bubble collapse, even the strongest and most successful businesses can see their share prices fall by 80% or worse.
Key conditions and limitations to keep in mind:
- The idealised result assumes near-zero correlations; real portfolios typically run higher
- Crisis events can sharply increase correlations across asset classes
- No strategy guarantees positive returns or eliminates loss
- Individual streams within a well-constructed portfolio will still have losing periods
Bridgewater’s own record across Dalio’s roughly 31-year management tenure offers a useful reference point: the fund recorded a loss in only around 3 calendar years, and the steepest of those drawdowns reached approximately 13%, which occurred during the COVID period. The remaining down years saw losses of no more than roughly 2%.
Bridgewater’s track record: approximately 3 losing years across 31 years of Dalio’s management. Worst drawdown: roughly 13%.
That is not a loss-free record. It is a dramatically reduced frequency and severity of losses, and that is still a profoundly better outcome than most concentrated portfolios achieve. It is the honest version of what the framework delivers in practice.
For readers wanting to convert these principles into a concrete action checklist, our dedicated guide to crisis-proofing your portfolio covers a four-question diagnostic framework and an eight-point preparation plan, including how to size a liquidity buffer and run a written 40-50% drawdown stress test.
A principle worth building a portfolio around
The concept Dalio calls the Holy Grail is not about finding the best assets. It is about engineering independence between return streams, so that no single position, no single macro call, and no single market shock can be catastrophic. That reframe alone changes how a thoughtful investor approaches portfolio construction.
The concept emerged from personal ruin, was validated by decades of systematic back-testing, and the mathematics explains why it works. That combination of honest origin story and defensible quantitative foundation is rare in investing, where most principles come with either a good narrative or good numbers, but seldom both.
The one question worth carrying into your next portfolio review is straightforward: how many genuinely uncorrelated return streams do you actually own? Not how many tickers. Not how many funds. How many independent economic stories. That question is the operative test of whether you are diversified or merely spread out.
This article is for informational purposes only and should not be considered financial advice. Investors should conduct their own research and consult with financial professionals before making investment decisions. Past performance does not guarantee future results. Financial projections are subject to market conditions and various risk factors.
—