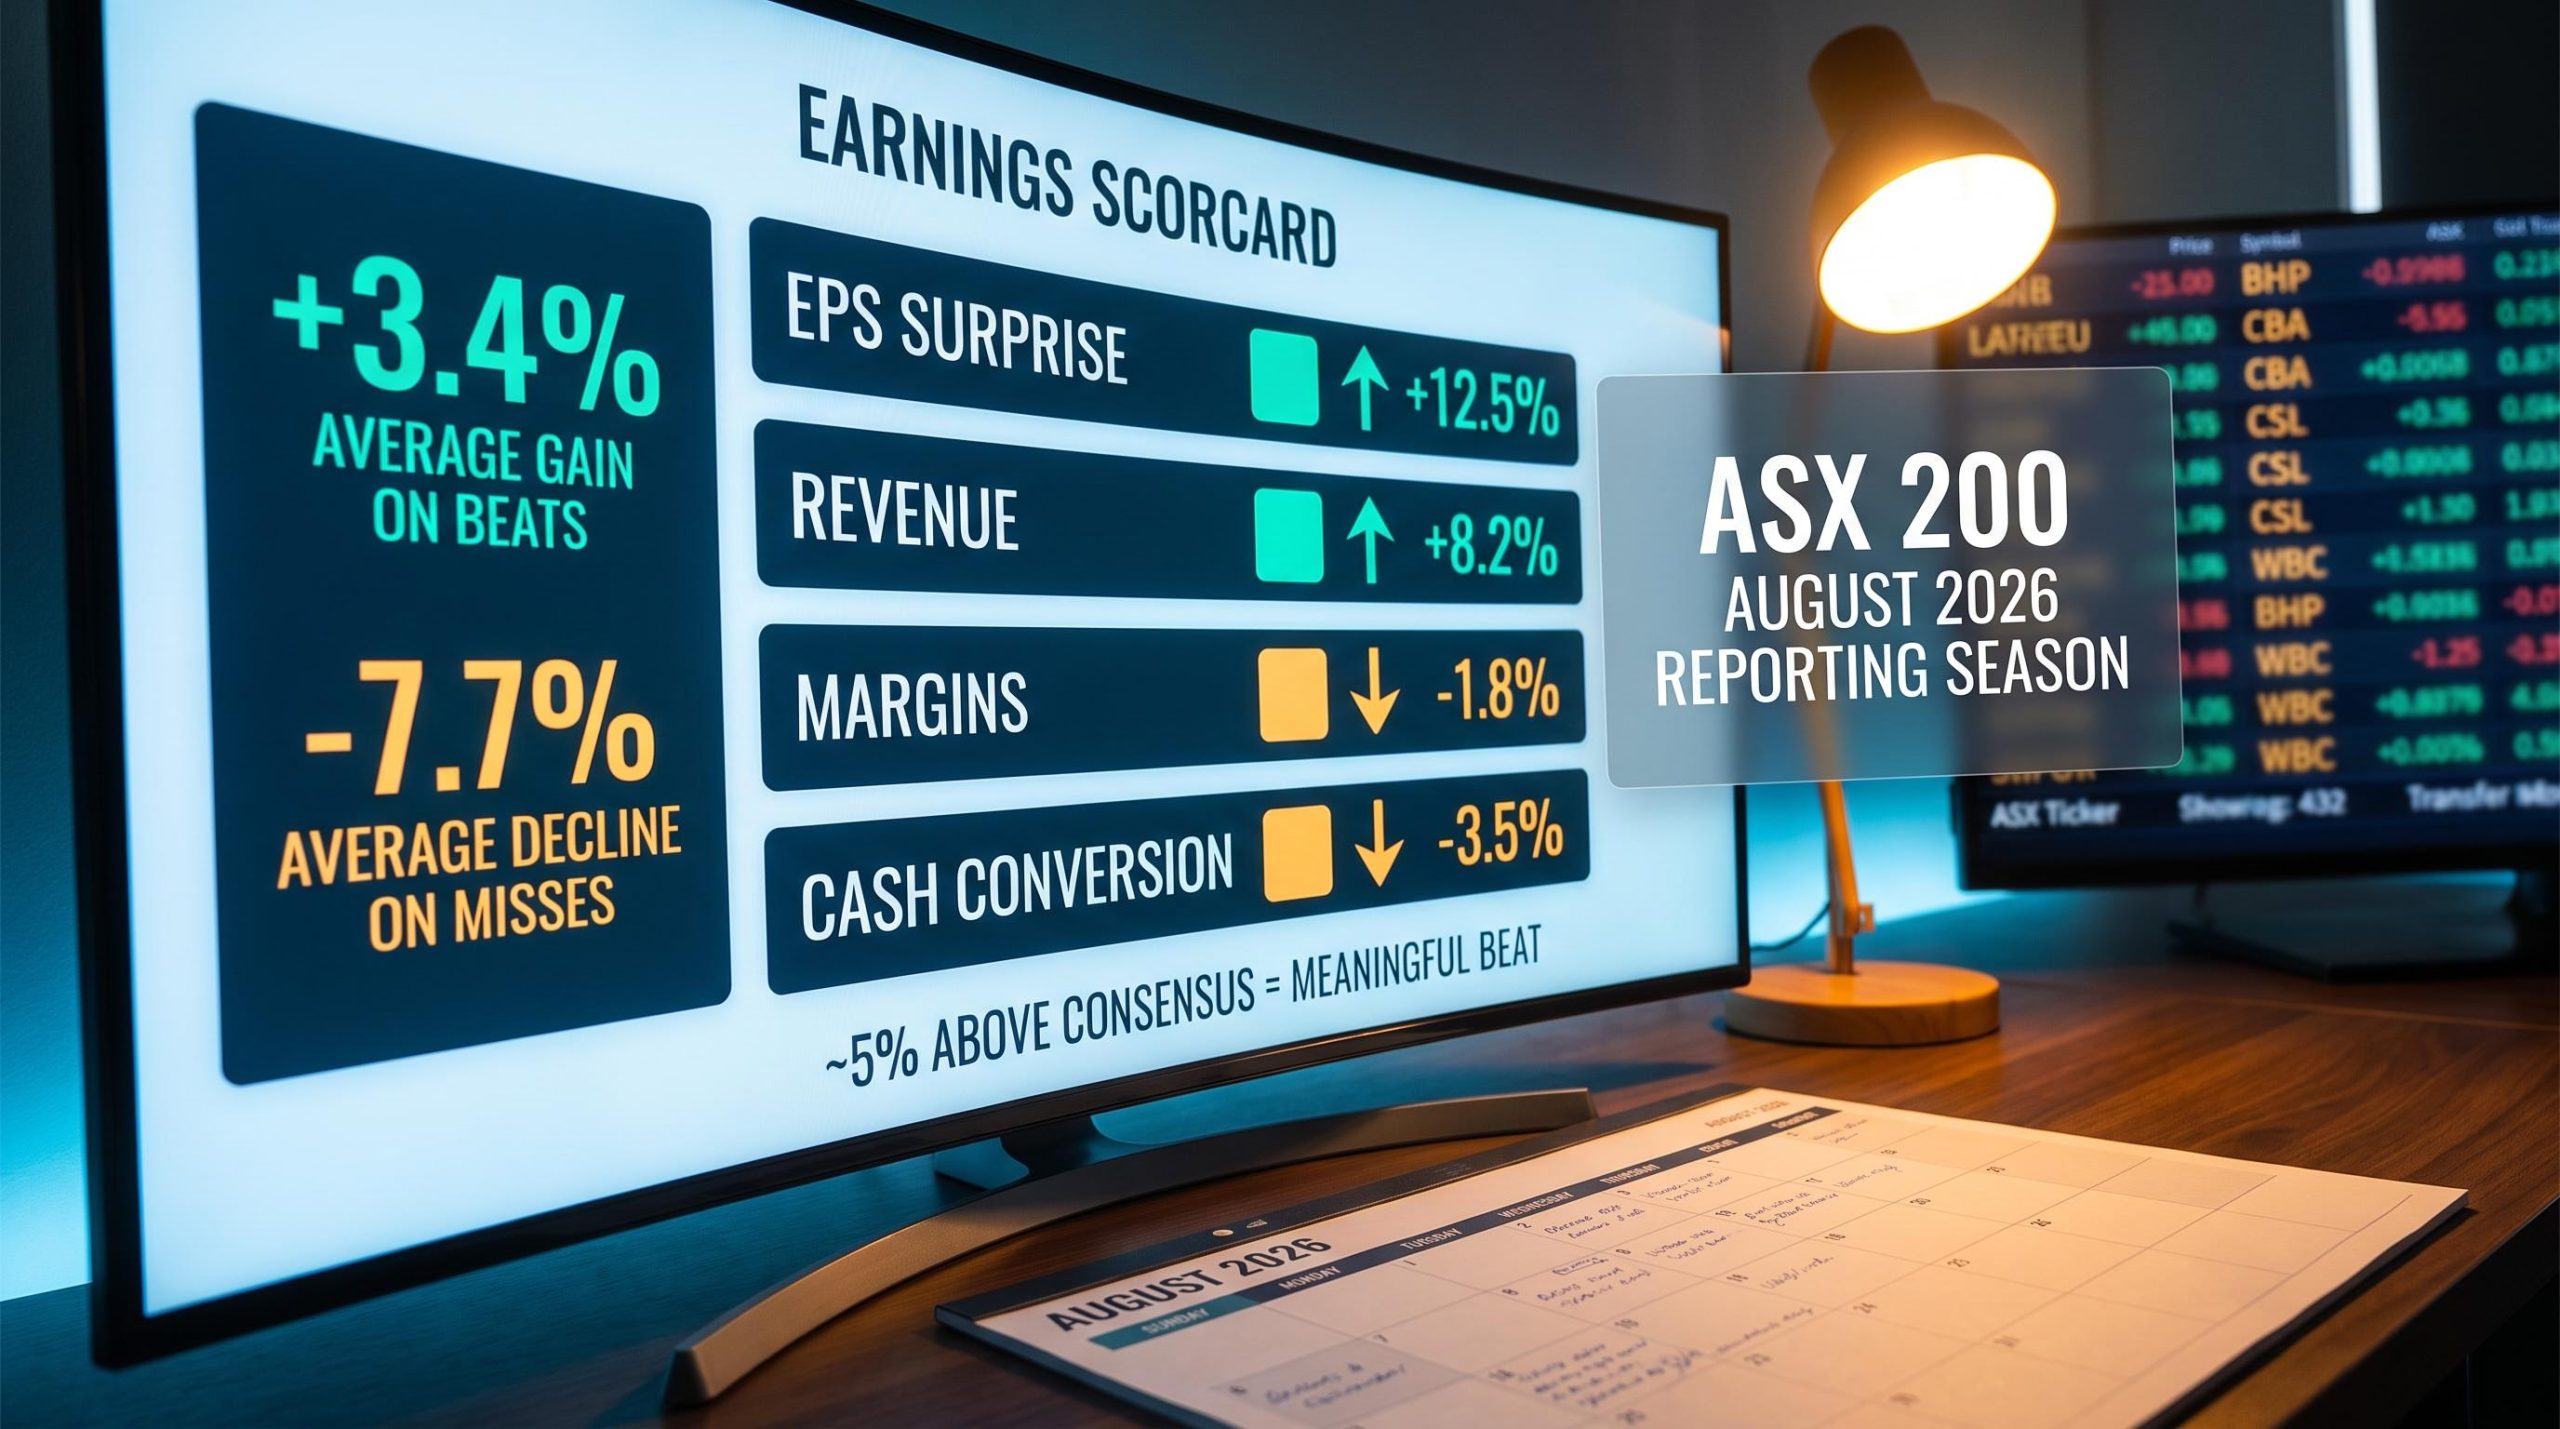
A company beats profit expectations by 15% and the share price drops 4% on the day. Another misses by a slim margin and falls 8% before lunch. If that pattern confuses you, it is because you are watching the wrong number. During the ASX reporting season, prices do not move on profit. They move on the gap between what a company reports and what the market already expected.
The August 2026 reporting season is about to compress the majority of ASX 200 full-year results into the latter half of the month. That creates an unusually concentrated window where portfolio-altering information arrives daily, sometimes hourly. You can approach it reactively, refreshing a share price and hoping for the best, or you can approach it with a framework that tells you what to look for before the numbers land.
Here is what you get from this piece: a four-metric lens you can apply consistently to every result between now and the end of August, a decision framework for what to do when a holding disappoints, and a set of behavioural traps to catch yourself on before they cost you capital.
Why the headline profit number is the wrong place to start
Your instinct when a result drops is probably to check whether profit went up. That instinct is wrong, or at least incomplete, because the market already priced in a profit increase months ago. What moves share prices during reporting season is the surprise: the gap between reported earnings per share (EPS) and the consensus forecast that analysts had published in advance.
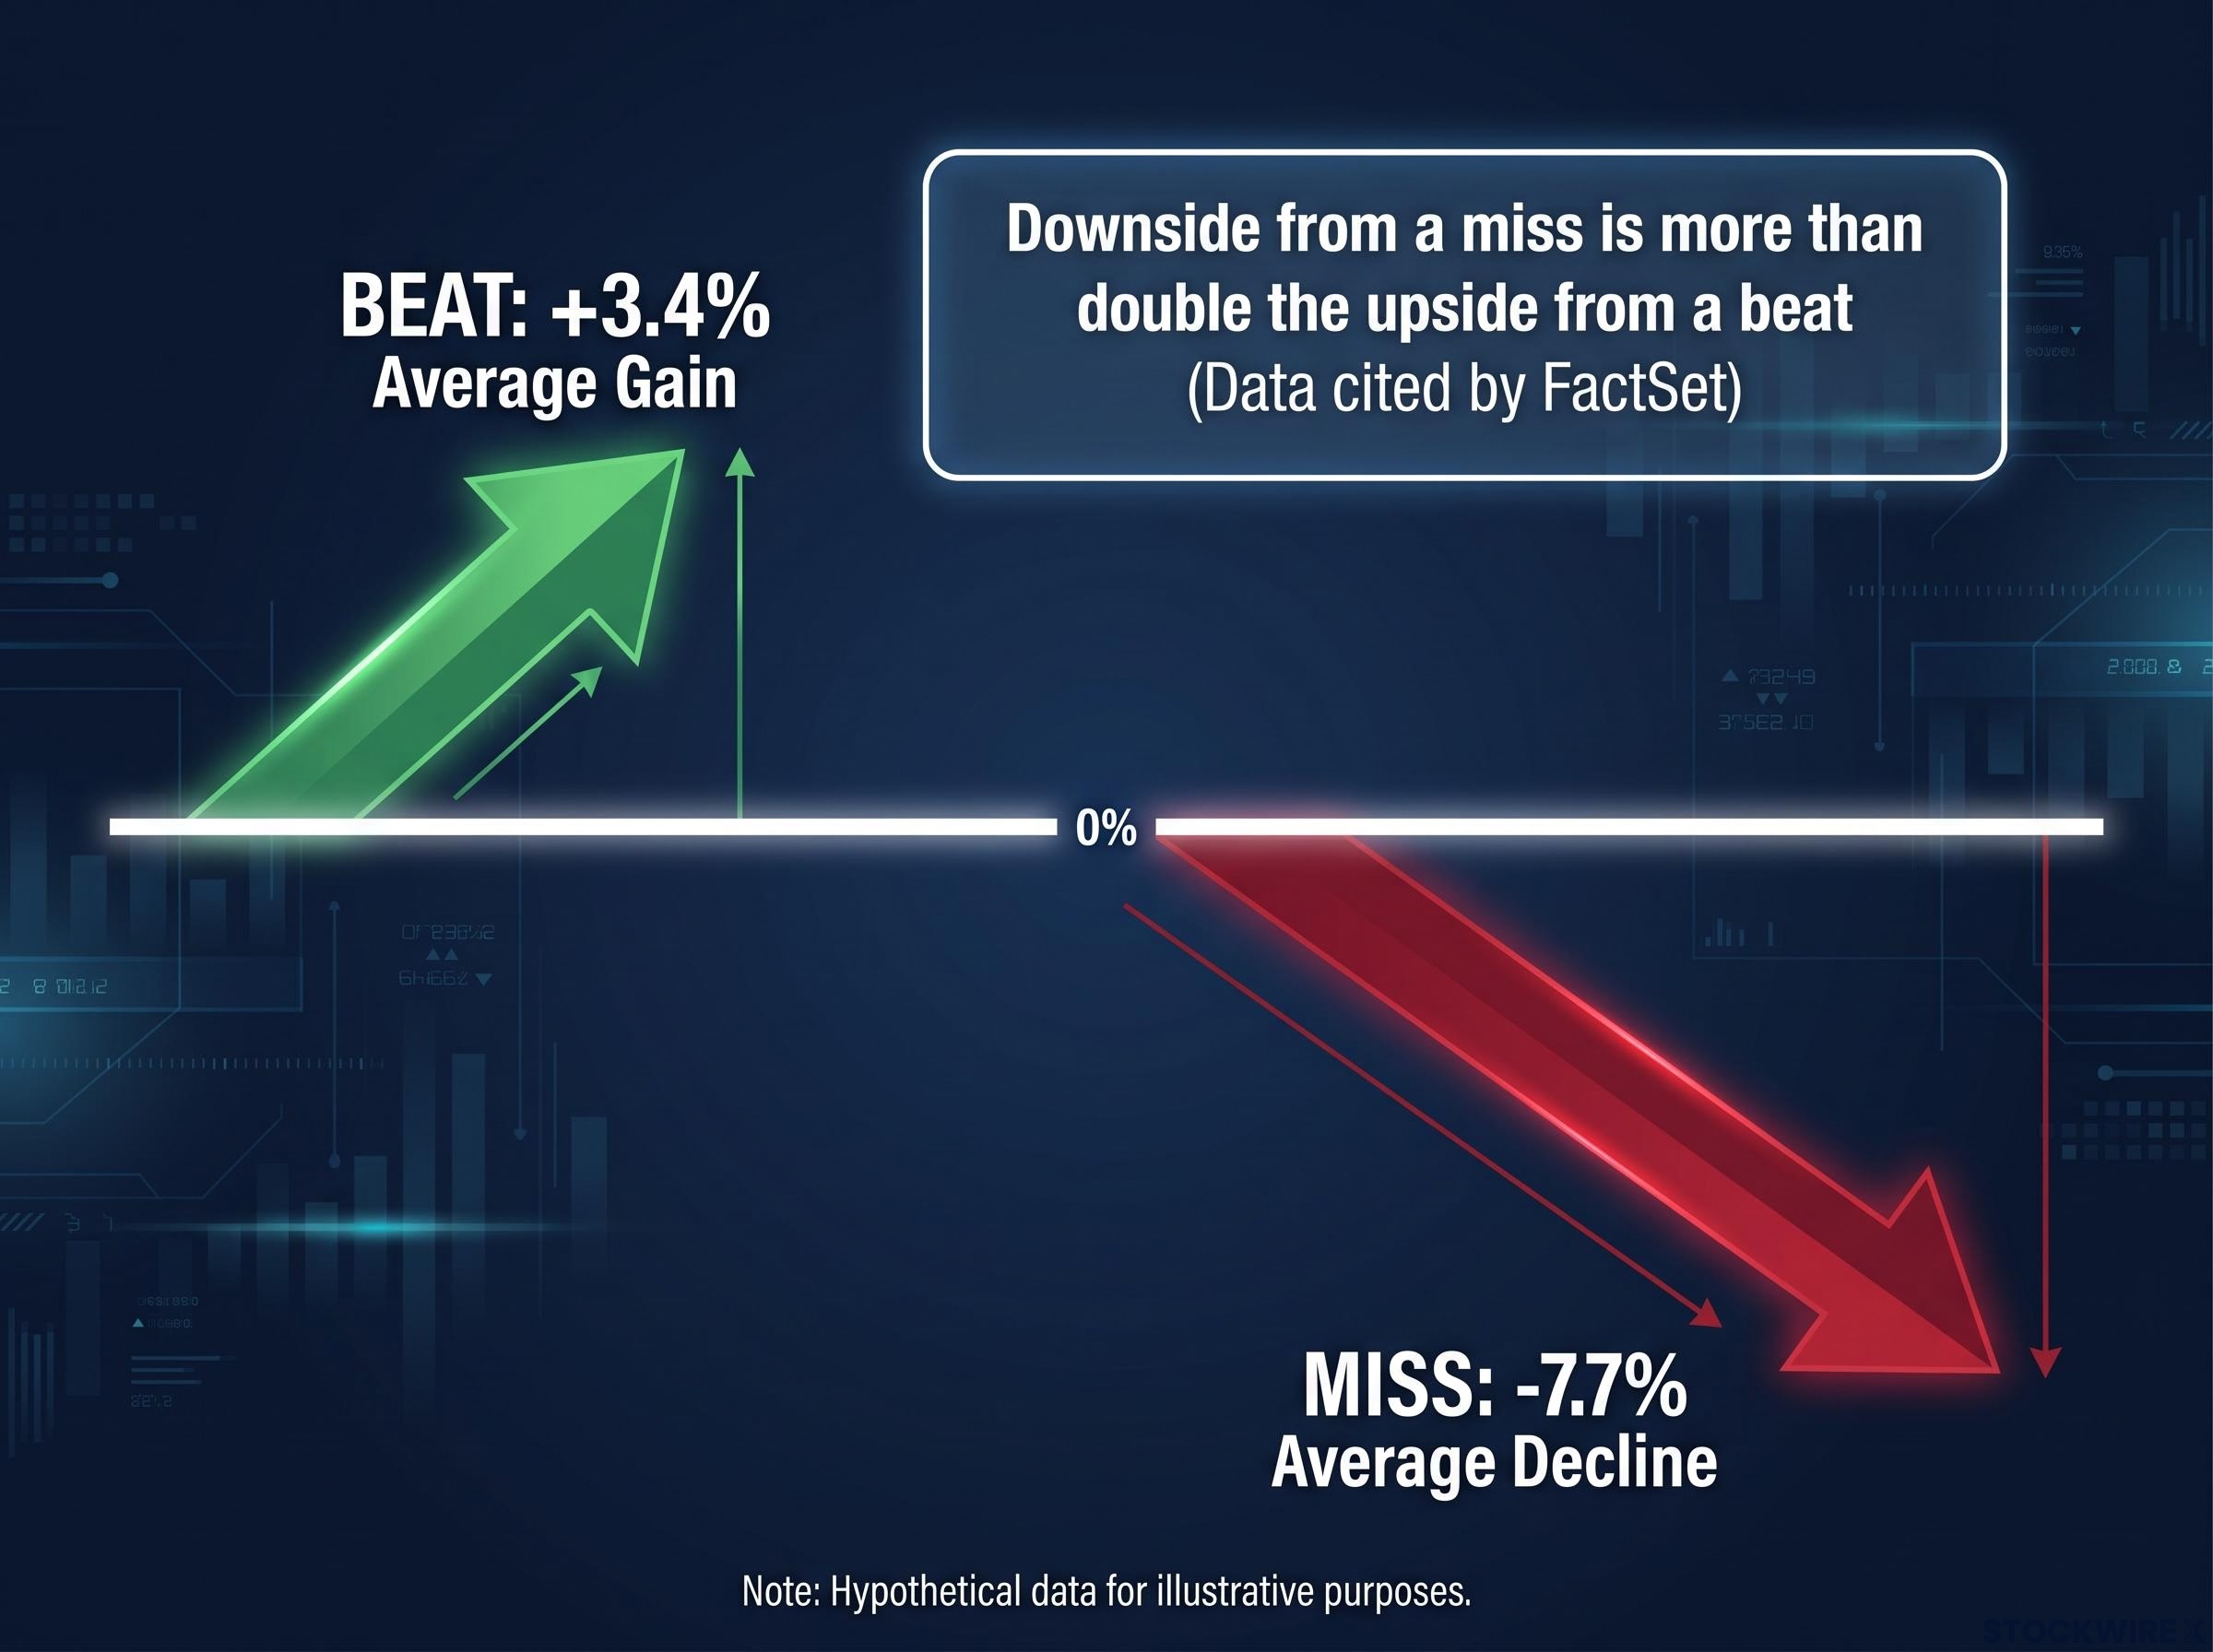
The asymmetry in how the market treats that surprise is what makes this worth understanding early. Analysis cited by FactSet found that in a recent Australian earnings season, companies that beat expectations delivered average gains of approximately +3.4%. Companies that missed saw average declines of around -7.7%. The downside from a miss is more than double the upside from a beat.
The FactSet Australian reporting season analysis of H1 FY26 results found that earnings beats among the largest ASX companies gained an average of approximately +3.4%, while misses declined an average of -7.7%, confirming that the downside from a miss is more than double the upside from a beat.
CommSec commentary has described investor behaviour during misses as “brutal,” particularly when reduced forward guidance accompanies the disappointment. The punishment compounds.
That asymmetry tells you something concrete about how you should prepare. The risk of holding a position into a miss costs you more than twice what you gain from catching a beat. That changes how you think about position sizing, about whether to trim before a result, and about how much homework is worth doing in advance.
One more distinction matters here. Consensus forecasts are typically quoted on an underlying EPS basis, which strips out significant one-off items. Many ASX companies emphasise this same underlying figure in their own results. When you check a number on Market Index or CommSec and compare it to the reported result, make sure you are comparing apples to apples: underlying to underlying, not statutory to underlying.
When big ASX news breaks, our subscribers know first
Applying a multi-metric lens to earnings announcements
EPS surprise alone is not enough. A company can beat on earnings by slashing costs while revenue shrinks, a beat that looks strong on a screen but tells you the business is getting weaker, not stronger. You need four checks, applied together, with each one testing whether the signal from the previous layer is real and sustainable:
- EPS versus consensus expectations: Did the company beat, meet, or miss, and what quality of earnings drove the result?
- Revenue growth and quality: Is the top line growing organically, and in which direction is the trend moving?
- Margin trends: Is the company becoming more or less profitable per dollar of revenue over multiple periods?
- Free cash flow and cash conversion: Is reported profit actually turning into usable cash?
Any single metric in isolation can mislead you. Skipping one of these steps is where analytical errors and poor hold or sell decisions originate. With the majority of ASX 200 full-year results landing in the latter half of August 2026, this framework is immediately applicable. Consensus data for EPS, revenue and dividends across hundreds of ASX companies is accessible right now on platforms such as Market Index, CommSec and broker reporting calendars.
ASX 200 earnings growth forecasts for FY26 sit at approximately 12% year-on-year, the strongest collective result in nearly four years, yet that headline figure is heavily concentrated in Mining and Financials; strip both out and the ex-sector growth rate narrows to around 2.5%, which changes the bar you should set when evaluating beats and misses across the rest of the market.
EPS versus consensus expectations
The surprise is what matters, not the number itself. A reported EPS of $1.20 means nothing until you know the market expected $1.10 (a meaningful beat) or $1.30 (a painful miss). A beat of approximately 5% or more above consensus is generally considered meaningful enough to drive a positive price reaction.
But you need to ask what drove the beat. A beat powered by strong revenue growth and stable or expanding margins is repeatable. That is a higher-quality result. A beat driven primarily by cost cuts, one-off items, or tax benefits has limited runway and may not recur next period.
The red flag to watch for: EPS beating consensus while revenue is flat or falling. That combination typically means temporary cost management is propping up the number, and the underlying business trajectory is weaker than the headline suggests.
Revenue growth and quality
Revenue is harder to manipulate than profit, which makes it a cleaner signal of whether customer demand is genuinely there. It is one of the first metrics institutional investors examine in ASX earnings releases.
The distinction between organic and acquisitive growth matters. Organic growth, growth within the existing business footprint, is a stronger signal of healthy demand. Acquisitive growth requires additional scrutiny: you need to check whether margins and cash flow are keeping pace with the expanded revenue base, because revenue that arrives through acquisition but dilutes returns is not creating value.
Direction matters as much as magnitude. Accelerating revenue growth (say, 4% to 8% to 12% across successive periods) typically warrants a higher valuation multiple. Decelerating or negative growth signals headwinds that may persist.
Sector context shapes what you should expect. Resources and energy revenue fluctuates with commodity prices; cross-check with production volumes before drawing conclusions. Consumer and retail revenue trends during August 2026 are particularly sensitive to cost-of-living and rate pressures, making organic top-line trends a direct indicator of whether customer demand is holding up.
Margin trends across multiple periods
Margins show you whether a company is becoming more or less profitable per dollar of revenue as it grows. Three types matter, and each adds a layer of information.
Gross margin compares revenue to the direct cost of producing goods or services. It tells you about product-level profitability before overhead. Operating margin (also called EBIT margin) brings in overhead costs: rent, wages, administration. It captures how efficiently the broader business operates. Net margin is the final bottom-line outcome after interest and tax.
Compare each margin to the prior corresponding period and to at least two to three prior reporting periods. A single period’s margin can be distorted; the trend across multiple periods is the real signal.
Sector-specific measures matter. For banks, net interest margin (NIM), the spread between what they earn on loans and pay on deposits, is the metric to track. August 2026 previews highlight that competition for deposits and mortgages is likely to pressure NIMs across the sector. For retail, watch gross margin closely for signs of discounting behaviour. For industrials, operating margin on new projects shows whether growth is profitable or just adding revenue.
A modestly profitable company with clearly improving margins often presents a stronger long-term investment case than a highly profitable company with slowly eroding ones. Trend matters more than the absolute level.
Free cash flow and cash conversion
Accounting profit is not cash. Dividends, buybacks, debt reduction and reinvestment all ultimately depend on cash generation. Free cash flow (FCF) is what remains from operating cash flow after subtracting capital expenditure. It is the money actually available to return to shareholders or reinvest.
Cash conversion measures how effectively reported profit translates into real cash. You calculate it by dividing FCF by net profit and expressing the result as a percentage. A company reporting strong profit growth but weak cash conversion is, in practical terms, generating numbers on paper rather than money in the bank.
When assessing dividend sustainability, check whether FCF comfortably covers the dividend after accounting for current capex levels. Payout ratios alone are not sufficient; they must be read alongside actual cash generation.
The capex profile tells you whether low FCF is a problem or a choice. Growth capex (new capacity, technology, expansion) can temporarily suppress FCF while building long-term value. That is generally acceptable. High maintenance capex alongside flat or declining earnings, however, signals a structurally capital-hungry business with limited capacity to generate free cash.
The warning pattern to watch for: persistently weak or negative cash conversion despite regular reported profit growth is a recurring characteristic of companies that subsequently face dividend cuts or equity capital raisings. It is one of the clearest early warning signals available to you in financial statements.
What a poor result actually tells you about the investment case
Your four-metric analysis has flagged a weak result. The harder question is what to do with that information.
The answer depends not on the size of the price drop on results day, but on whether the result strengthens or contradicts the original reason you owned the stock. This is your investment thesis: the specific assumptions about future growth, competitive position, or earnings power that made you buy in the first place. Morningstar emphasises material information thresholds as the basis for thesis reassessment, and the principle is straightforward: a single poor result rarely alters the long-term value of a business unless it introduces material new information that changes enduring structural assumptions.
If the core assumption behind your thesis, whether that was market-share gains, margin expansion runway, or earnings power trajectory, is now clearly weaker based on reported data and forward guidance, continuing to hold is no longer investing on evidence. It is investing on hope. That distinction is the clearest signal that capital should be redeployed rather than protected.
Management credibility compounds the question. Watch for these red flags:
- Repeated guidance downgrades or misses relative to what management itself previously guided
- Vague or blame-shifting explanations in earnings calls rather than clear, data-backed attribution
- Capital allocation decisions that appear value-destructive: poorly timed buybacks, acquisitions that dilute returns, or dividends funded from debt rather than cash flow
- Strategy shifts without evidence that previous strategies were given adequate time or resources
When these signals accompany a poor result, they tell you the problem may be structural rather than temporary.
For investors wanting to apply these thesis-reassessment principles to real ASX case studies under genuine price pressure, our dedicated guide to separating conviction from stubbornness in a drawdown uses Mineral Resources, Arcadium Lithium, and HMC Capital to show exactly how a pre-written thesis with explicit kill-switch conditions holds or breaks.
Three cognitive traps that cause investors to hold losers too long
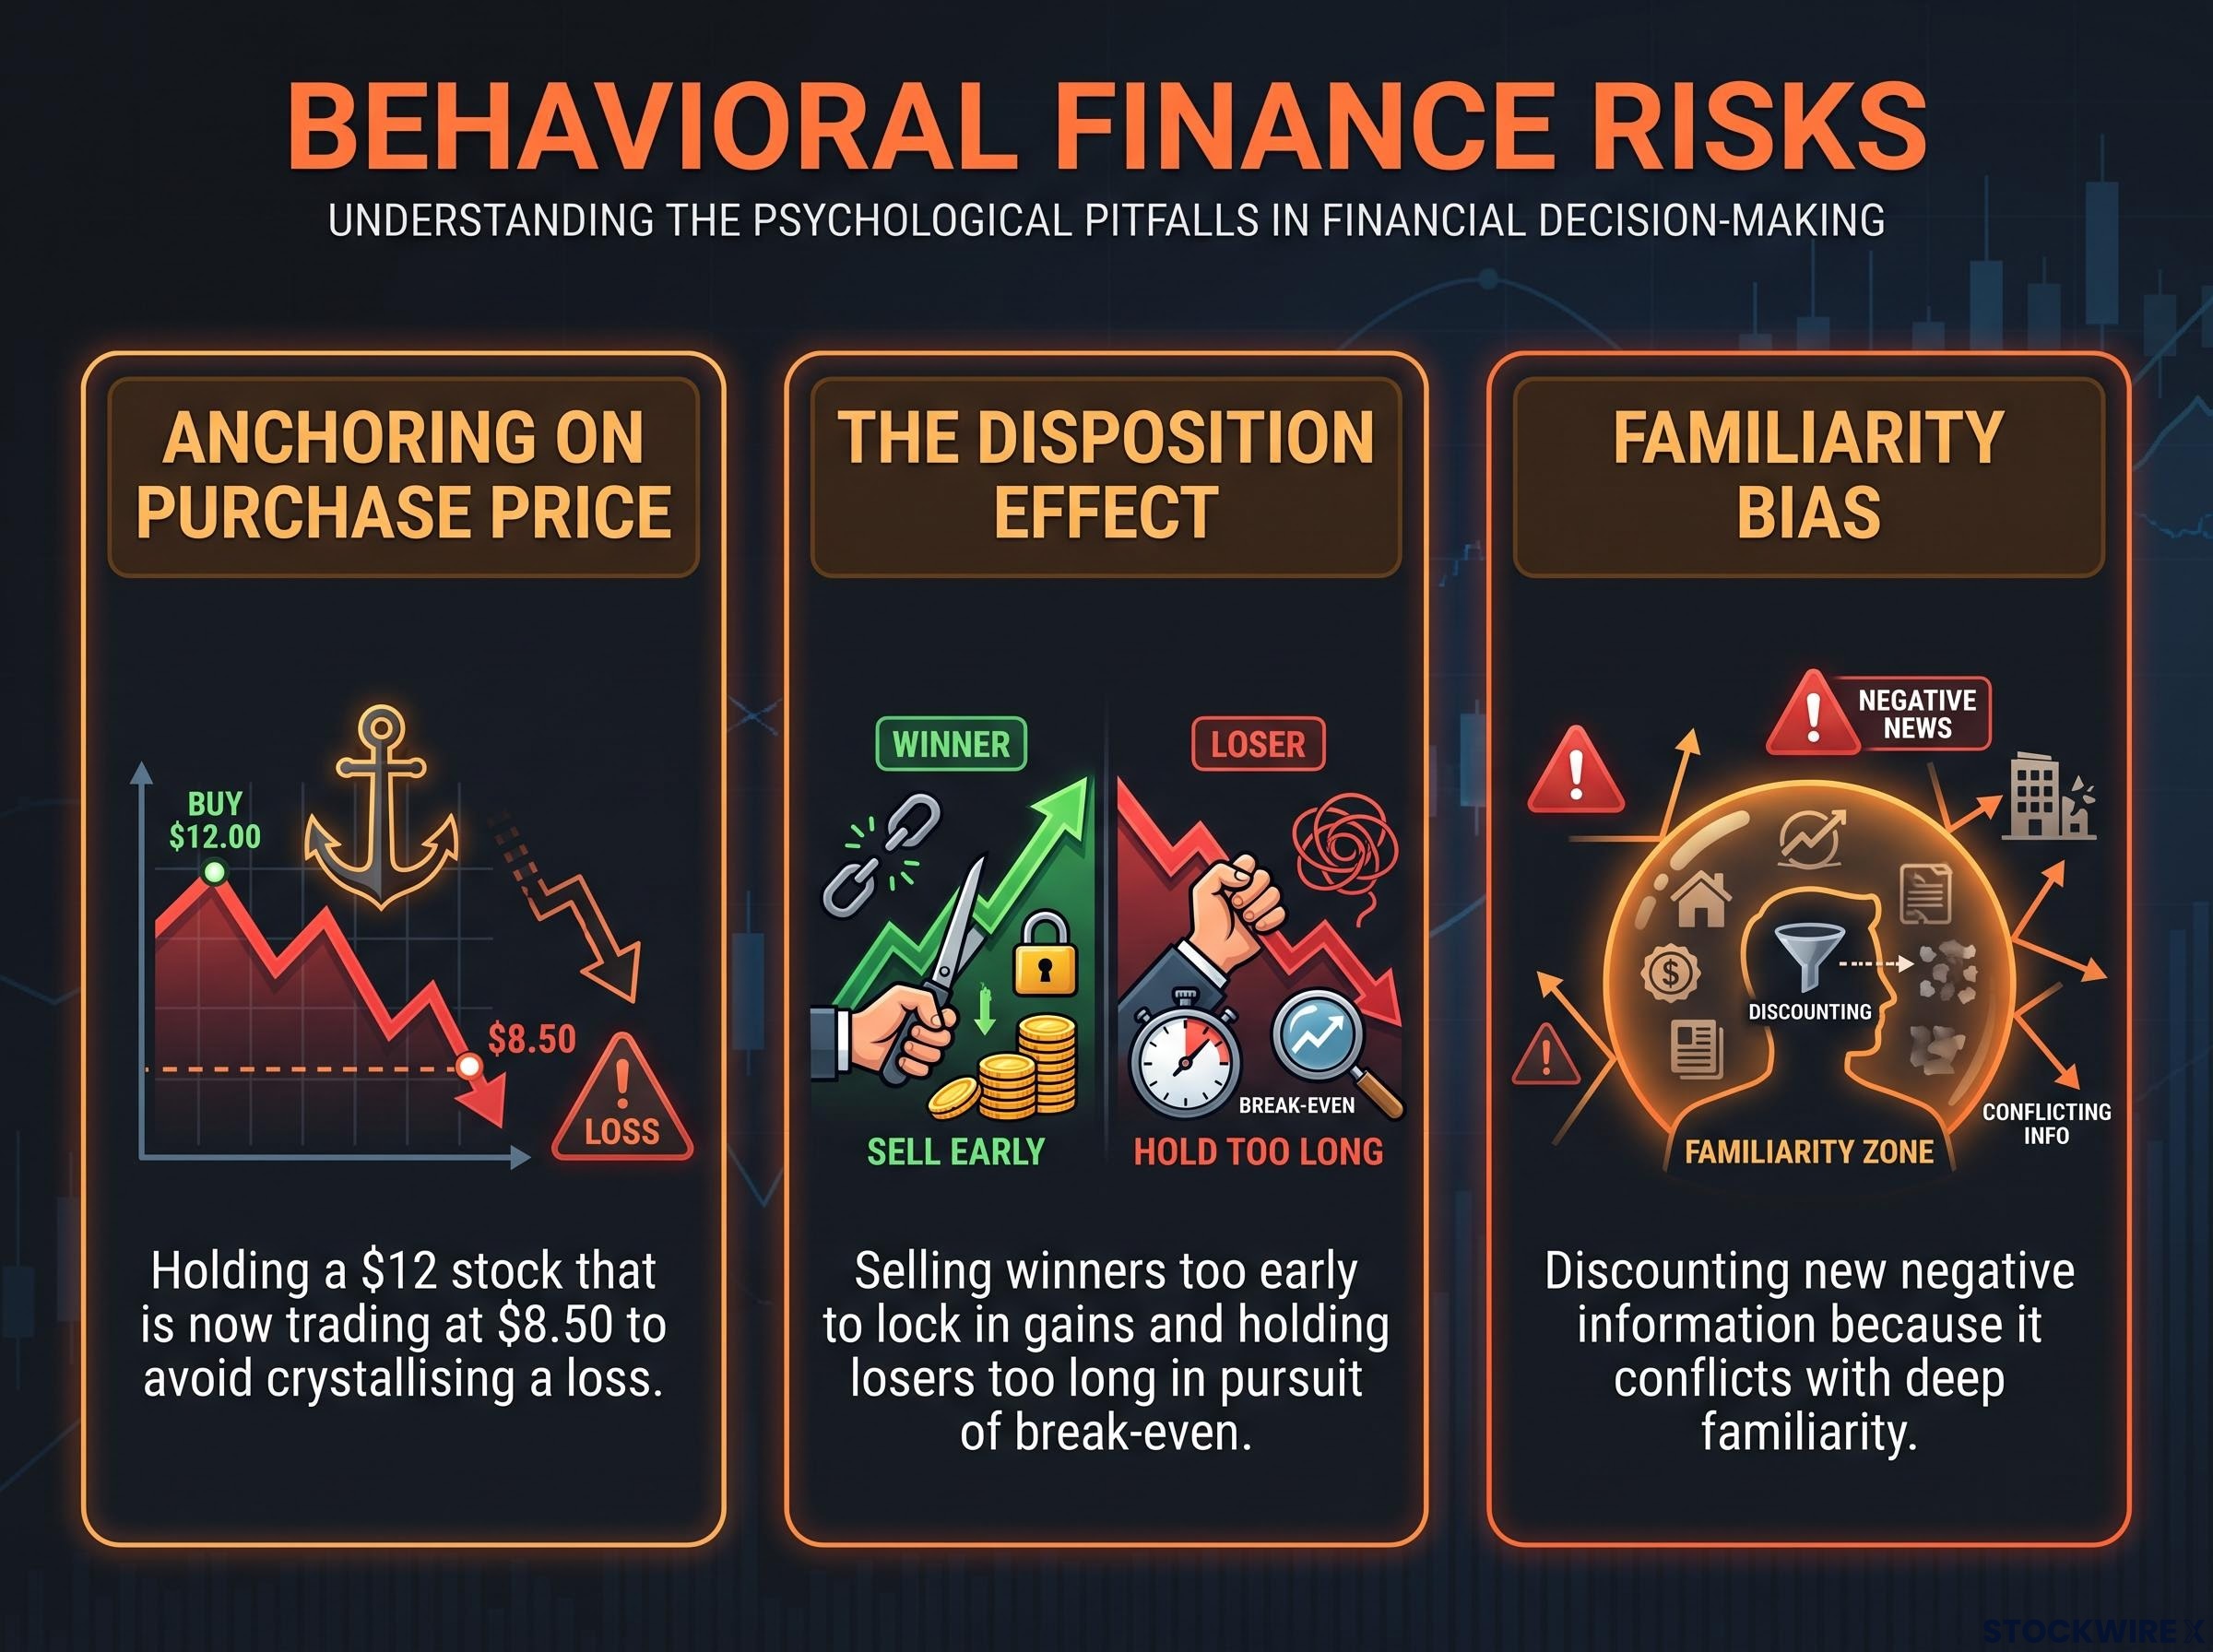
Knowing which bias is pulling you toward a decision gives you the chance to catch yourself and redirect toward the four-metric evidence. Reporting season is the highest-frequency decision environment most retail investors face, and these three traps are where the damage concentrates.
Anchoring on purchase price
You paid $12 for a stock that is now trading at $8.50. The pull to hold until it recovers to your entry price is powerful, but it is analytically irrelevant. Your entry price has no bearing on the stock’s future returns. What matters is the expected risk-adjusted return from today’s price versus your alternatives. Holding a losing position to avoid crystallising a loss is not a strategy; it is a cognitive bias dressed up as patience.
The disposition effect
Behavioural finance research documents a systematic pattern: investors sell winners too early to lock in gains and hold losers too long in pursuit of break-even. The disposition effect means you are statistically likely to do the opposite of what a fundamentals-based framework recommends. Using the four-metric checklist disrupts this by shifting your attention from price history to current business quality. The question is not “how far am I from break-even?” The question is “does this business still pass the test?”
The disposition effect is not just a theoretical construct; a University of Chicago study found that randomly selected sell decisions outperformed those of professional portfolio managers by up to 150 basis points annually, a finding that traces directly to the systematic pattern of selling winners too early and holding losers too long.
Familiarity bias
You have held a stock for three years. You have read every quarterly update. You feel like you understand this business better than the market does. That confidence causes you to discount new negative information because it conflicts with the deep familiarity you have built. Systematically working through EPS, revenue, margins and cash flow forces engagement with objective data rather than reliance on comfort with a familiar name. The data does not care how long you have been watching.
How to prepare before each result lands, not after
The institutional investors who consistently outperform during reporting season do not wait for a result to land and then scramble to interpret it. They prepare in advance, with pre-established criteria for what good and bad look like for each holding, so the result confirms or rejects a hypothesis rather than arriving as a surprise.
You can do the same with three concrete actions you can complete tonight for any result landing this week:
- Check the reporting date. Know exactly when each of your holdings reports its full-year result during August 2026. Broker reporting calendars, Market Index and CommSec all publish schedules.
- Find the consensus forecasts. Look up consensus EPS, revenue and dividend expectations for each holding. These are available on the same platforms. Write them down.
- Define your beat and miss thresholds. Before the number lands, decide what would constitute a meaningful beat (roughly 5% or more above consensus) and what would constitute a miss. This removes emotion from the initial reaction.
Before you can apply this framework, you need to know when each of your holdings reports; the ASX reporting calendar for August 2026 tracks broker consensus NPAT, EPS, and dividend figures for 78 named companies, giving you the schedule and the benchmarks in one place.
The institutional approach is the model: systematic evaluation, pre-established criteria applied consistently across every result, decisions driven by framework rather than price action. You do not need a Bloomberg terminal to operate this way. You need a checklist and fifteen minutes of preparation per holding.
Knowing the consensus expectation before a result lands means you are never surprised by the market’s reaction. You already understand what “good” and “bad” look like for that specific company in this specific season. The late-August concentration of ASX 200 results makes preparation this week directly relevant to capital decisions you will face within days.
A framework you can use for every result from here to the end of August
Everything above compresses into four diagnostic questions you can run against every result that lands between now and the close of the August 2026 season. This is not just for your current holdings; apply it to any ASX company reporting strong numbers that might deserve a place in your portfolio.
- EPS surprise quality: Did the company beat, meet, or miss consensus, and was the surprise driven by revenue strength or by cost cuts and one-offs?
- Revenue growth and composition: Is the top line growing organically, and is the trend accelerating, stable, or decelerating?
- Margin trend direction: Are gross, operating, and net margins improving or eroding across multiple periods, and does management credibly explain the movement?
- Cash conversion health: Is reported profit converting to free cash flow at a healthy rate, and are dividends and growth funded from FCF rather than rising leverage?
| Metric | What to check | Green flag | Red flag |
|---|---|---|---|
| EPS surprise | Beat, meet, or miss versus consensus; quality of the driver | Beat driven by revenue and margin strength | Beat from cost cuts or one-offs while revenue is flat or falling |
| Revenue | Organic vs acquisitive; directional trend | Accelerating organic growth | Decelerating or negative growth; acquisitive growth without margin support |
| Margins | Gross, operating, net across multiple periods | Improving margins on stable or growing revenue | Unexplained or recurring margin erosion |
| Cash conversion | FCF divided by net profit; dividend coverage from cash | Strong conversion; dividends comfortably covered by FCF | Persistently weak conversion despite reported profit growth |
Strong performance across all four metrics supports holding or adding, subject to your valuation view and risk profile. Poor performance across all four, particularly without credible and specific management responses, signals structural deterioration rather than a transitory miss. Use the checklist to override the three cognitive traps, not to validate a decision your instincts have already made.
A retail investor who runs this framework consistently across every holding during August 2026 is operating on the same analytical foundation as institutional investors. The tools are the same. The discipline is the differentiator.
This article is for informational purposes only and should not be considered financial advice. Investors should conduct their own research and consult with financial professionals before making investment decisions.