A traditional 60/40 portfolio returned approximately 11% in 2024. The S&P 500 returned roughly 25%. That 14-percentage-point gap represents more than a statistical curiosity; it quantifies the exact price US investors paid for conventional safety during one of the most concentrated equity rallies in recent memory. Volatility has not disappeared. Markets whipsawed through three separate drawdowns of 4-7% across 2024, each compressing into days rather than months. The question facing investors now is not whether protection is necessary, but which form of stock market crash protection carries the lower cost: the persistent drag of defensive assets, or the execution risk of actively timing exits. What follows is a layered comparison of both approaches, grounded in institutional data, historical case studies, and the structural market shifts that complicate each strategy. There is no perfect hedge. There are only different types of opportunity cost.
The performance drag of conventional defence
The frustration is not theoretical. It is visible in the returns.
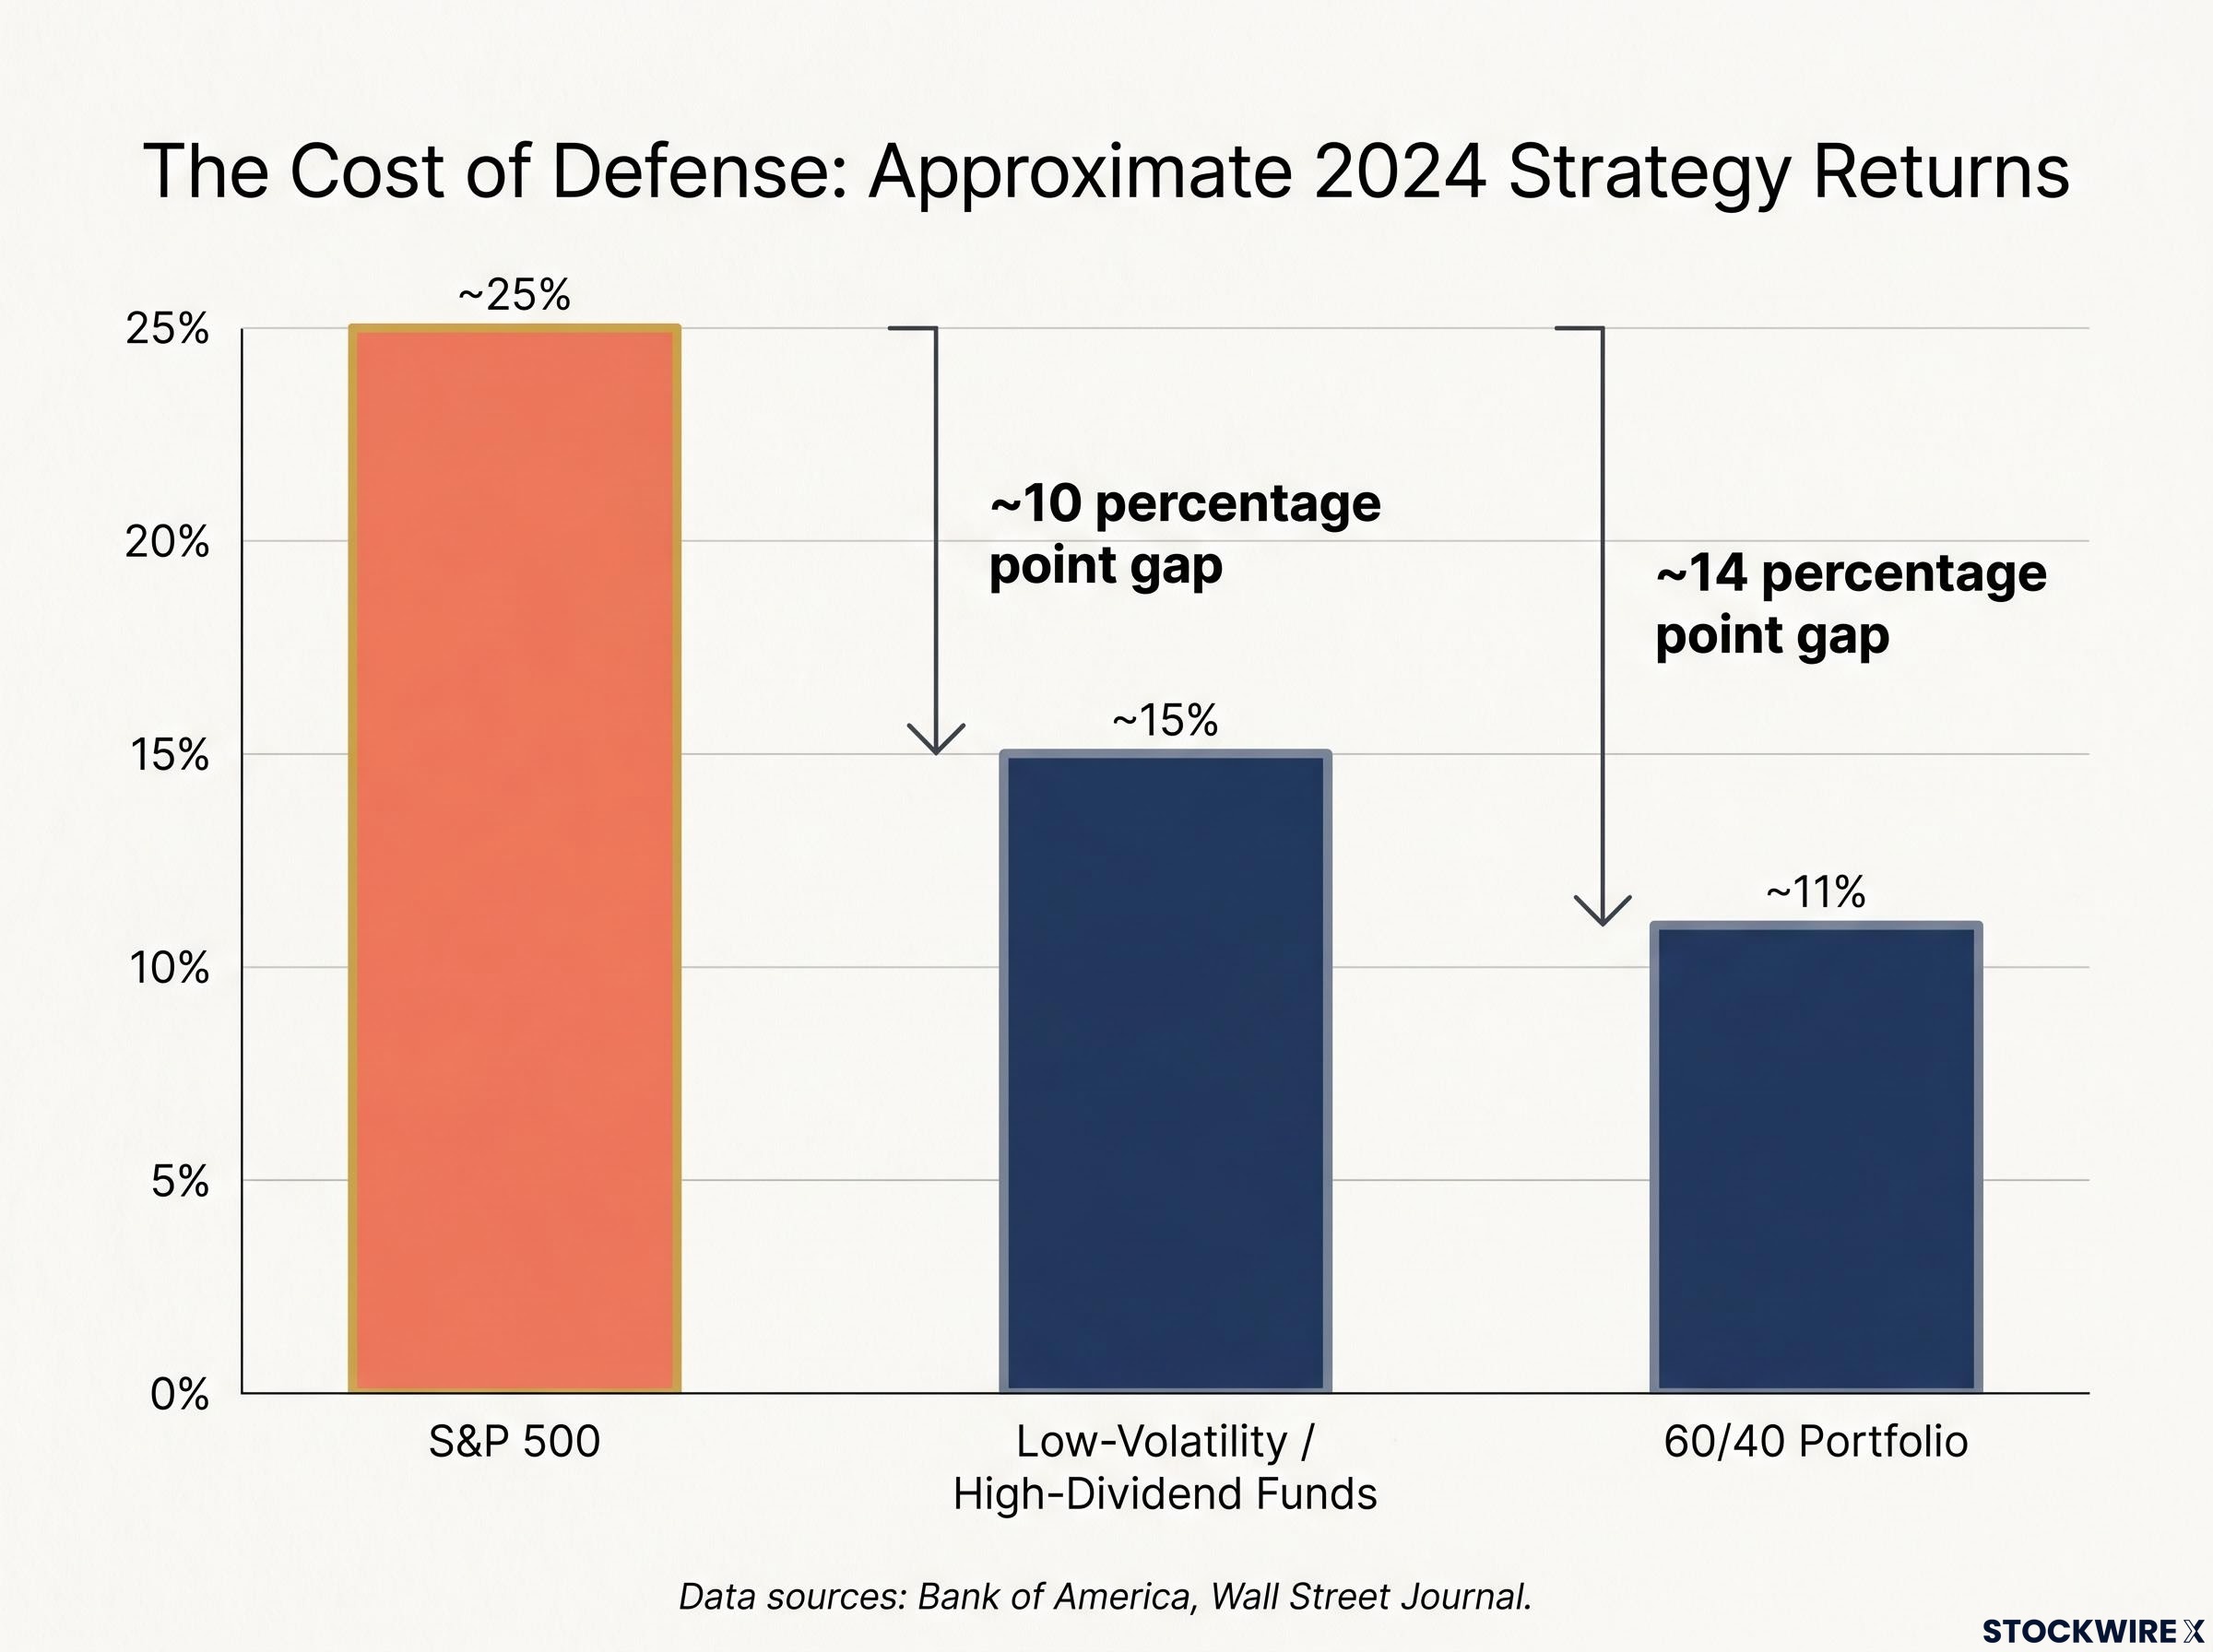
According to Bank of America, the traditional 60/40 portfolio delivered approximately 11% through late December 2024, a respectable figure in isolation. Set against the S&P 500’s roughly 25% gain over the same period, however, that allocation effectively cost investors 14 percentage points of forgone returns. The drag came from both sides: bond allocations underperformed during a period of persistent rate uncertainty, while equity allocations diluted by defensive positioning missed the full force of the megacap technology rally.
The underperformance extended beyond balanced portfolios. The Wall Street Journal reported that US low-volatility and high-dividend equity funds lagged the S&P 500 by approximately 10 percentage points in 2024. These funds, marketed as stability instruments, delivered neither meaningful downside protection during the year’s selloffs nor competitive upside during rallies.
The brief moments where defensive sectors outperformed proved fleeting. J.P. Morgan Asset Management observed that utilities and consumer staples outperformed the S&P 500 by roughly 3-4 percentage points during the April 2024 pullback. That relative advantage evaporated during the subsequent rebound, leaving full-period performance behind the broader index. The pattern is familiar: defensive sectors absorb less of the decline, then participate in less of the recovery.
| Strategy | Approximate 2024 Return | Gap vs. S&P 500 |
|---|---|---|
| S&P 500 | ~25% | Benchmark |
| 60/40 Portfolio | ~11% | ~14 percentage points |
| Low-Volatility / High-Dividend Funds | ~15% | ~10 percentage points |
The hidden price tag of standard defensive advice is not hypothetical. It is a measurable annual cost, compounding every year markets are led by concentrated growth.
The stock-bond correlation assumption that gave the 60/40 framework its theoretical foundation, specifically that bonds would rise when equities fell, has broken down during the inflation shocks of 2022 and 2025, and post-60/40 portfolio construction now demands diversification across economic regimes rather than simply across asset-class labels.
When big ASX news breaks, our subscribers know first
Rethinking downside risk and mitigation mechanics
Before weighing the merits of passive defence against active timing, the mechanics of each approach require clarification. Downside protection is not a single concept; it operates on a spectrum between softening a blow and attempting to dodge it entirely.
The most widely cited framework involves holding a cash buffer sized to cover one to three years of living expenses. This reserve is not a market bet. Its purpose is narrower: preventing the forced liquidation of equity positions during a drawdown. Selling shares at depressed prices to cover living costs locks in losses permanently. A cash buffer removes that pressure.
Beyond cash, traditional defensive positioning typically operates in three tiers:
- Cash buffers: Liquid reserves held outside equities, sized to meet near-term spending needs and prevent forced selling during downturns.
- Defensive equities: Allocations to lower-volatility sectors (utilities, consumer staples, healthcare) that historically decline less than the broader market during selloffs.
- Non-correlated assets: Positions in bonds, commodities, or alternative strategies intended to move independently of equity markets.
The limitation of this tiered approach surfaces during systemic liquidity events, when correlations between asset classes converge toward one. During the early stages of the COVID-19 crash in March 2020, equities, corporate bonds, and commodities fell simultaneously. Diversification provided limited shelter precisely when shelter was most needed. Understanding this mechanical vulnerability is the prerequisite for evaluating whether a more aggressive, all-or-nothing timing approach can deliver what diversification cannot.
The active timing framework and the binary cash switch
The most aggressive alternative rejects partial defence entirely. Under this framework, a 100% cash position is the only genuine defensive stance, and every other measure is a compromise that still exposes capital to drawdown risk.
This approach relies on reacting to confirmed events rather than forecasting macroeconomic outcomes. Probability estimates replace conviction. Daily monitoring replaces quarterly rebalancing. The operational intensity is significant: it demands stripping away emotional biases and executing decisions based on the weight of evidence as it arrives, not on predictions about where evidence might lead.
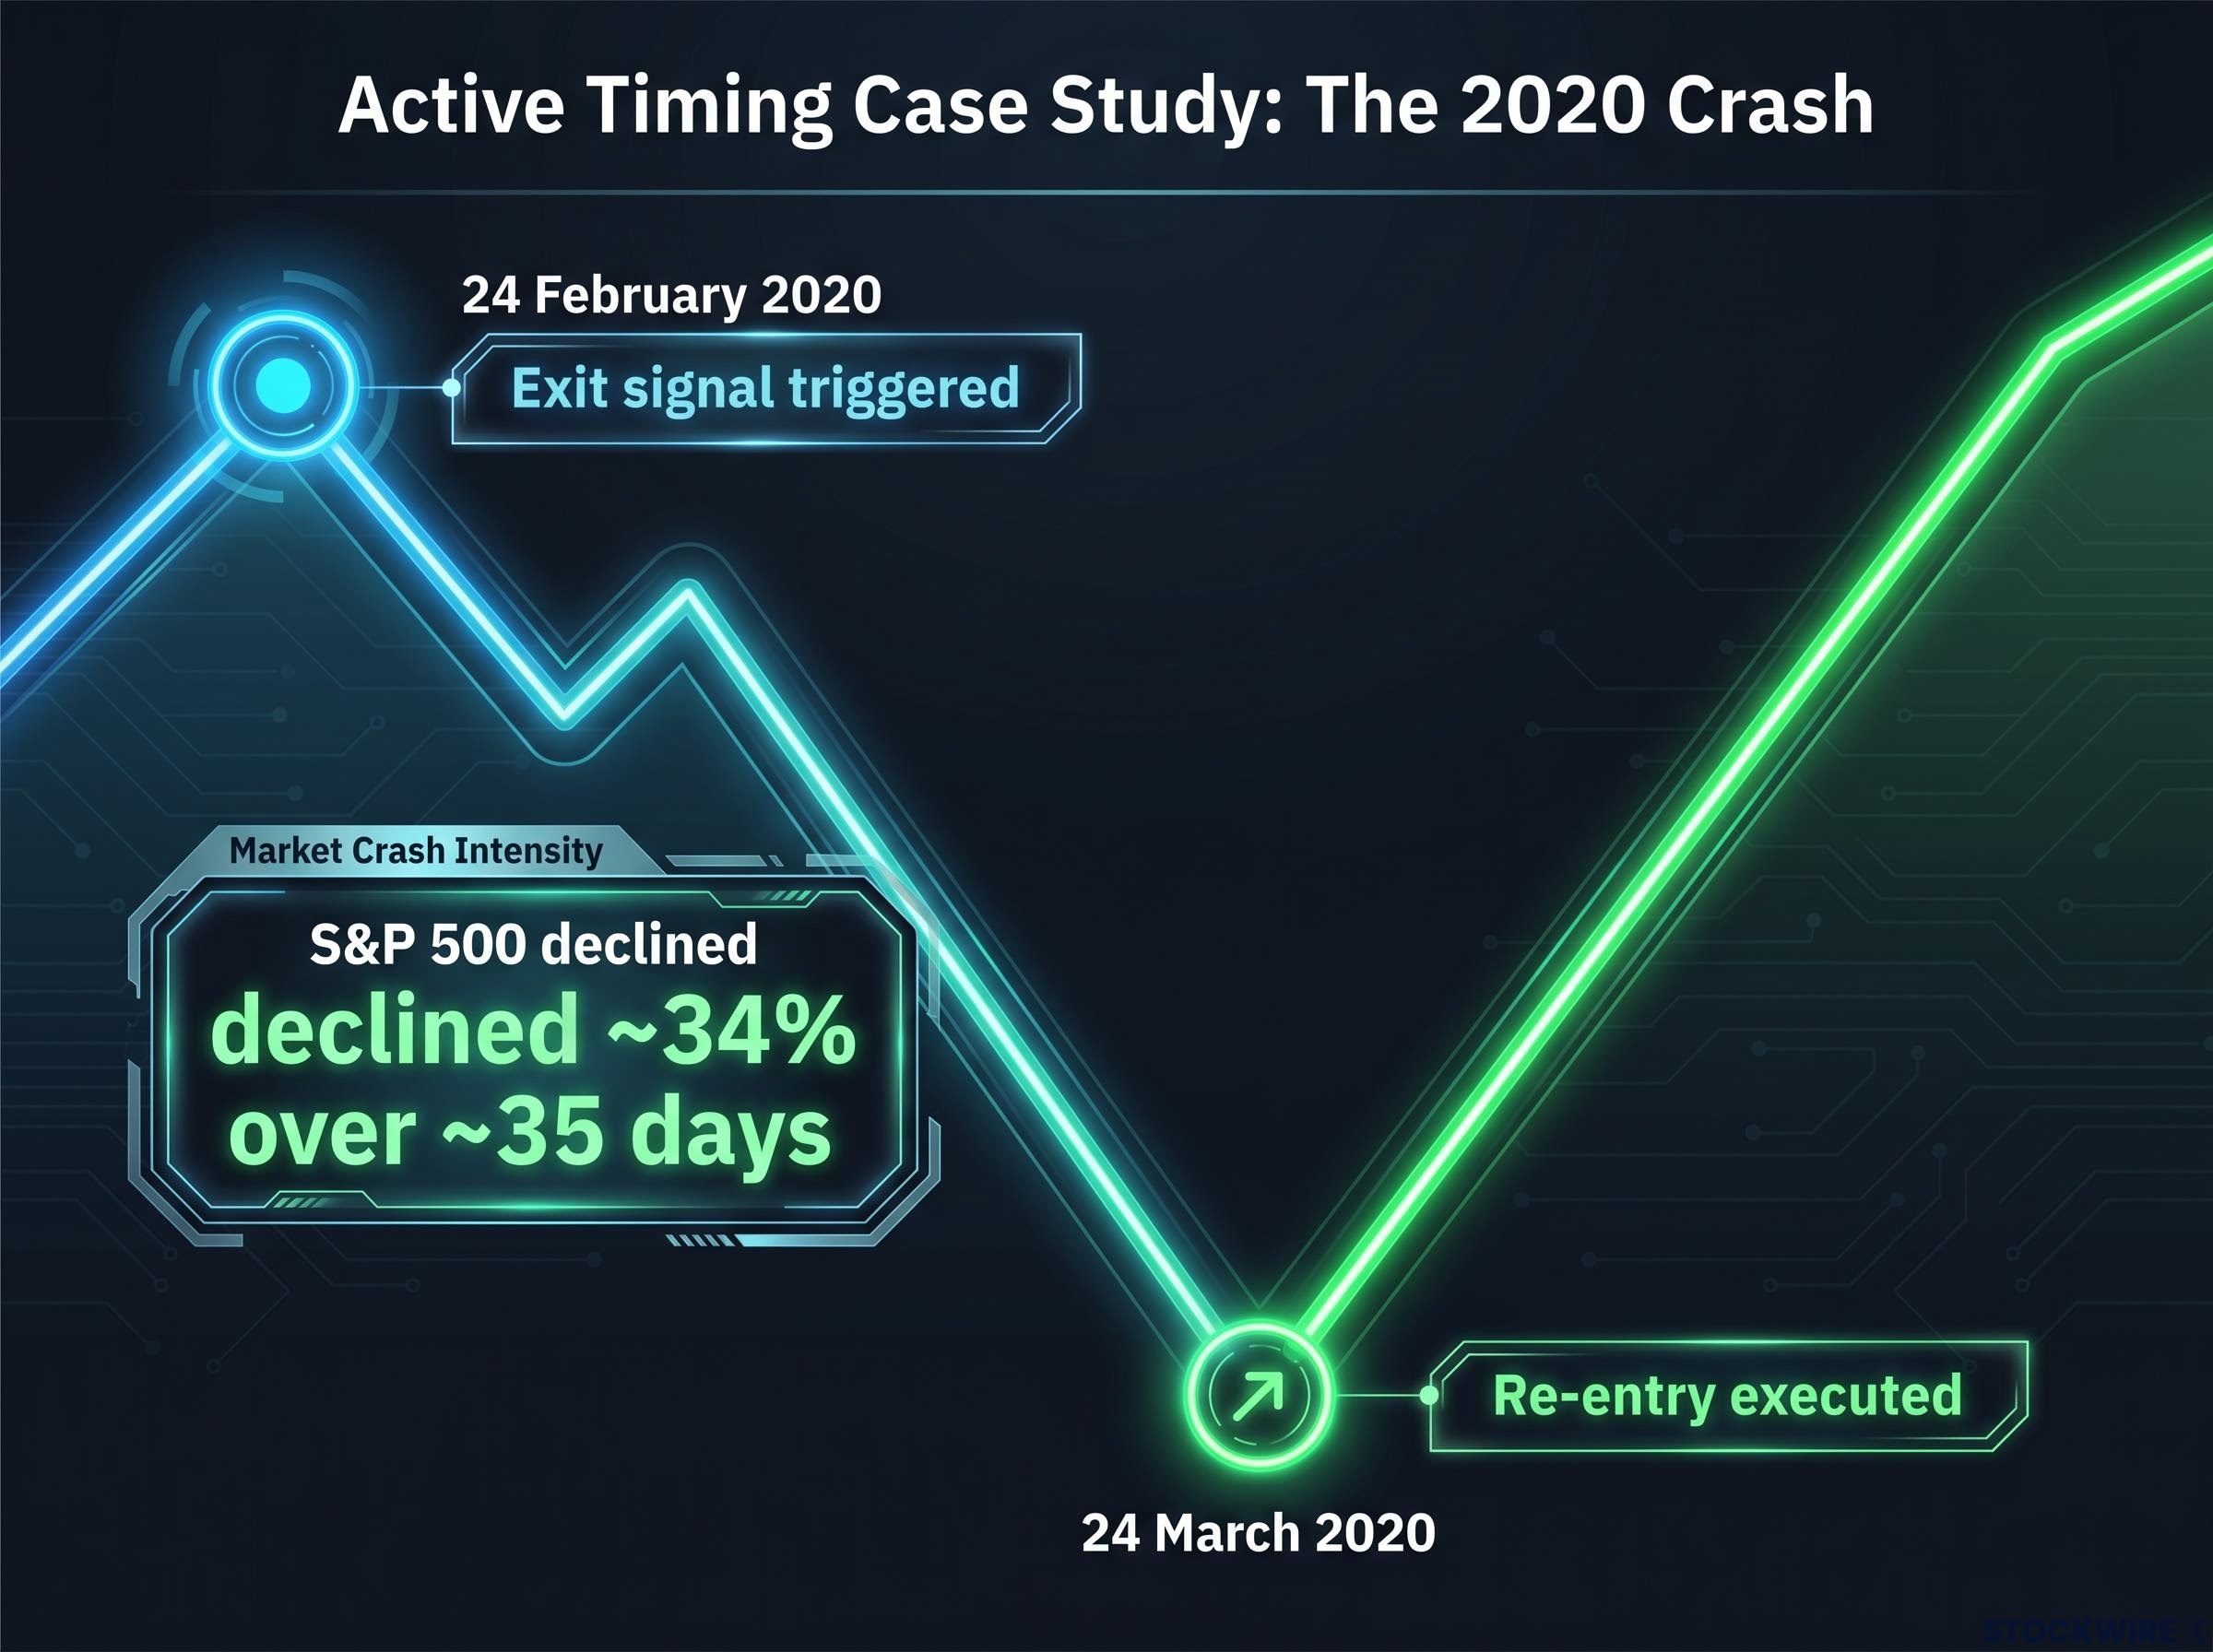
The COVID-19 crash provides the most cited case study for this strategy in action:
- 24 February 2020: Exit signal triggered as confirmed cases outside China accelerated and equity markets began sustained selling.
- 24 February to late March 2020: The S&P 500 declined approximately 34% over roughly 35 days while capital sat in cash.
- 24 March 2020: Re-entry executed as the market established a bottom, capturing the beginning of a recovery that would eventually recoup all losses within months.
The execution window was narrow, but the outcome was unambiguous: a portfolio that exited on the signal and re-entered at the trough avoided the entirety of a generational drawdown.
Navigating the 2023 rate cycle peak
A second application occurred during the 2023 interest rate cycle. Capital was moved to cash in mid-2023 as the Federal Reserve pursued rapid rate increases that compressed equity valuations. The re-entry came in November 2023, following Federal Open Market Committee (FOMC) communications signalling that inflation had peaked and rate reductions could begin. The trigger was not a forecast of when rates would fall, but a reading of confirmed institutional language that the tightening cycle was concluding.
Both examples share a common trait: the timing decisions were reactive, not predictive. The system responded to events that had already occurred, then assigned probabilities to the range of outcomes that followed. The appeal is intuitive: total avoidance of the decline, followed by full participation in the recovery.
The institutional reality check on sidelined capital
The historical case studies are compelling in retrospect. Institutional research, however, suggests that the probability of replicating them consistently is far lower than the successful examples imply.
J.P. Morgan Asset Management guidance, cited in mid-2024, demonstrated the statistical penalty for mistiming a re-entry:
Missing just the 10 best days in the market over a 20-year period can roughly halve total returns, according to J.P. Morgan Asset Management. The strongest recovery days frequently cluster immediately after the sharpest declines, meaning an investor who exits during a crash is statistically likely to miss the most powerful rebound sessions.
J.P. Morgan Asset Management’s Guide to Retirement quantifies this penalty precisely: missing the 10 best days over the 20-year period from January 2004 through December 2023 reduced annualised returns from 9.8% to 5.6%, a compression that effectively halves the compounding base available to long-term investors.
This asymmetry is the structural problem with binary timing. The best days and the worst days are neighbours on the calendar. An investor who successfully avoids the crash but re-enters even a few sessions late forfeits a disproportionate share of the recovery.
Goldman Sachs Asset Management reported in April 2024 that while the firm uses macro and valuation signals to adjust equity exposure, it “rarely” moves fully to cash. The reasoning: the opportunity cost of being out of the market during policy or data shifts typically exceeds the benefit of avoiding short corrections. Vanguard research reinforced this position, noting that persistent strategic cash buffers reduce long-term expected returns and that most timing efforts fail to add value after costs.
The institutional consensus does not dismiss tactical adjustments. It dismisses the all-or-nothing switch. Disciplined rebalancing and modest tactical tilts, where equity exposure shifts by 5-15% rather than 100%, represent the institutional preference because they preserve participation in recovery rallies while still reducing peak exposure.
Disciplined rebalancing, the institutional preference described by Goldman Sachs and Vanguard, is most effectively executed after multi-year equity rallies have already pushed allocations well beyond their original targets, with a 60/40 portfolio that has drifted to 70/30 representing exactly the kind of unintended risk concentration that a rules-based review process is designed to catch.
How algorithmic trading rewrote the correction playbook
Both defensive approaches, passive and active, now operate in a market environment that behaves differently from prior decades. The nature of US drawdowns has shifted from prolonged, grinding bear markets to rapid, synchronised shocks followed by equally rapid recoveries. This compression challenges both strategies simultaneously.
Three structural shifts are responsible:
- Zero-days-to-expiry (0DTE) options volume: Cboe Global Markets data shows that short-dated options and 0DTE algorithmic trading have made intraday swings more violent. The VIX now reacts more quickly to order-flow shocks than in prior market cycles, creating sharp spikes that can resolve within hours.
- Algorithmic ETF flows: AI-enhanced quantitative funds and systematic volatility-targeting models adjust exposures simultaneously, according to Financial Times reporting from May 2024. When these systems de-risk, they do so in unison, accelerating the selloff. When they re-engage, the snap-back is equally compressed.
- Megacap concentration risk: Citigroup equities strategy noted that AI stock-selection models and AI-themed exchange-traded funds (ETFs) have concentrated flows into a small group of US megacap technology names. This concentration means that a correction in a handful of stocks can move the entire index within days.
The practical consequence is visible in recent market data. In October 2023 and April 2024, selloffs of 4-6% unfolded over mere days before systematic recoveries driven by CTA (commodity trading adviser) and volatility-targeting models re-engaging. State Street Global Advisors has argued that the liquidity provided by ETFs, combined with rules-based strategies, compresses the duration of corrections, producing “snap-back” rebounds that reward investors who remain invested and penalise those who hesitate.
For active market timers, this compression narrows the execution window to days or even hours. For passive defensive allocations, the rapid recovery cycle means the brief period of relative outperformance shrinks further with each cycle. Neither approach is immune to the acceleration.
For investors who want to understand the specific conditions under which staying invested is most and least defensible, our full explainer on geopolitical risk and market resilience examines how markets process probability-adjusted earnings impacts rather than proportional headline shocks, with case studies from the Caspian Pipeline attack and prior Taiwan Strait episodes that show why consensus predictions have consistently overestimated equity damage.
Choosing your pain in modern markets
The choice facing US investors is not between safety and risk. It is between two distinct forms of cost.
Traditional defensive positioning carries a measurable performance drag. In a market driven by concentrated megacap technology gains, holding bonds, low-volatility equities, and cash buffers has consistently underperformed by 10-14 percentage points annually during strong rallies. That cost compounds. Over a decade, it can represent a substantial difference in terminal wealth.
Active binary timing offers the theoretical possibility of avoiding drawdowns entirely. The historical examples are real. The statistical reality, however, is that missing even a small number of the market’s strongest recovery days, which cluster immediately after crashes, can halve long-term returns. The speed of modern algorithmic corrections narrows the execution window further, making the strategy viable only for highly disciplined, system-driven participants with the capacity for daily monitoring and decisive action.
Market cycle sentiment signals, including Sir John Templeton’s four-stage model that moves from pessimism through optimism into euphoria, are frequently cited as exit triggers by active timers, but Ken Fisher’s May 2026 assessment places the current cycle in early-stage euphoria with a potential two-year runway before a phase transition, illustrating why treating a sentiment label as a countdown clock is a category error.
For investors who cannot commit to that operational intensity, accepting the volatility of staying fully invested remains mathematically superior to haphazard timing attempts. The framework reduces to a single question: which cost, the persistent drag or the execution risk, is the one the individual investor is best equipped to bear?
This article is for informational purposes only and should not be considered financial advice. Investors should conduct their own research and consult with financial professionals before making investment decisions. Past performance does not guarantee future results. Financial projections are subject to market conditions and various risk factors.