VAS vs VHY: Why the Lower-Yield ETF Wins in Retirement
3 hrs ago

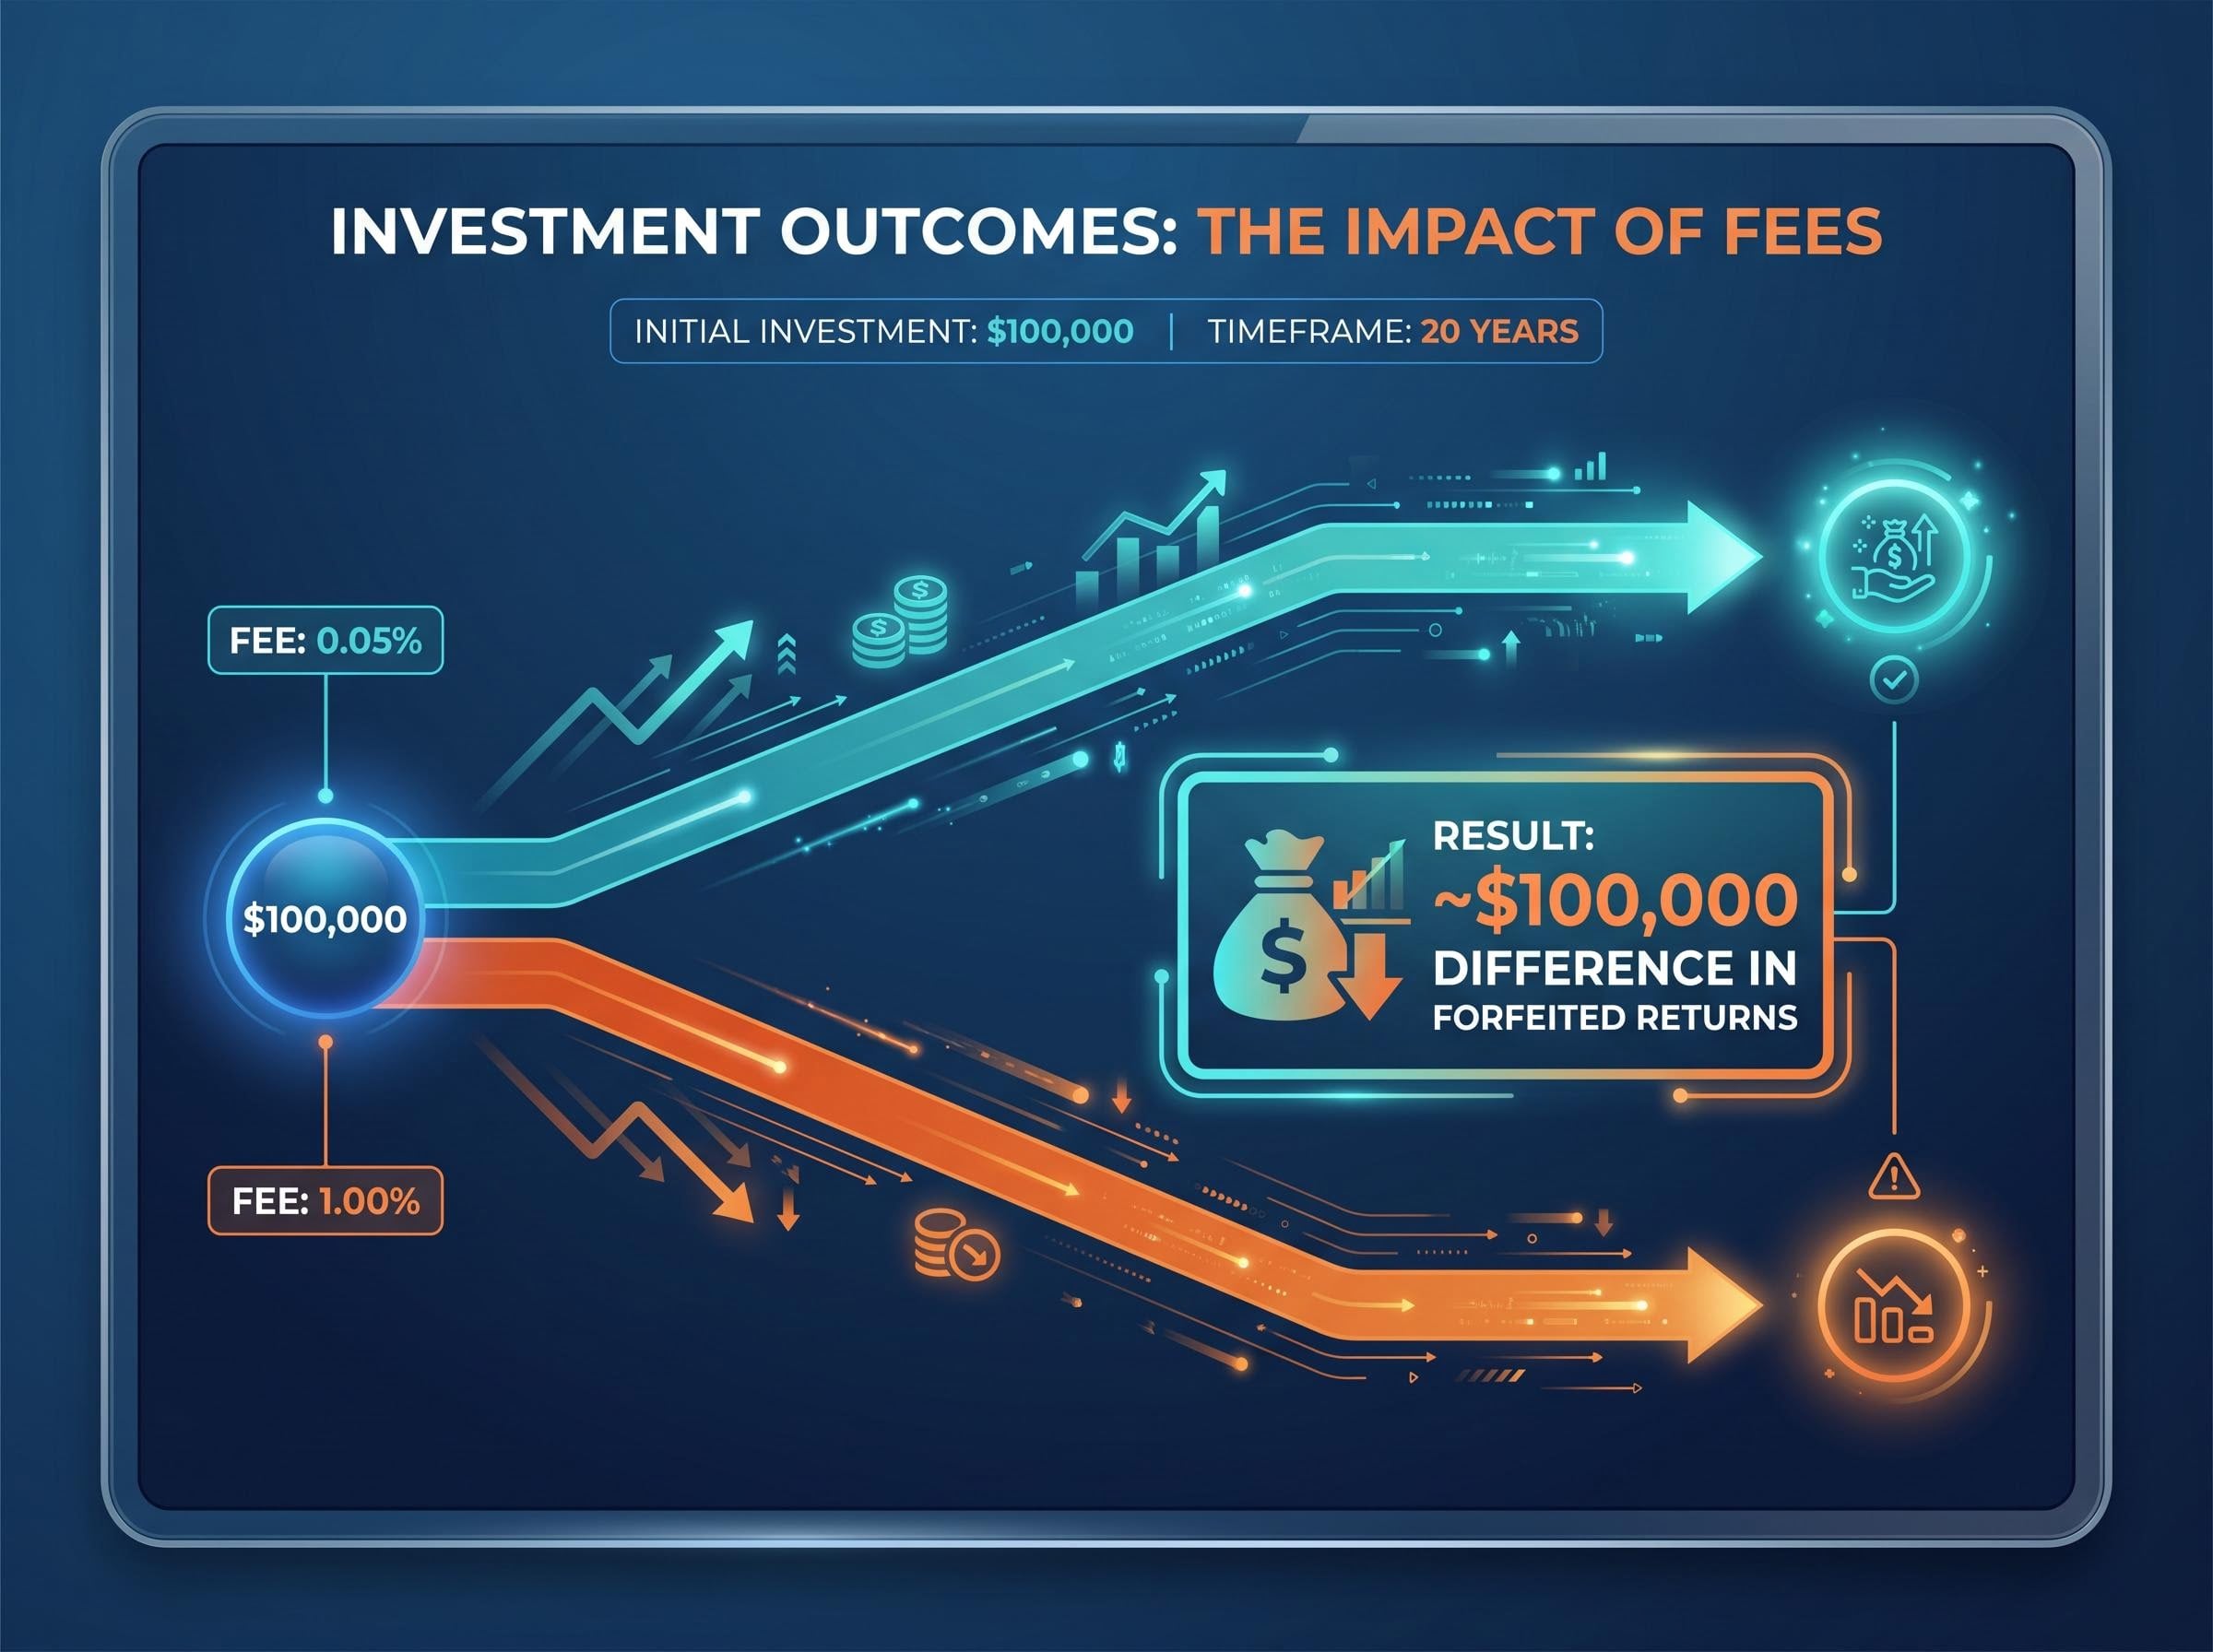
A $100,000 investment in two seemingly identical Australian equity exchange-traded funds, one charging 0.05% and one charging 1.00%, can produce a difference of roughly $100,000 in portfolio value over 20 years. The funds may share the same index, the same holdings, and the same market return. The only variable affecting the final balance is the management fee.
Australia’s market reached an all-time high of $330.6 billion in funds under management at the end of 2025. There are now more than 330 products listed across the ASX and Cboe, capturing record inflows from retail and institutional participants. That breadth provides investors with significant optionality, but it also creates a complex selection problem. Most beginners understand the general benefit of passive investing, yet far fewer know exactly how to evaluate an option beyond its ticker symbol and a rough description of what it tracks.
Learning how to choose an ETF requires looking past marketing labels. This framework outlines the fundamental factors that separate a well-chosen allocation from a costly mistake. It covers how to decode underlying holdings, compare fees for long-term compounding, manage tax obligations from reinvested distributions, and conduct structured due diligence before committing capital.
The Australian ETF market has grown to 2.69 million investors and $330.6 billion in funds under management, a scale that reflects both the accessibility of these instruments and the degree to which retail participants have shifted away from actively managed alternatives since 2020.
No regulation governs how fund providers name their products, meaning two funds with similar labels can hold materially different assets. Surface-level marketing often obscures the true economic exposure of the underlying portfolio. Reviewing actual holdings, particularly the top 10 to 25 positions, is a necessary step before purchase.
Within the ASX 200, Commonwealth Bank of Australia (CBA) and BHP Group (BHP) together represent a significant concentration of the index. When investors buy a broad market Australian fund, they take significant concentrated positions in the banking and mining sectors.
Global funds present similar concentration issues that are often masked by broad geographic naming conventions. Some global funds allocate a significant portion of their holdings to US-listed equities, with high concentration in US technology shares. Understanding exactly what sits inside a fund prevents costly duplication and avoids surprise concentration risk when markets move. This is particularly material for Australian investors who already hold significant domestic assets through superannuation and property.
Answer these three questions before executing a trade:
What specific individual securities does the fund own? How is the underlying index weighted? * How does the provider replicate the index return?
Market-capitalisation weighting allocates capital based on company size, compounding concentration in dominant names like CBA and BHP. As a company’s share price grows, the fund must mechanically buy more of it to maintain the index weight. This structure naturally trends toward momentum investing.
Equal-weighted structures offer an alternative approach to concentration risk. The VanEck Australian Equal Weight ETF (MVW) assigns an identical weighting to each constituent, contrasting sharply with cap-weighted peers. This structure distributes capital uniformly across all companies and reduces single-stock dominance.
Physical replication means the fund directly purchases and holds the actual securities that make up the index. This is the most straightforward structure and carries minimal counterparty risk for the end investor.
Synthetic replication achieves exposure via derivatives or swap agreements with financial institutions rather than holding the underlying shares. These synthetic structures carry counterparty risk, which is why the Australian Securities and Investments Commission (ASIC) requires enhanced risk warnings for these products. All publicly listed funds must disclose constituent holdings and replication methods, accessible via fund manager websites and third-party research platforms.
A management expense ratio might look like a negligible decimal, but it operates as a constant negative compounder on portfolio returns. The difference between a 0.05% and a 1.00% fee is not simply 0.95 percentage points of annual drag. Compounded over multiple decades, that small percentage gap forfeits a dramatically larger sum of capital.
Research from Morningstar demonstrates that lower-cost funds show significantly higher rates of investment success when grouped by expense quartile. The ASX average expense ratio sits at approximately 0.54%, meaning investors selecting the cheapest broad-market options pay roughly one-tenth of the market average. Fee selection is one of the few performance levers entirely within an investor’s control.
| ETF Ticker | Index Tracked | MER (p.a.) | Category |
|---|---|---|---|
| A200 | Solactive Australia 200 | 0.04% | Cap-weighted broad market |
| IOZ | S&P/ASX 200 | 0.05% | Cap-weighted broad market |
| VAS | S&P/ASX 300 | 0.07% | Cap-weighted broad market |
| MVW | MVIS Australia Equal Weight | 0.35% | Equal-weighted smart beta |
“The difference between a 0.05% and a 1.00% fee on $100,000 over 20 years is approximately $100,000 in forfeited returns.”
Total cost of ownership extends beyond the headline ratio printed on the fund documentation. Tracking difference, which measures the actual performance gap between the fund and its index net of all costs, provides a more complete picture of managerial efficiency. A fund with a low headline fee but poor execution may experience a negative tracking difference that outweighs the initial fee savings.
Tracking difference, which measures the actual performance gap between a fund and its benchmark net of all costs, often diverges meaningfully from the headline MER because execution quality, securities lending income, and index replication timing all contribute to the real-world cost of ownership.
Bid-ask spreads and brokerage commissions also add to the total cost, particularly for market participants who trade frequently or average into positions monthly. Less liquid products or complex thematic funds can feature wider spreads, up to 0.20% or more in execution costs. A decision made once at purchase can compound silently for decades, either in favour of the investor or against them.
Electing a distribution reinvestment plan does not avoid or defer tax obligations. The Australian Taxation Office (ATO) treats the investor as having received a cash distribution and then immediately purchased additional units. The full distribution remains assessable income in the year it is derived, regardless of whether cash ever enters a bank account.
This tax drag can leave unplanned investors with a cash shortfall at year end. Those fully enrolled in reinvestment plans who hold no cash buffer may be forced to sell units simply to cover their tax liability. Understanding this dynamic in advance allows investors to set aside adequate cash and claim every offset they are legally entitled to.
The ATO rule states that distributions are taxable in the year an investor is “presently entitled” to them. Each reinvestment creates a new capital gains tax asset with its own specific acquisition date and base price.
The ATO dividend reinvestment plan rules confirm that these automated unit allocations carry the exact same assessable income status as cash payouts, making accurate cost base records essential for ongoing compliance.
This dynamic produces many small parcels over time that require careful, ongoing record-keeping. Brokerage confirmations alone are insufficient for accurate tax reporting, making the Annual AMIT Member Statement the primary document for compliance.
Funds structured as Attribution Managed Investment Trusts can attribute capital gains to investors even in years where no cash distribution is paid. This attribution often surprises reinvestment participants who assumed no taxable event had occurred.
Understanding the specific disclosures in an AMMA statement is a fundamental requirement:
AMIT attribution events carry additional complexity from 1 July 2027 under Australia’s revised CGT framework, where the 50% discount is replaced by inflation indexation and a 30% minimum tax floor, making the tax cost of unnecessary realisation events materially higher than under current rules.
Franked and unfranked distribution components Capital gains components (discounted and non-discounted) Foreign income amounts Non-assessable amounts that adjust the cost base
For global funds, Foreign Income Tax Offsets must be claimed exactly as shown on the statement to avoid double taxation. The annual tax process generally follows four distinct steps:
Portfolio tracking software capable of handling multiple small parcels simplifies this administrative burden. For complex global holdings, professional tax advice ensures compliance and proper offset utilisation.
With $330.6 billion in funds under management at the end of 2025 and 71 new products launched in 2025 alone, the product universe is expanding rapidly. A structured checklist prevents common selection errors, such as buying based on name alone or ignoring tracking difference in favour of a headline fee. Defining the intended portfolio role, whether core or satellite, should come before any product comparison begins.
Independent commentators generally favour large, established providers for core portfolio holdings. Vanguard, iShares, Betashares, VanEck, and Global X offer the scale required to maintain tight spreads and minimise closure risk. For large orders or less-liquid products, contacting the broker or issuer directly for execution support is standard practice among institutional and sophisticated retail investors.
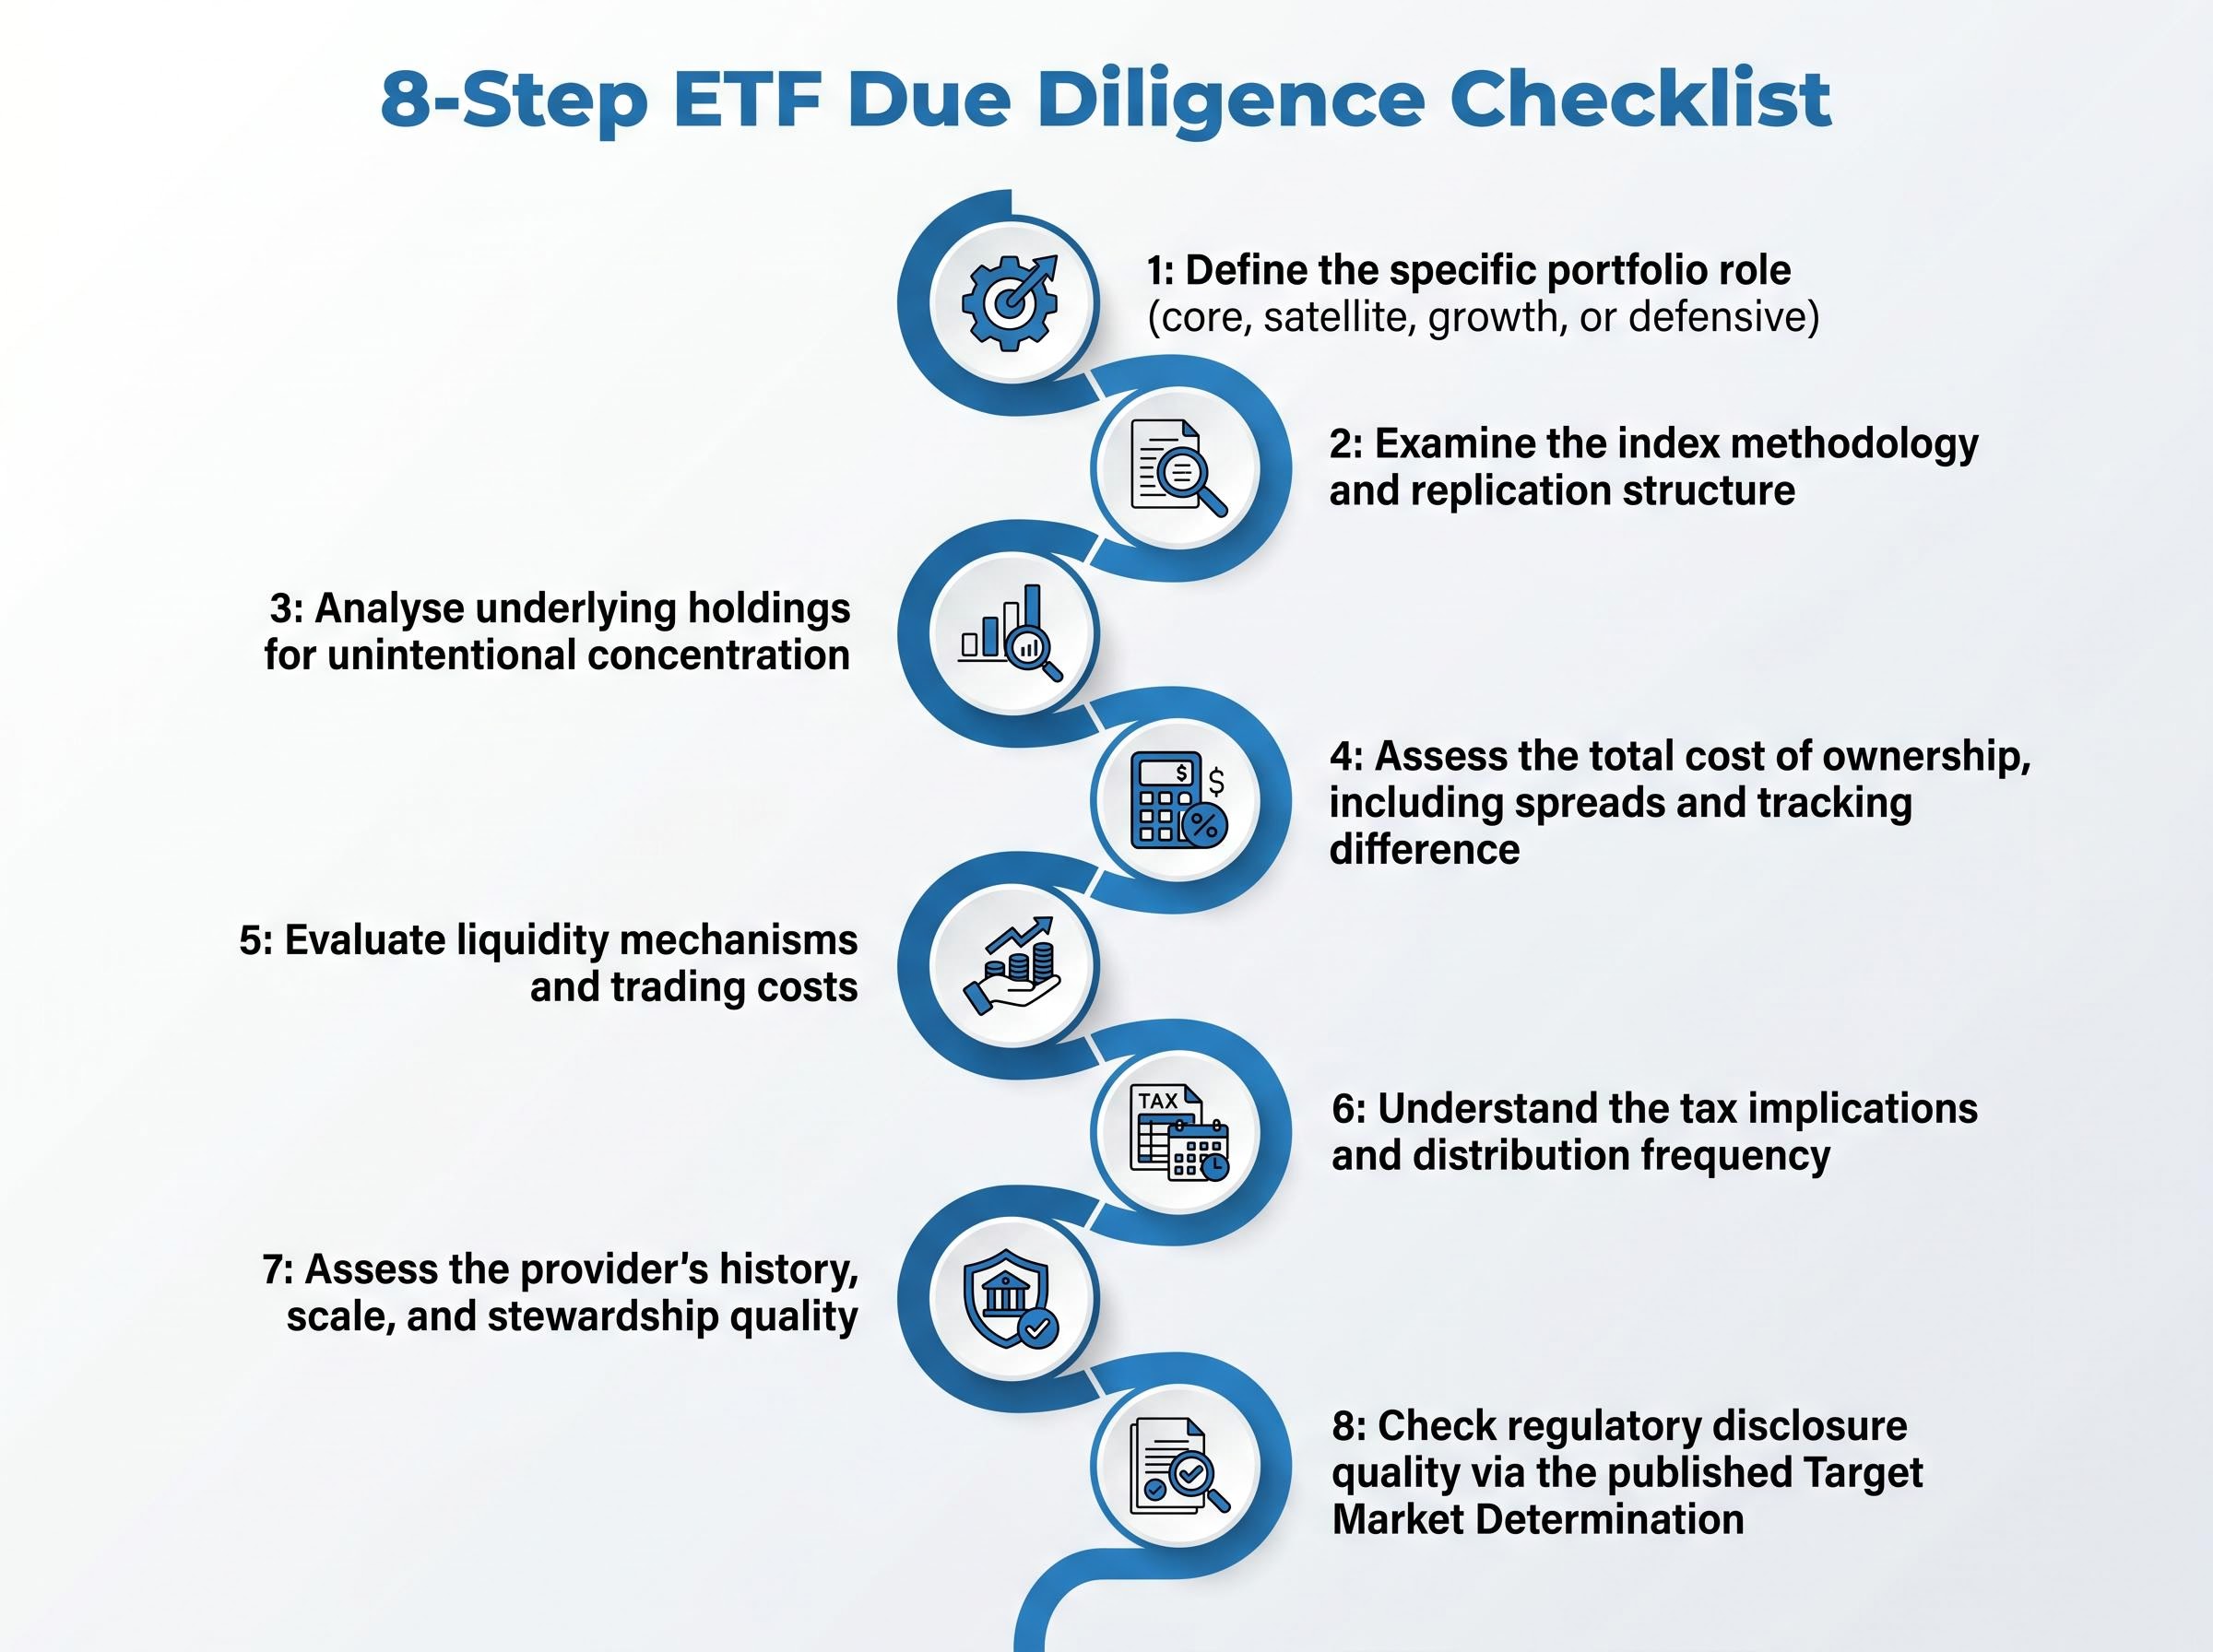
ASIC ongoing enforcement also requires issuers to publish Target Market Determinations, allowing investors to verify if a product matches their specific risk profile. Apply this eight-step due diligence checklist before allocating capital:
The ASIC design and distribution obligations mandate that fund providers maintain clear consumer alignment metrics, ensuring retail participants have a standardized way to evaluate whether a complex thematic or leveraged product actually suits their financial situation.
On-screen daily trading volume often understates true liquidity for funds holding large-cap underlying securities. A fund’s true liquidity is determined by the liquidity of the underlying shares it holds, not just the volume of units traded on the exchange.
Market makers provide liquidity by creating and redeeming units based on underlying asset availability. Always use limit orders rather than market orders to avoid poor execution. Avoid trading during the opening and closing minutes of the session, as this is when spreads typically widen.
Asset allocation, the proportional weighting across different asset classes, has a greater impact on long-term outcomes than the specific fund chosen within each class. Selecting products before defining an allocation strategy often leads to overlapping exposures or unintentional concentration. Establishing the allocation target first makes every subsequent selection decision more purposeful.
Australian investors often hold significant domestic exposure through their superannuation, employment, and property. Tilting a portfolio toward international equities can provide genuine diversification away from domestic banking and mining sectors. If an investor must restructure later due to poor planning, it often triggers a costly tax event.
“Asset allocation is considered more critical than the specific ETFs chosen within each asset class.”
An illustrative aggressive allocation might target 90% growth assets and 10% defensive assets, with international shares at approximately 60% and Australian shares at 30%.
Passive options captured approximately 74% of total net flows in Australia in 2025, compared to 16% for smart-beta and 11% for active strategies.
Consider these three practical allocation approaches:
Investing in a single diversified multi-asset product to automate rebalancing. Replicating professional multi-asset manager allocations using low-cost index funds. * Applying capital market assumption models from major institutional providers.
A traditional three-fund framework often includes:
Fixed income ETFs added as a defensive allocation within a three-fund structure provide capital preservation characteristics that behave differently from equities across market cycles, with bond ETF returns driven by coupon income and duration sensitivity rather than earnings growth or dividend franking.
International equities for global growth exposure. Domestic equities for franked dividend income. * Fixed income for defensive capital preservation, weighted according to individual goals.
Define the high-level asset allocation first, then evaluate options within each bucket using a structured fee, tax, and due diligence framework. Differences between comparable broad-market funds within the same category are often marginal. The cost of analysis paralysis, remaining uninvested while searching for a flawless product, generally exceeds the cost of choosing the second-best option in a low-fee category.
Periodic portfolio review is far more effective than frequent trading. While allocations may require adjustment over long investment horizons, unnecessary turnover triggers capital gains events that erode compound returns.
Download the relevant Product Disclosure Statement for any fund under consideration. Cross-check the Target Market Determination against an investor profile, and use an online fee calculator to model the long-term cost difference between shortlisted options before committing capital.
Disclaimer: This article is for informational purposes only and should not be considered financial advice. Investors should conduct their own research and consult with financial professionals before making investment decisions. Past performance does not guarantee future results. Financial projections are subject to market conditions and various risk factors.
A management expense ratio (MER) is the annual fee charged by an ETF provider, expressed as a percentage of funds under management. Even a small difference, such as 0.05% versus 1.00%, can result in approximately $100,000 of forfeited returns on a $100,000 investment over 20 years due to compounding.
Review the top 10 to 25 individual positions disclosed by the fund provider, check the index weighting methodology (cap-weighted versus equal-weighted), and confirm whether the fund uses physical or synthetic replication. This prevents unintentional concentration risk and costly duplication across your portfolio.
Yes. The Australian Taxation Office treats reinvested distributions as assessable income in the year they are derived, even if no cash enters your bank account. Each reinvested parcel also creates a new capital gains tax asset with its own acquisition date and cost base, requiring careful record-keeping.
Tracking difference measures the actual performance gap between an ETF and its benchmark index after all real-world costs, including execution quality, securities lending income, and replication timing. A fund with a low headline MER can still deliver a negative tracking difference that outweighs its apparent fee advantage.
Asset allocation across different asset classes has a greater impact on long-term outcomes than the specific fund chosen within each class. Australian investors should account for existing domestic exposure through superannuation and property, and consider tilting toward international equities for genuine diversification away from banking and mining concentration.