Why a Rising AUD Is Quietly Eroding Your International ETF Returns
12 hrs ago
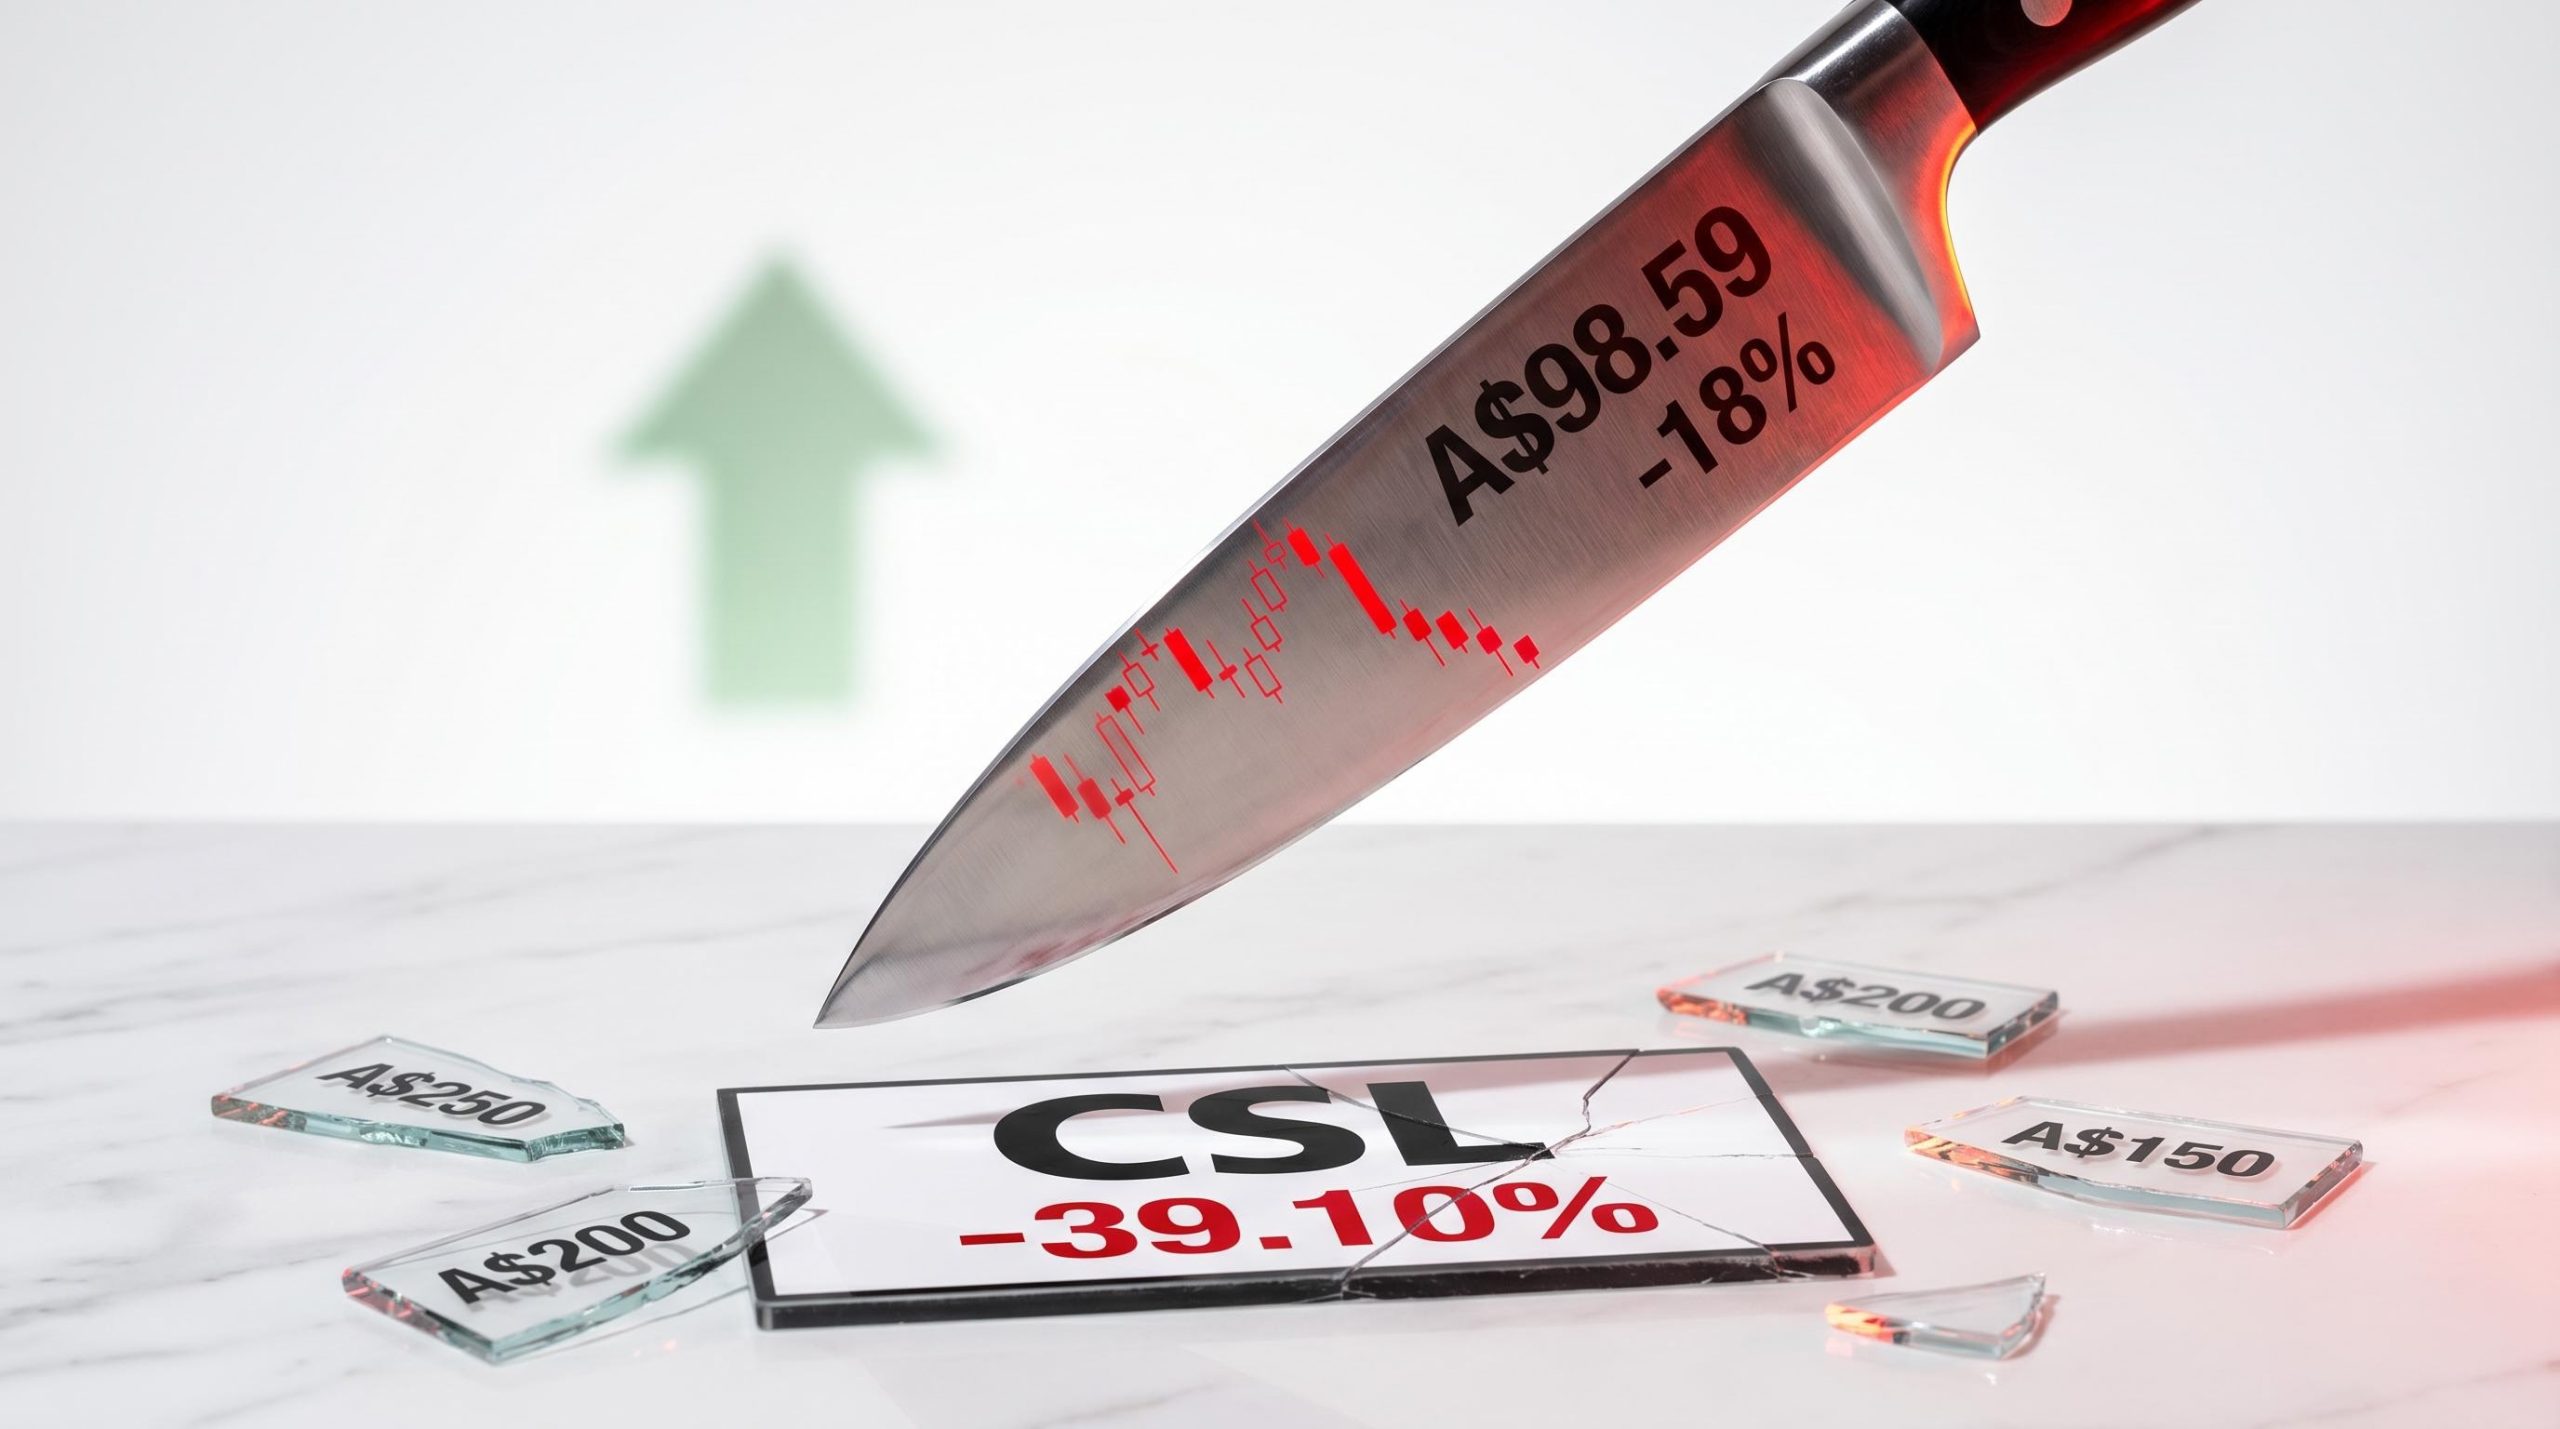
On 13 May 2026, CSL shares crashed 18% in a single session to A$98.59, a nine-and-a-half-year low. The trigger: a profit guidance cut and a A$5 billion impairment charge. Within hours, retail investor forums were filled with posts about “buying the dip” on what was once Australia’s premier quality compounder.
CSL had fallen from approximately A$300 in 2024 to below A$100, a drawdown of roughly two-thirds. Each successive new low along the way had looked like a bargain. Most retail investors who acted on that instinct are now sitting on compounding losses. The pattern of catching a falling knife has a well-documented behavioural explanation and a set of technical disciplines that exist precisely to prevent it.
This article explains what the falling knife pattern actually means, why blue-chip reputation makes investors more vulnerable to the trap rather than less, and what specific signals to wait for before considering any entry into a stock in a sustained downtrend. CSL serves as the live case study throughout.
The metaphor is visceral for a reason. A knife in freefall has no handle to grab. Catching a falling knife in investing describes buying a stock in a sustained downtrend under the assumption that the decline has gone far enough, without any evidence that the descent has actually stopped.
CSL makes the pattern legible because every stage is documented and recent:
The “bargain” framing was available at every interval. Investors who bought at A$250, A$200, A$150, and A$120 all had a rational-sounding narrative for doing so. Each was wrong. The 12-month price decline now stands at 39.10%, and CSL was the single largest drag on the ASX 200 on the day of the crash.
Alex Pikoulas, CEO of Munjarra Capital, summarised the scale of the damage on SBS Finance: “Shares were worth around 300 bucks back in 2024. They’re now below 100.”
Understanding the phrase as a pattern, not just a metaphor, gives investors a framework to recognise when they are in the middle of one in real time rather than in retrospect.
A stock becoming cheaper and a business becoming worse are two different things. A temporary price dislocation, where sentiment has oversold an otherwise healthy business, can create genuine opportunity. Fundamental deterioration, where the price is tracking real damage to earnings, assets, and competitive position, creates a trap. The distinction determines everything.
CSL’s financials confirm the second category.
| Metric | Expected / Prior Period | Actual / Current Period | Change |
|---|---|---|---|
| Earnings per share | A$3.98 (estimate) | A$3.57 (actual) | -10.15% miss |
| Net income | A$3.04 billion (prior half) | A$1.57 billion (current half) | -48.34% decline |
| Impairment charge | N/A | A$5 billion | Announced 13 May 2026 |
Net income nearly halved in a single reporting period. The A$5 billion write-down suggests that acquired businesses or assets have not delivered expected value, a signal of potential permanent capital impairment rather than a cyclical blip.
This is what “double compression” looks like in practice: both earnings fall and the price-to-earnings multiple contracts simultaneously. The stock is not simply cheap relative to its history. The market is re-rating it on structurally lower expectations.
Alex Pikoulas, CEO of Munjarra Capital, put it directly: “This is no longer the same company with the same outlook that everyone fell in love with some years ago.”
According to Market Index (22 April 2026), “Since mid-2024, CSL has shed over two-thirds of its value through a sequence of earnings misses, guidance downgrades, and competitive headwinds.” The framing was explicitly that CSL may represent a fundamental breakdown of the investment thesis, not a temporary setback.
Investors who skip this analysis and buy on price alone are not value investing. They are speculating on a recovery without verifying whether the conditions for recovery exist.
The distinction between temporary dislocation and fundamental deterioration is only visible through the numbers: the five core fundamental analysis metrics, including earnings per share trajectory, revenue growth rate, profit margins, return on equity, and price-to-earnings ratio in the context of peer comparisons, each answer a different question about whether a cheaper stock is genuinely undervalued or still expensive on deteriorating fundamentals.
The assumption that buying a high-quality, well-known company is inherently safer than buying an obscure small-cap is precisely what makes the falling knife trap most dangerous. Familiarity and reputation are the specific psychological ingredients that lower an investor’s guard.
Four behavioural biases operate simultaneously in situations like CSL’s decline:
Prospect theory research confirms that losses feel approximately twice as painful as equivalent gains, which is why cognitive biases in a falling market compound on each other: anchoring to a prior peak price activates first, then loss aversion intensifies the urge to average down, and confirmation bias filters out the bearish data accumulating in plain sight.
As Motley Fool Australia noted on 22 April 2026, CSL “can’t find a floor.” The stock was briefly Australia’s largest listed company in 2020. That historical status made each new low feel like an anomaly rather than a trend, which is the halo effect at work.
CSL is not the first name to carry this pattern on the ASX.
AMP was once a top-tier financial blue chip with strong brand recognition and a loyal dividend investor base. After misconduct revelations at the 2018 Royal Commission and sustained strategy failures, shares drifted from the A$5-6 range in the mid-2010s toward A$1-2. Retail investors who averaged down endured years of compounding losses.
Telstra was long considered a “safe, defensive” blue chip. Shares peaked above A$9 in the early 2000s, then endured a multi-year slide into the A$2-3 zone as NBN rollout and competition eroded profitability. Investors buying each successive new low on a “surely it must bounce” thesis endured a lost decade of capital returns.
Both were described as safe blue chips by financial media in the years before their sustained declines, mirroring the CSL narrative almost exactly.
Analysis of what has already happened to CSL is useful; a framework for what to watch going forward is actionable. Australian technical analysts, including Carl Capolingua of Market Index’s ChartWatch, emphasise a set of observable chart conditions that can help investors assess whether a downtrend has genuinely ended before committing capital.
Practical rule of thumb: Don’t buy while price is below a falling 200-day moving average and making lower lows. Instead, wait for: a clear base or sideways consolidation range; a higher low followed by a higher high; price reclaiming the 200DMA with improving volume; and sustained relative strength improvement versus the ASX 200.
These six signals do not predict the bottom. They confirm when the balance of evidence has shifted away from an ongoing downtrend. The cost of waiting for confirmation is missing the first 10-20% of a recovery. The cost of not waiting can be another 30-50% of further loss. Even at a beta of 0.80 and 20.12% annualised volatility, a 66%+ drawdown remains possible when the trend is against you.
A lower price is not an argument for purchase without a corresponding positive change in fundamentals or trend. A legitimate value thesis requires three specific components:
What most dip-buyers actually rely on is quite different:
A stock can be statistically cheap, showing a low price-to-earnings ratio or high dividend yield, and still be in a downtrend because the market is pricing in further deterioration. The apparent cheapness becomes a trap rather than an opportunity.
General Electric fell from above US$30 in mid-2016 to below US$7 by late 2018, driven by excessive leverage and accounting concerns. At multiple points during the decline, the stock appeared statistically cheap. Each time, further deterioration proved the apparent value illusory.
Credit Suisse traded above CHF 20 pre-GFC, declined for over a decade through a series of risk management failures, and was ultimately acquired by UBS in 2023 at approximately CHF 0.76 per share. A globally recognised, systemically important bank effectively went to near-zero for equity holders.
Both demonstrate that brand recognition and historical status provide no floor for equity value when the business behind the price is broken.
This article is for informational purposes only and should not be considered financial advice. Investors should conduct their own research and consult with financial professionals before making investment decisions.
The technical and fundamental analysis above collapses into a single, actionable entry checklist. Before committing capital to CSL or any stock in a sustained downtrend, wait for all four conditions:
As of 14 May 2026, CSL trades at approximately A$99.19, below a declining 200DMA, in a multi-year downtrend, with no confirmed base structure. None of these four conditions are met.
Alex Pikoulas of Munjarra Capital noted on 13 May 2026: “A lot has changed here. And I think in particular the competitive environment that they’re facing.”
Volatility context reinforces the asymmetry. At 20.12% annualised volatility, a further 20-30% decline from current levels is well within the statistical range of outcomes if the trend does not reverse.
Waiting for confirmation is not pessimism. It is asymmetric risk management. The downside of buying too early into a continuing decline is far larger than the upside missed by not catching the exact bottom.
The capital destroyed in a falling knife is gone. So is the opportunity cost. While CSL was collapsing through May 2026, the ASX mining sector was showing rising momentum, a reminder that capital deployed into a declining stock is capital unavailable for sectors with improving trends.
CSL’s status as the biggest ASX 200 drag on 13 May 2026 illustrates how a single deteriorating position can weigh on an entire portfolio’s performance. The investors who averaged down across AMP’s multi-year slide from A$5-6 to A$1-2, or who kept buying Telstra through its decade-long decline from above A$9, did not just lose capital. They lost years of compounding that capital could have delivered elsewhere.
The financial damage from acting on these instincts is not abstract: reactive trading costs for Australian investors include forfeited CGT discounts on positions sold within 12 months, transaction fees on each averaging-down purchase, and the structural timing penalty from missing the handful of sessions that drive the bulk of annual recovery returns.
Getting this wrong does not make someone a bad investor. It makes them a normal human responding to powerful, well-documented cognitive biases. The discipline is in building external rules, such as the six-signal checklist and the four-stage entry framework above, that override the instinct when it matters most.
A falling price is a signal to investigate, not an instruction to buy. A stock’s prior reputation is a description of its past, not a guarantee of its future. Price alone tells nothing about value without knowing whether the business behind it is intact.
None of the above closes the door on CSL as a future investment. It closes the door on uninformed dip-buying and opens it on disciplined, evidence-based entry when and if conditions align.
The three-part discipline this article has established is transferable to any stock in a sustained downtrend. First, assess whether fundamentals are deteriorating or recovering, using earnings trajectory, impairments, and competitive positioning as the evidence base. Second, apply the six-signal technical checklist before acting, requiring confirmation from moving averages, trend structure, volume, support levels, momentum divergence, and relative strength. Third, replace the “it’s a great company at a discount” heuristic with a verifiable entry framework tied to observable conditions.
The practical next step for Australian investors is straightforward: add CSL, or any stock under scrutiny, to a watchlist with specific trigger conditions attached. Do not set a price target as if the bottom can be predicted. Set conditions: earnings stabilisation, base formation, 200DMA reclamation, and sustained relative strength. When those conditions are met, the opportunity begins. Until then, the knife is still falling.
For readers who want to operationalise the entry framework described above before the next opportunity arises, our full explainer on pre-built watchlist discipline covers how to build a stock list with pre-calculated intrinsic value estimates and margin of safety thresholds so that when a stock’s technical conditions finally align, a buy decision can be executed without the emotional pressure of having to analyse under duress.
Past performance does not guarantee future results. Financial projections are subject to market conditions and various risk factors.
—
Catching a falling knife describes buying a stock in a sustained downtrend on the assumption the decline has gone far enough, without any technical or fundamental evidence that the descent has actually stopped. Investors who buy at each successive new low often compound their losses rather than securing a bargain.
Key signals of a genuine downtrend include price trading below a falling 200-day moving average, a continued pattern of lower highs and lower lows on weekly charts, and the stock underperforming its broader index. Fundamental deterioration such as declining earnings, guidance cuts, and large impairment charges confirms the trend is not simply sentiment-driven.
Analysts recommend waiting for at least four conditions: price reclaiming a flattening or rising 200-day moving average, a base formation showing higher lows and a higher high, an improvement in volume patterns consistent with institutional accumulation, and sustained relative strength versus the ASX 200 over several weeks.
Blue-chip reputation creates psychological biases including anchoring to prior peak prices, the halo effect from years of positive media coverage, and representativeness bias that assumes past quality guarantees future recovery. These biases lower an investor's guard precisely when disciplined caution is most needed.
A genuine value opportunity requires evidence that problems are temporary, a credible path to earnings recovery, and improving technical conditions. A value trap occurs when a stock appears statistically cheap on price-to-earnings or dividend yield metrics but the market is pricing in further fundamental deterioration, making the apparent cheapness misleading.