How to Manage AI Stock Concentration Risk in Your Portfolio
2 hrs ago
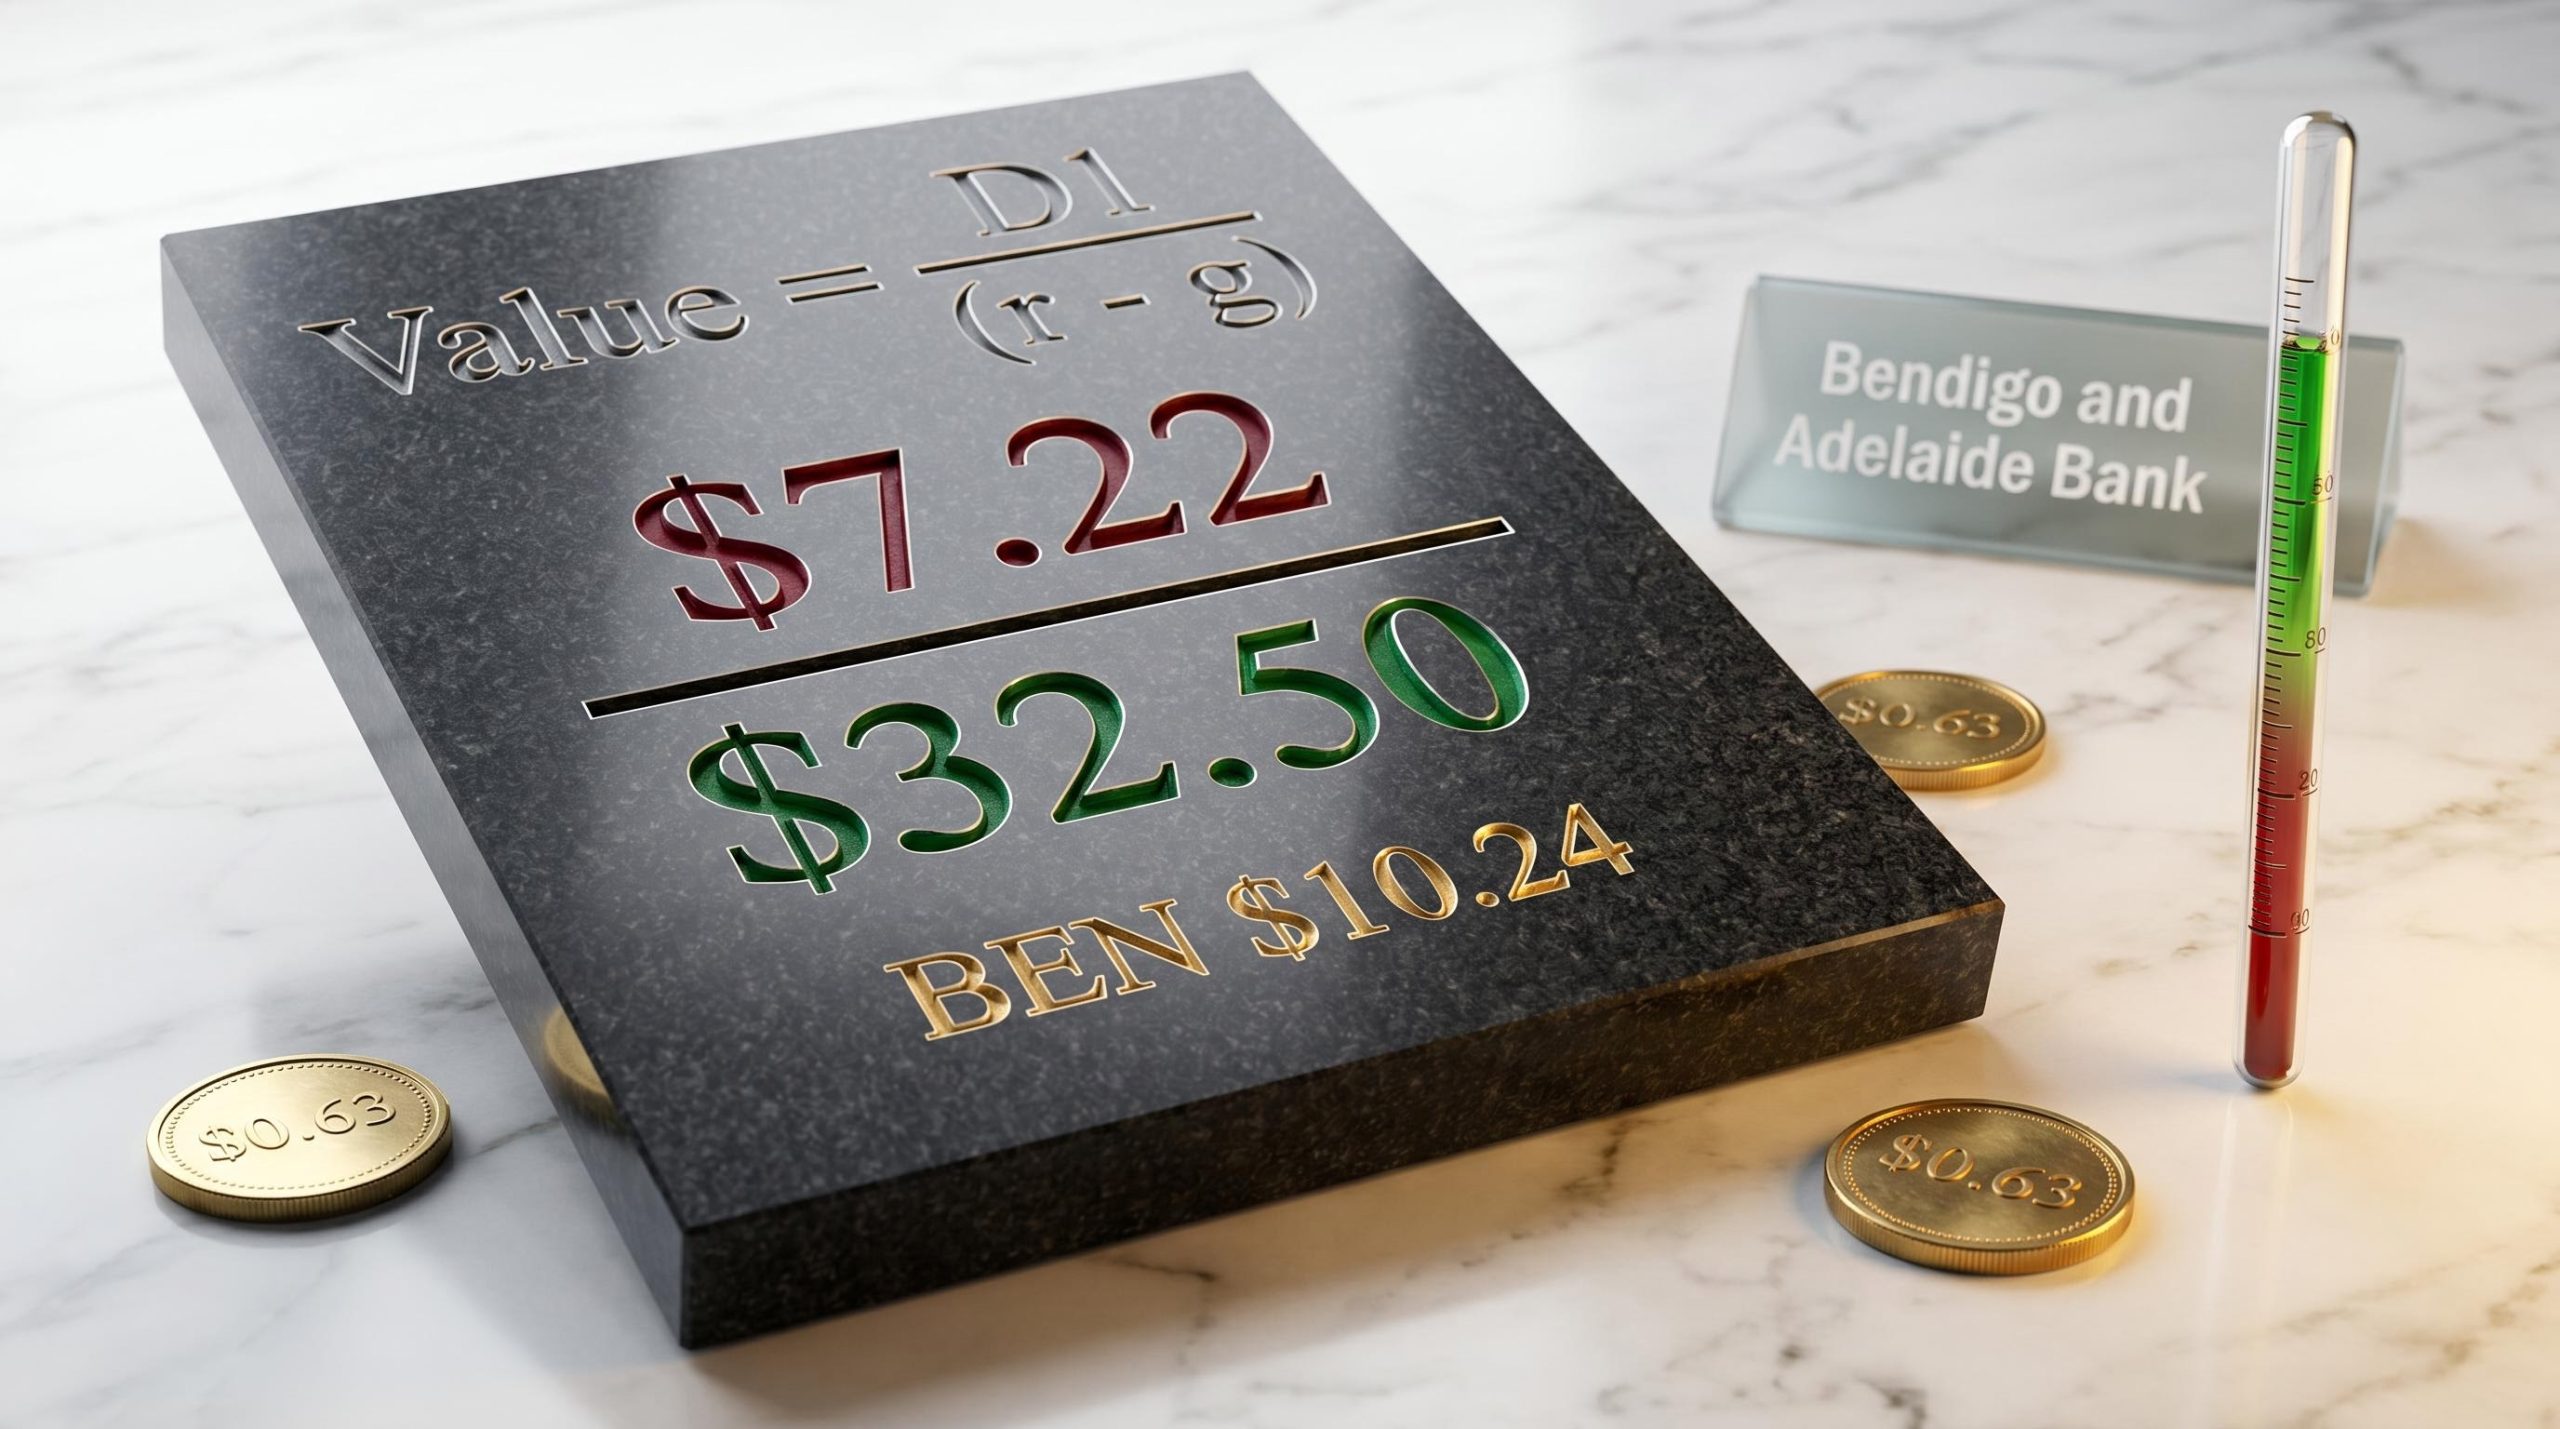
The same dividend, fed into the same formula, can produce a valuation of $7.22 or $32.50. That is not a mistake. That is the Dividend Discount Model doing exactly what it was designed to do.
For Australian investors assessing ASX bank shares, the DDM is one of the most commonly referenced valuation tools precisely because banks pay predictable, recurring dividends. The model is only as reliable as the assumptions behind it. With Bendigo and Adelaide Bank (ASX: BEN) trading at $10.24 and its FY2025 dividend sitting at $0.63 per share, there is a real, live worked example worth walking through in full.
What follows explains how the Dividend Discount Model works, how to apply it step by step to BEN shares using current data, how franking credits change the output for Australian investors, and why the resulting range of valuations is more informative than any single-point estimate.
Australian banks are relatively stable businesses that pay dividends regularly. Capital returns via dividends represent a major component of total shareholder return for the sector, which makes the dividend stream a reasonable proxy for value. According to Rask Media, DDM remains one of the more practical approaches for valuing ASX bank shares within Australian retail investment writing.
The reason Australian banks appear so frequently in dividend valuation exercises is structural: among the ASX sectors suited to DDM, banks and utilities share regulatory constraints and payout conventions that produce the predictable income streams the model requires to function reliably.
That said, the model strains where business-level fundamentals leave limited buffer. Mid-tier banks like BEN are generally considered less DDM-friendly than the major banks because earnings and payout stability are typically weaker, making the growth assumption more fragile and the sensitivity range wider.
BEN’s current financial profile illustrates why:
Lending income accounts for approximately 87% of BEN’s total income. That concentration means the dividend outlook depends heavily on maintaining credit quality and avoiding further margin compression. The model will produce wide outputs for a bank with this profile, and understanding why is the first step toward interpreting those outputs correctly.
The DDM compresses a stock’s value into a single formula. It estimates what a share is worth based on the dividends it is expected to pay, adjusted for the return an investor requires and the rate at which those dividends are expected to grow.
DDM Formula: Value = D1 / (r – g)
Three inputs drive the entire output:
Australian retail DDM writing commonly uses a discount rate range of approximately 6% to 11%, depending on the risk profile of the company and the prevailing market environment.
BEN declared a total dividend of $0.63 per share for FY2025. A forward-looking DDM should use the dividend expected in the next period rather than the most recent declared figure. For this worked example, the forecast dividend (D1) is set at $0.65 per share, reflecting a modest assumed increase from the declared payout.
This introduces an additional assumption layer. Readers should note that the choice of D1 is itself a judgement call: using the declared $0.63 versus the forecast $0.65 will shift every output in the model. The sections that follow use both figures depending on the calculation.
Start with the base case. Using a forecast dividend of $0.65, a discount rate of 8.5% (the midpoint of the 8%-9% base-case range), and a growth rate of 2.5% (midpoint of the 2%-3% base-case range):
Value = $0.65 / (0.085 – 0.025) = $0.65 / 0.06 = $10.83
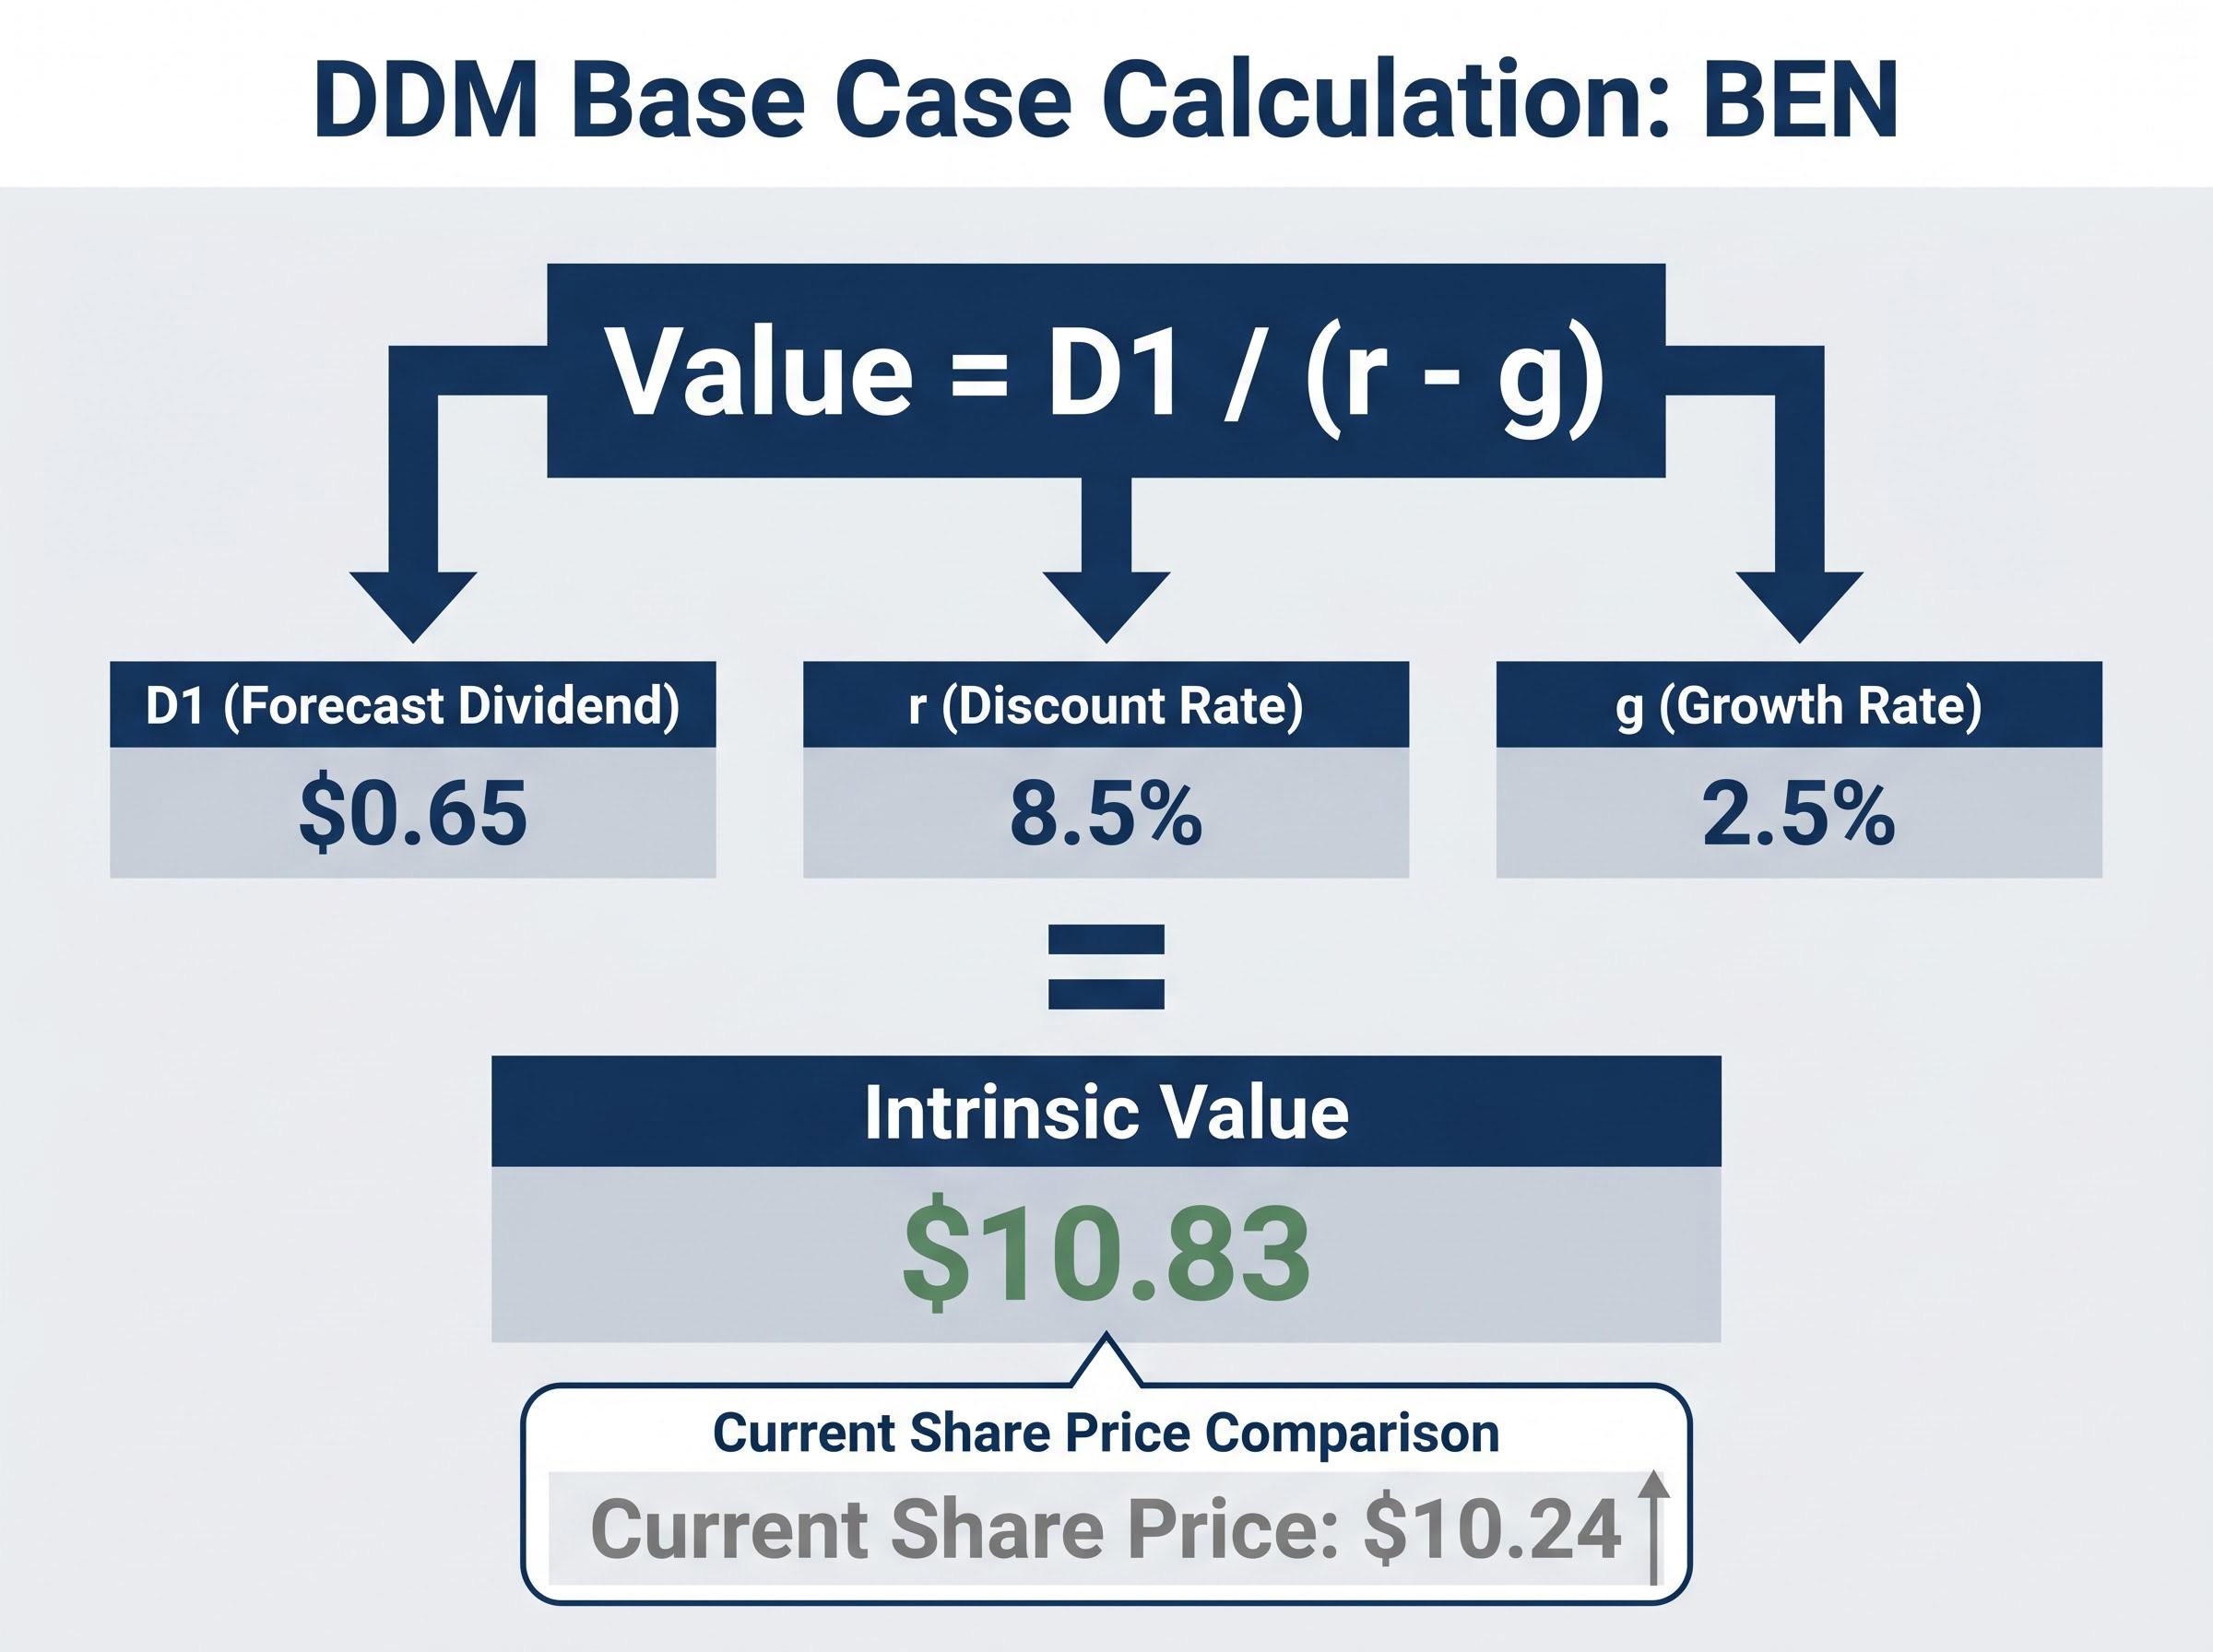
Against BEN’s current share price of $10.24, the base-case output suggests the stock is trading roughly in line with the model’s estimate under moderate assumptions. The margin is narrow.
Now widen the lens. Adjusting the discount rate and growth rate across three scenarios produces a materially different picture:
| Scenario | Discount Rate (r) | Growth Rate (g) | Intrinsic Value |
|---|---|---|---|
| Bull case | 6.5% | 3.5% | $21.67 |
| Base case | 8.5% | 2.5% | $10.83 |
| Bear case | 10.5% | 2.0% | $7.65 |
The full DDM matrix, using the declared $0.63 dividend across discount rates of 6%-11% and growth rates of 2%-4%, produces a range of $7.22 to $32.50.
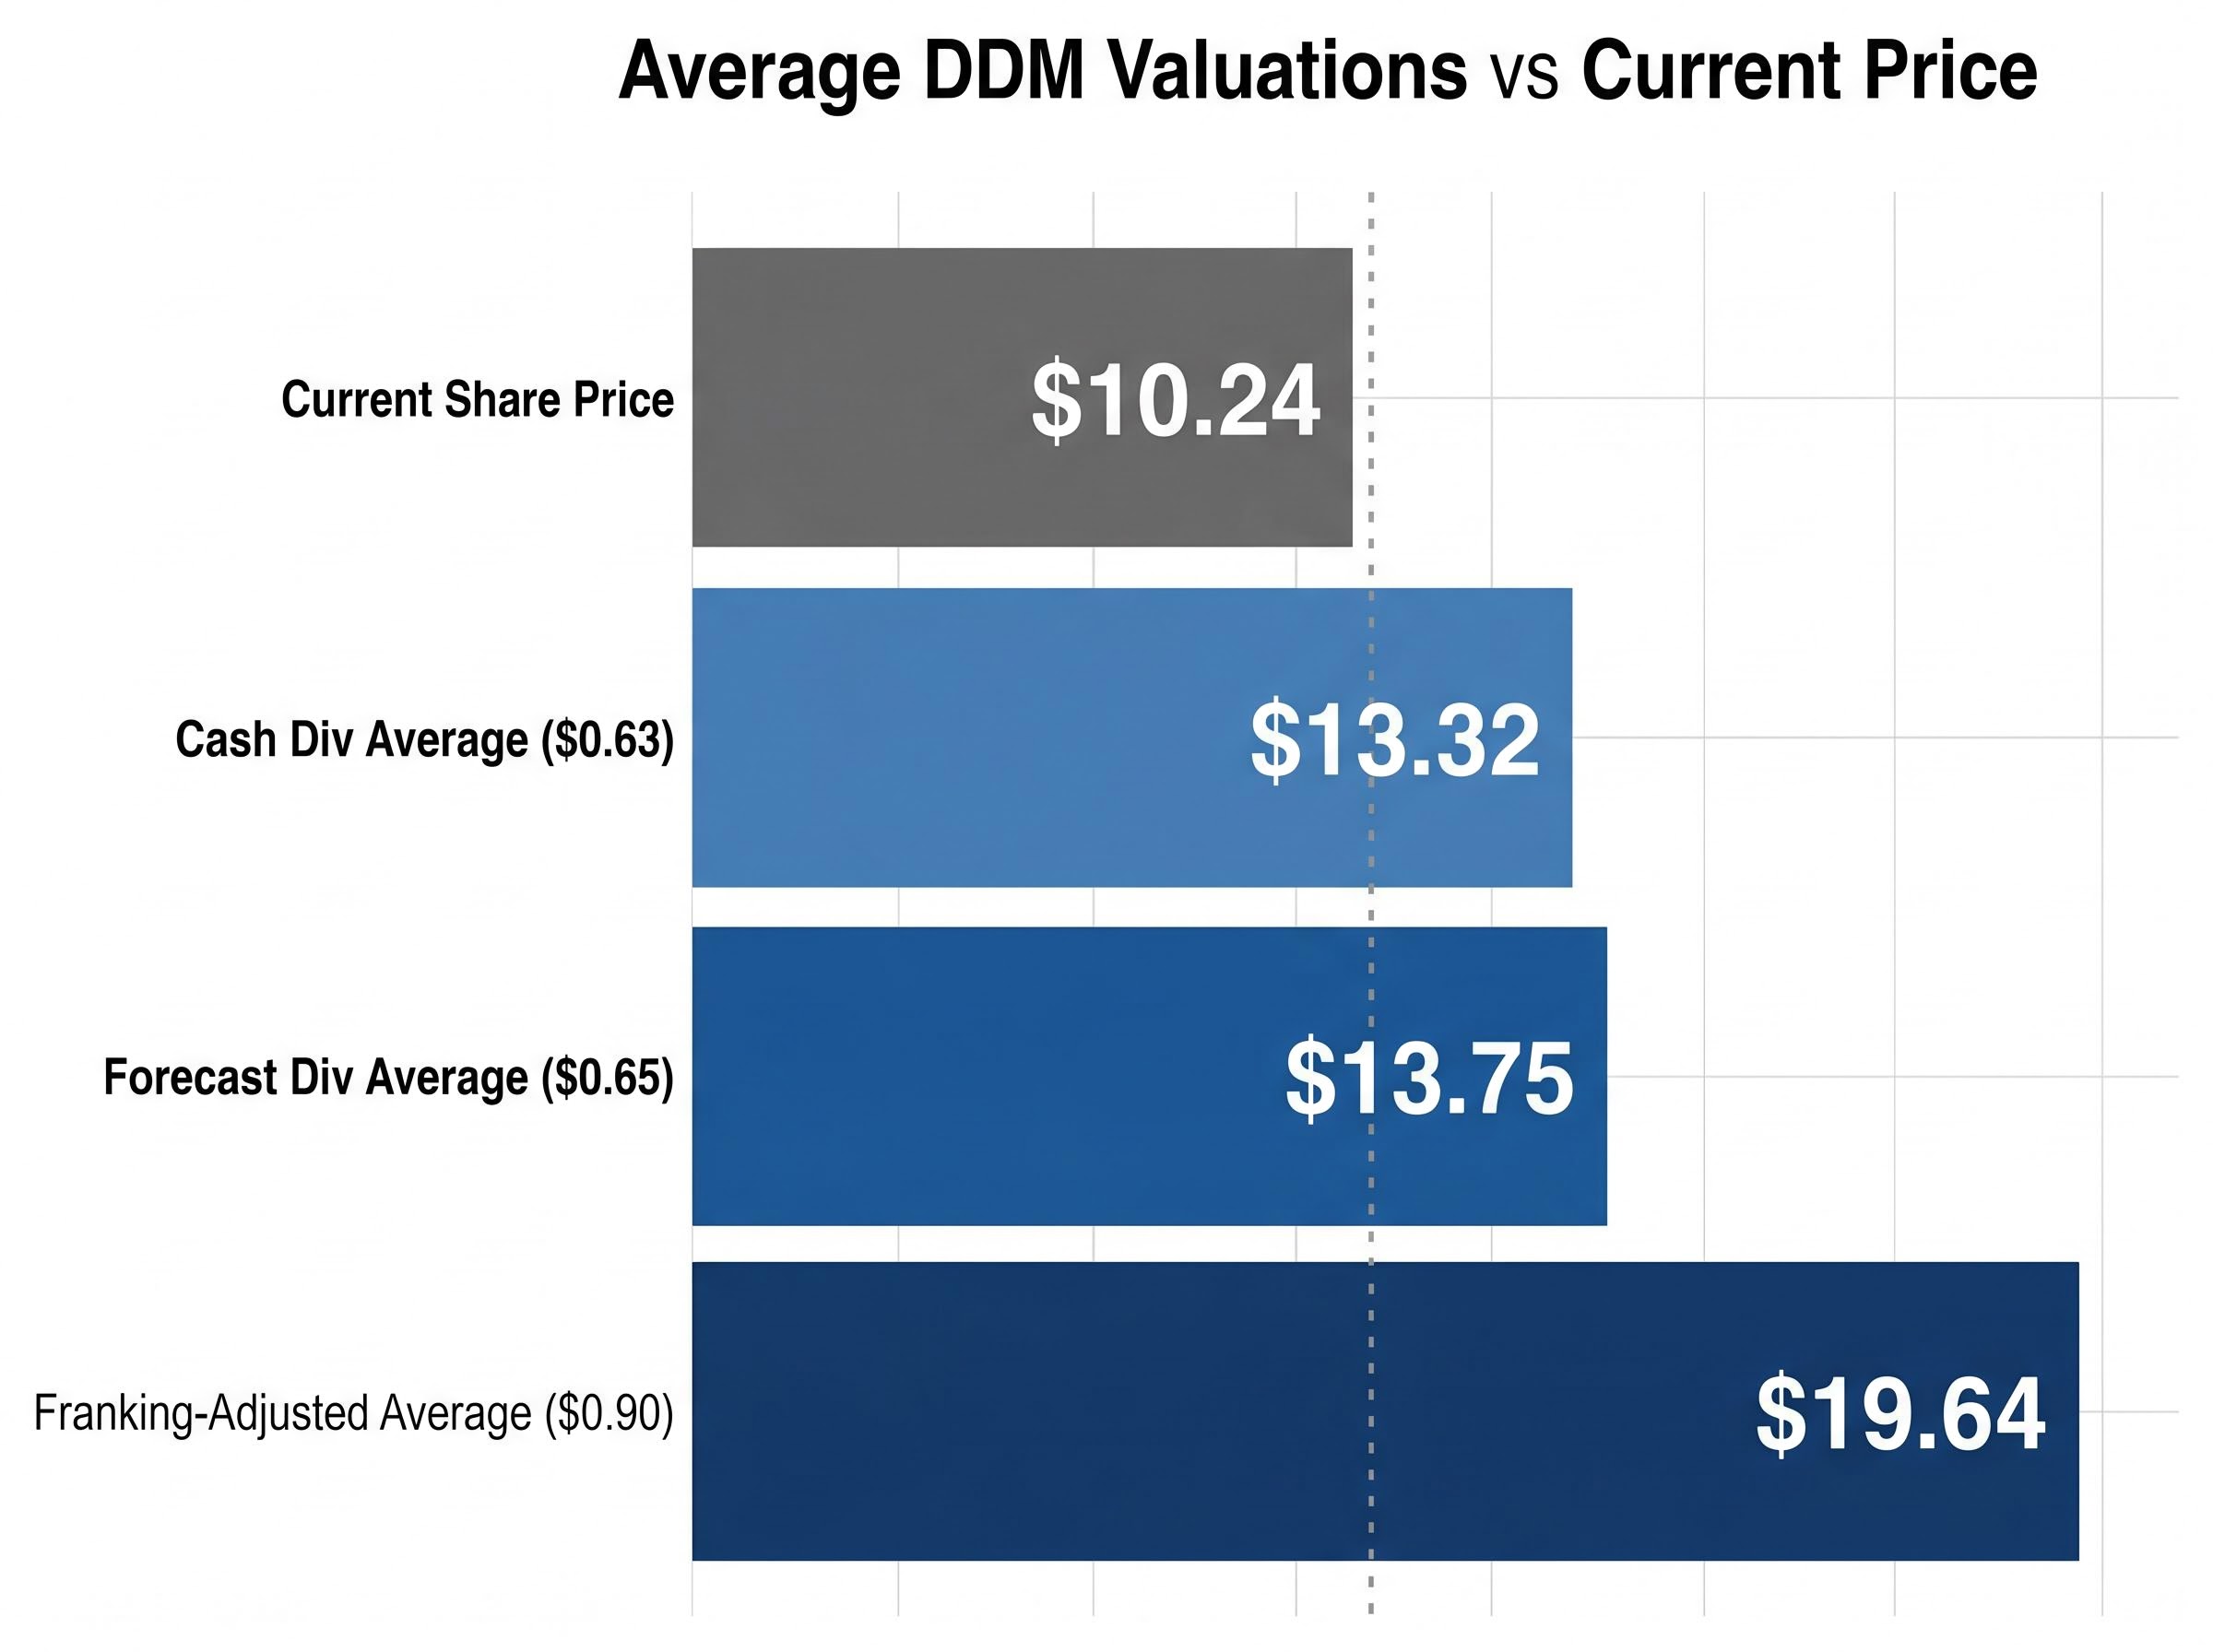
The average output across all modelled scenarios is approximately $13.32 per share, compared to BEN’s current share price of $10.24.
That average provides a central reference point. But the range itself is where the real information lives.
The spread looks alarming. It is not. The DDM formula divides the dividend by the difference between the discount rate and the growth rate. When that denominator is small, the output is large. When it is large, the output shrinks.
Consider two scenarios using the $0.63 dividend. At a 6% discount rate and 4% growth rate, the denominator is just 0.02. The output: $31.50. At an 11% discount rate and 2% growth rate, the denominator is 0.09. The output: $7.00. A shift of 7 percentage points in the denominator produced a valuation difference of more than $24 per share.
The same mathematical sensitivity that produces BEN’s $7-$32 range is at work across every ASX bank DDM: macro assumptions in bank valuations, particularly the discount rate embedded in market risk premiums and the growth rate tied to the RBA’s rate trajectory, can move a NAB or ANZ valuation by more than $60 per share across plausible scenarios.
Factors that push the valuation toward the extremes:
BEN’s financial profile amplifies this sensitivity. A NIM of 1.90% and ROE of 7.9% leave limited buffer. S&P Global Market Intelligence noted in 2024 that Australian bank dividends were broadly expected to stay flat or rise only slightly due to earnings pressure and competition. For a bank with BEN’s margins, even a small change in the sustainable growth assumption creates a large swing in the model’s output.
| Growth Rate | r = 6% | r = 8% | r = 10% | r = 11% |
|---|---|---|---|---|
| 2% | $15.75 | $10.50 | $7.88 | $7.00 |
| 3% | $21.00 | $12.60 | $9.00 | $7.88 |
| 4% | $31.50 | $15.75 | $10.50 | $9.00 |
The range is not a flaw. It is the model honestly reflecting how much depends on assumptions that no one can verify in advance.
Most DDM explainers stop at the cash dividend. For Australian residents, that understates the economic value of the payout. A fully franked dividend carries an attached tax credit representing company tax already paid at the 30% corporate rate. Eligible Australian resident investors can use that credit to offset personal tax liability, and in some cases receive a cash refund for excess credits.
BEN’s dividends are fully franked. The grossing-up calculation converts the cash dividend into its pre-tax equivalent:
The grossing-up formula used here, dividing the cash dividend by 0.70 to recover the pre-tax equivalent, is the same arithmetic that governs franking credit calculations across every fully franked ASX stock, and the 45-day holding rule determines whether an investor qualifies to claim the credit in the first place.
Gross Dividend = Cash Dividend / (1 – 0.30)
For BEN: $0.63 / 0.70 = $0.90 gross equivalent per share.
Not every investor benefits equally from this adjustment:
The PBO dividend imputation explainer sets out how franking credits flow through to Australian resident shareholders, superannuation funds in accumulation and pension phase, and foreign investors who cannot access the credit, making the differential tax treatment across investor types a matter of official public record rather than a modelling assumption.
Substituting the $0.90 grossed-up dividend into the DDM matrix and averaging across the same range of discount rates and growth assumptions produces a franking-adjusted average valuation of approximately $19.64 per share. For eligible Australian residents, this figure captures economic value that the plain cash DDM ignores entirely, and it sits materially above both the cash-dividend average of approximately $13.32 (using $0.63) and the forecast-adjusted average of approximately $13.75 (using $0.65). All three averages exceed BEN’s current share price of $10.24, though by different margins depending on the investor’s tax position.
None of these figures should be treated as a buy or sell signal in isolation. Together, they illustrate the range of value interpretations depending on the investor’s tax position.
All three DDM averages sit above BEN’s current share price of $10.24. On face value, the model suggests the market is pricing BEN below the central estimate of its dividend-derived value, particularly for Australian investors who capture the franking benefit.
That interpretation requires several assumptions to hold:
The DDM cannot account for credit cycle risk, capital management decisions by APRA, or competitive pressure from major banks and non-bank lenders. BEN’s CET1 of 11.3% provides a moderate buffer, and its network of over 500 branches supports a community banking positioning. But these qualitative factors sit outside the model’s arithmetic.
PE and DDM valuation applied together to a single ASX bank share, as in a comparable worked example that applies both methods with franking credit adjustments, illustrates how the two models cross-check each other and why the DDM alone leaves material analytical gaps that a price-to-earnings comparison can partially fill.
The APRA capital adequacy prudential standards set out how CET1 ratios interact with capital distribution restrictions, meaning that a bank operating close to minimum buffers can face regulatory constraints on dividend payments that no DDM formula can anticipate.
The three DDM averages ($13.32, $13.75, and $19.64) all exceed BEN’s current $10.24 share price. The gap is either an opportunity the market has mispriced, or a reflection that the market’s implied assumptions about BEN’s growth and risk are more conservative than the model’s mid-range inputs.
This article is for informational purposes only and should not be considered financial advice. Investors should conduct their own research and consult with financial professionals before making investment decisions. DDM outputs are based on assumptions that may not reflect future outcomes. Past performance does not guarantee future results.
The Dividend Discount Model works best as a range-based thinking tool for Australian bank shares, not a precise calculator. The spread between $7.22 and $32.50 is the point: it maps the genuine uncertainty in predicting any bank’s long-term dividend trajectory, and for a mid-tier bank like BEN, that uncertainty is wider than for the majors.
For eligible Australian residents, the franking adjustment is material. Omitting it when comparing bank shares to term deposits or other income assets understates the economic return from fully franked dividends.
Any reader looking to apply this framework to another ASX bank share can start with the same three steps: identify the forecast dividend, select a discount rate range appropriate to the bank’s risk profile, and test multiple growth assumptions. The single-point estimate is never the answer. The range is.
The Dividend Discount Model (DDM) estimates a share's intrinsic value based on its expected future dividends, using the formula: Value = D1 / (r - g), where D1 is the next expected dividend, r is the required discount rate, and g is the expected dividend growth rate.
Franking credits allow eligible Australian resident investors to gross up the cash dividend to its pre-tax equivalent (for example, $0.63 divided by 0.70 equals $0.90 for a fully franked dividend), which when fed into the DDM produces a materially higher average valuation compared to using the cash dividend alone.
The DDM divides the dividend by the difference between the discount rate and the growth rate, so small changes in those inputs cause large swings in the output; for Bendigo and Adelaide Bank, applying discount rates of 6%-11% and growth rates of 2%-4% produces a valuation range of $7.22 to $32.50 per share.
Australian retail DDM analysis commonly uses a discount rate range of approximately 6% to 11%, with the appropriate rate depending on the risk profile of the bank; mid-tier banks like Bendigo and Adelaide Bank typically warrant a higher discount rate than the major ASX banks.
The DDM cannot account for credit cycle risk, APRA capital management decisions, or competitive pressure from major banks and non-bank lenders, and its outputs are highly sensitive to the growth and discount rate assumptions used, making the resulting range more informative than any single-point estimate.