
US Treasury yields remain elevated, the Federal Reserve has held rates above 4% for over a year, and the conditions that historically pull global capital into dollar-denominated assets are all present. Yet the DXY, the index that measures the dollar against a basket of major currencies, has been unable to break above 100.1.
That contradiction is not a single-data-point anomaly. The forces constraining the dollar are structural, built up over years of fiscal expansion that has quietly eroded the yield advantage US bonds actually deliver to foreign investors. And they are being amplified by a specific geopolitical event: the first coordinated US-Japan currency intervention since 1998, which has removed one of the dollar’s most reliable demand props at the worst possible moment.
Here is how to separate what is cyclical noise from what is genuinely changing about the dollar’s structural position, and what that distinction means for how you interpret yield data, intervention headlines, and currency moves from here.
Why the dollar’s yield engine is losing torque
US bond yields have historically been the gravitational centre of dollar demand. Foreign investors bought Treasuries because they offered superior risk-adjusted returns compared with other major sovereign markets, and the capital flows that followed supported the dollar.
That advantage is being eroded, but not by falling nominal yields. The mechanism is subtler. Rising term premia (the extra return investors demand for holding longer-dated bonds) and inflation uncertainty are reducing the net return foreign investors actually receive after three costs are deducted:
Treasury yield dynamics are already transmitting through household balance sheets in ways that make the structural argument concrete: monthly mortgage payments on a standard home loan are roughly $800 higher than in 2021, and the equity risk premium has compressed to near multi-decade lows as bond yields compete with equity returns for capital allocation.
- Inflation uncertainty, which reduces the real purchasing power of future coupon payments
- Currency hedging costs, which eat into returns for any non-US investor who does not want to carry open dollar exposure
- Fiscal risk premium, which reflects the growing probability that US debt sustainability itself becomes a drag on returns
The gap between the headline Treasury yield and the risk-adjusted return a foreign buyer actually pockets is widening. That gap is where the dollar’s structural support is leaking.
The NBER research on the US Treasury premium provides empirical backing for this erosion, finding that rising US government debt supply has compressed the convenience yield foreign investors once received on Treasuries, directly reducing the marginal demand that historically supported the dollar.
Goldman Sachs has noted that long-dated Treasuries have not rallied even as US growth estimates have declined, a signal that investors are demanding higher compensation for fiscal risk rather than treating these bonds as pure safe-haven assets.
This tells you that interpreting yield levels in isolation is no longer sufficient for understanding dollar direction. The gross yield is still there. The net return, after the costs that actually matter to foreign capital, is not what it was.
When big ASX news breaks, our subscribers know first
What a 6.8% deficit actually does to the dollar over time
The deficit figures matter here not as an accounting summary but as a forward-looking signal for where the dollar is structurally headed.
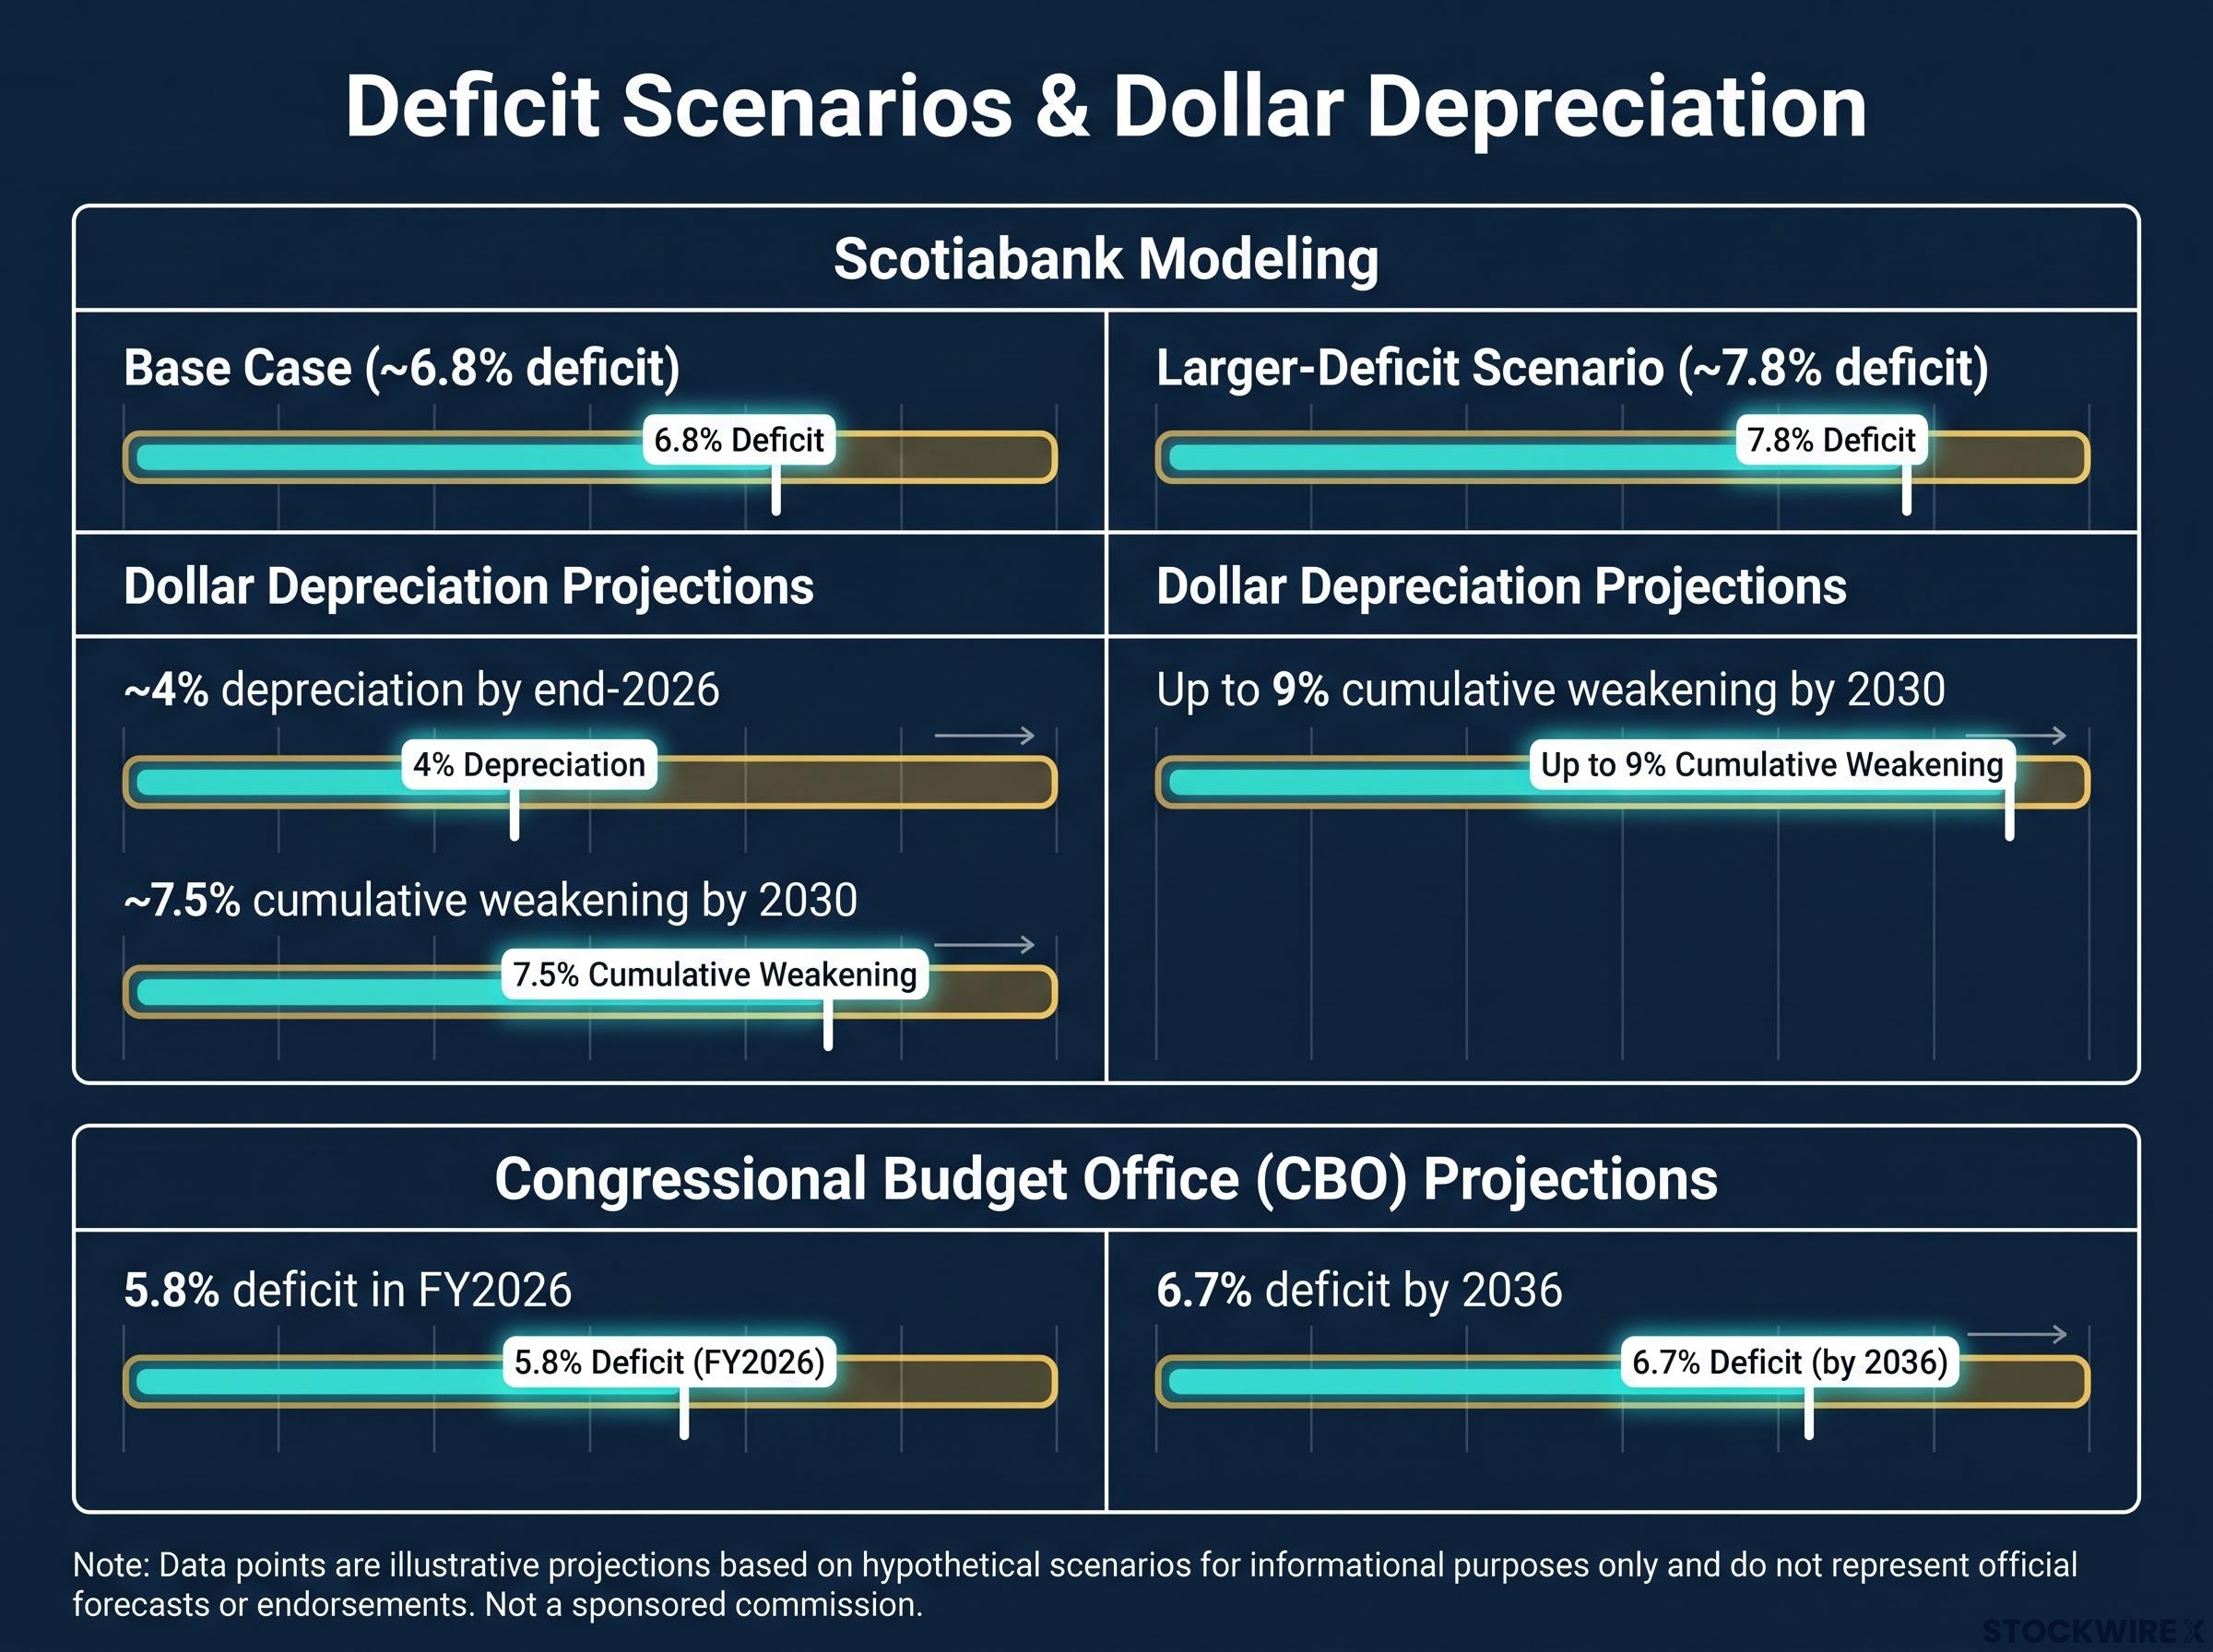
Scotiabank’s base-case modelling links deficits near 6.8% of GDP to approximately 4% depreciation in the broad trade-weighted dollar by end-2026, and approximately 7.5% cumulative weakening by 2030. Larger deficits produce steeper declines.
| Deficit scenario (% of GDP) | Projected depreciation by end-2026 | Projected cumulative weakening by 2030 |
|---|---|---|
| ~6.8% (Scotiabank base case) | ~4% | ~7.5% |
| ~7.8% (larger-deficit scenario) | Greater than base case | Up to 9% |
| 5.8% rising to 6.7% (CBO projection, FY2026-2036) | Aligns with the range associated with multi-year depreciation | |
The Congressional Budget Office (CBO) projects the federal deficit at 5.8% of GDP in fiscal year 2026, rising to 6.7% by 2036. That trajectory sits almost exactly within the range Scotiabank’s models associate with sustained dollar depreciation.
BlackRock, JPMorgan, Goldman Sachs, and Bridgewater have independently reached convergent conclusions on the US fiscal deficit crisis, all reducing exposure to long-duration nominal Treasurys and rotating toward real assets, a portfolio shift that mirrors the institutional response to the term premium dynamics described here.
This is no longer a tail-risk scenario. It is the central fiscal path, barring a significant policy correction.
The Committee for a Responsible Federal Budget has warned that reckless fiscal policy and currency debasement could trigger a self-reinforcing spiral in which sharp dollar depreciation feeds back into higher interest rates.
The timeframe distinction matters. In the short run, fiscal expansion can strengthen the dollar by lifting US rates relative to peers. But once external imbalances and higher net foreign liabilities accumulate, the mechanism flips. Depreciation becomes the rebalancing force. The CBO’s own numbers suggest the US is moving deeper into the zone where that flip becomes increasingly likely.
How the deficit-dollar relationship actually works (and when it does not)
If persistent deficits weaken the dollar over time, a reasonable question follows: why has the dollar not already fallen sharply? The answer is not that the structural case is wrong. It is that the mechanism operates in two phases, and the first phase can temporarily mask the second.
What the models say
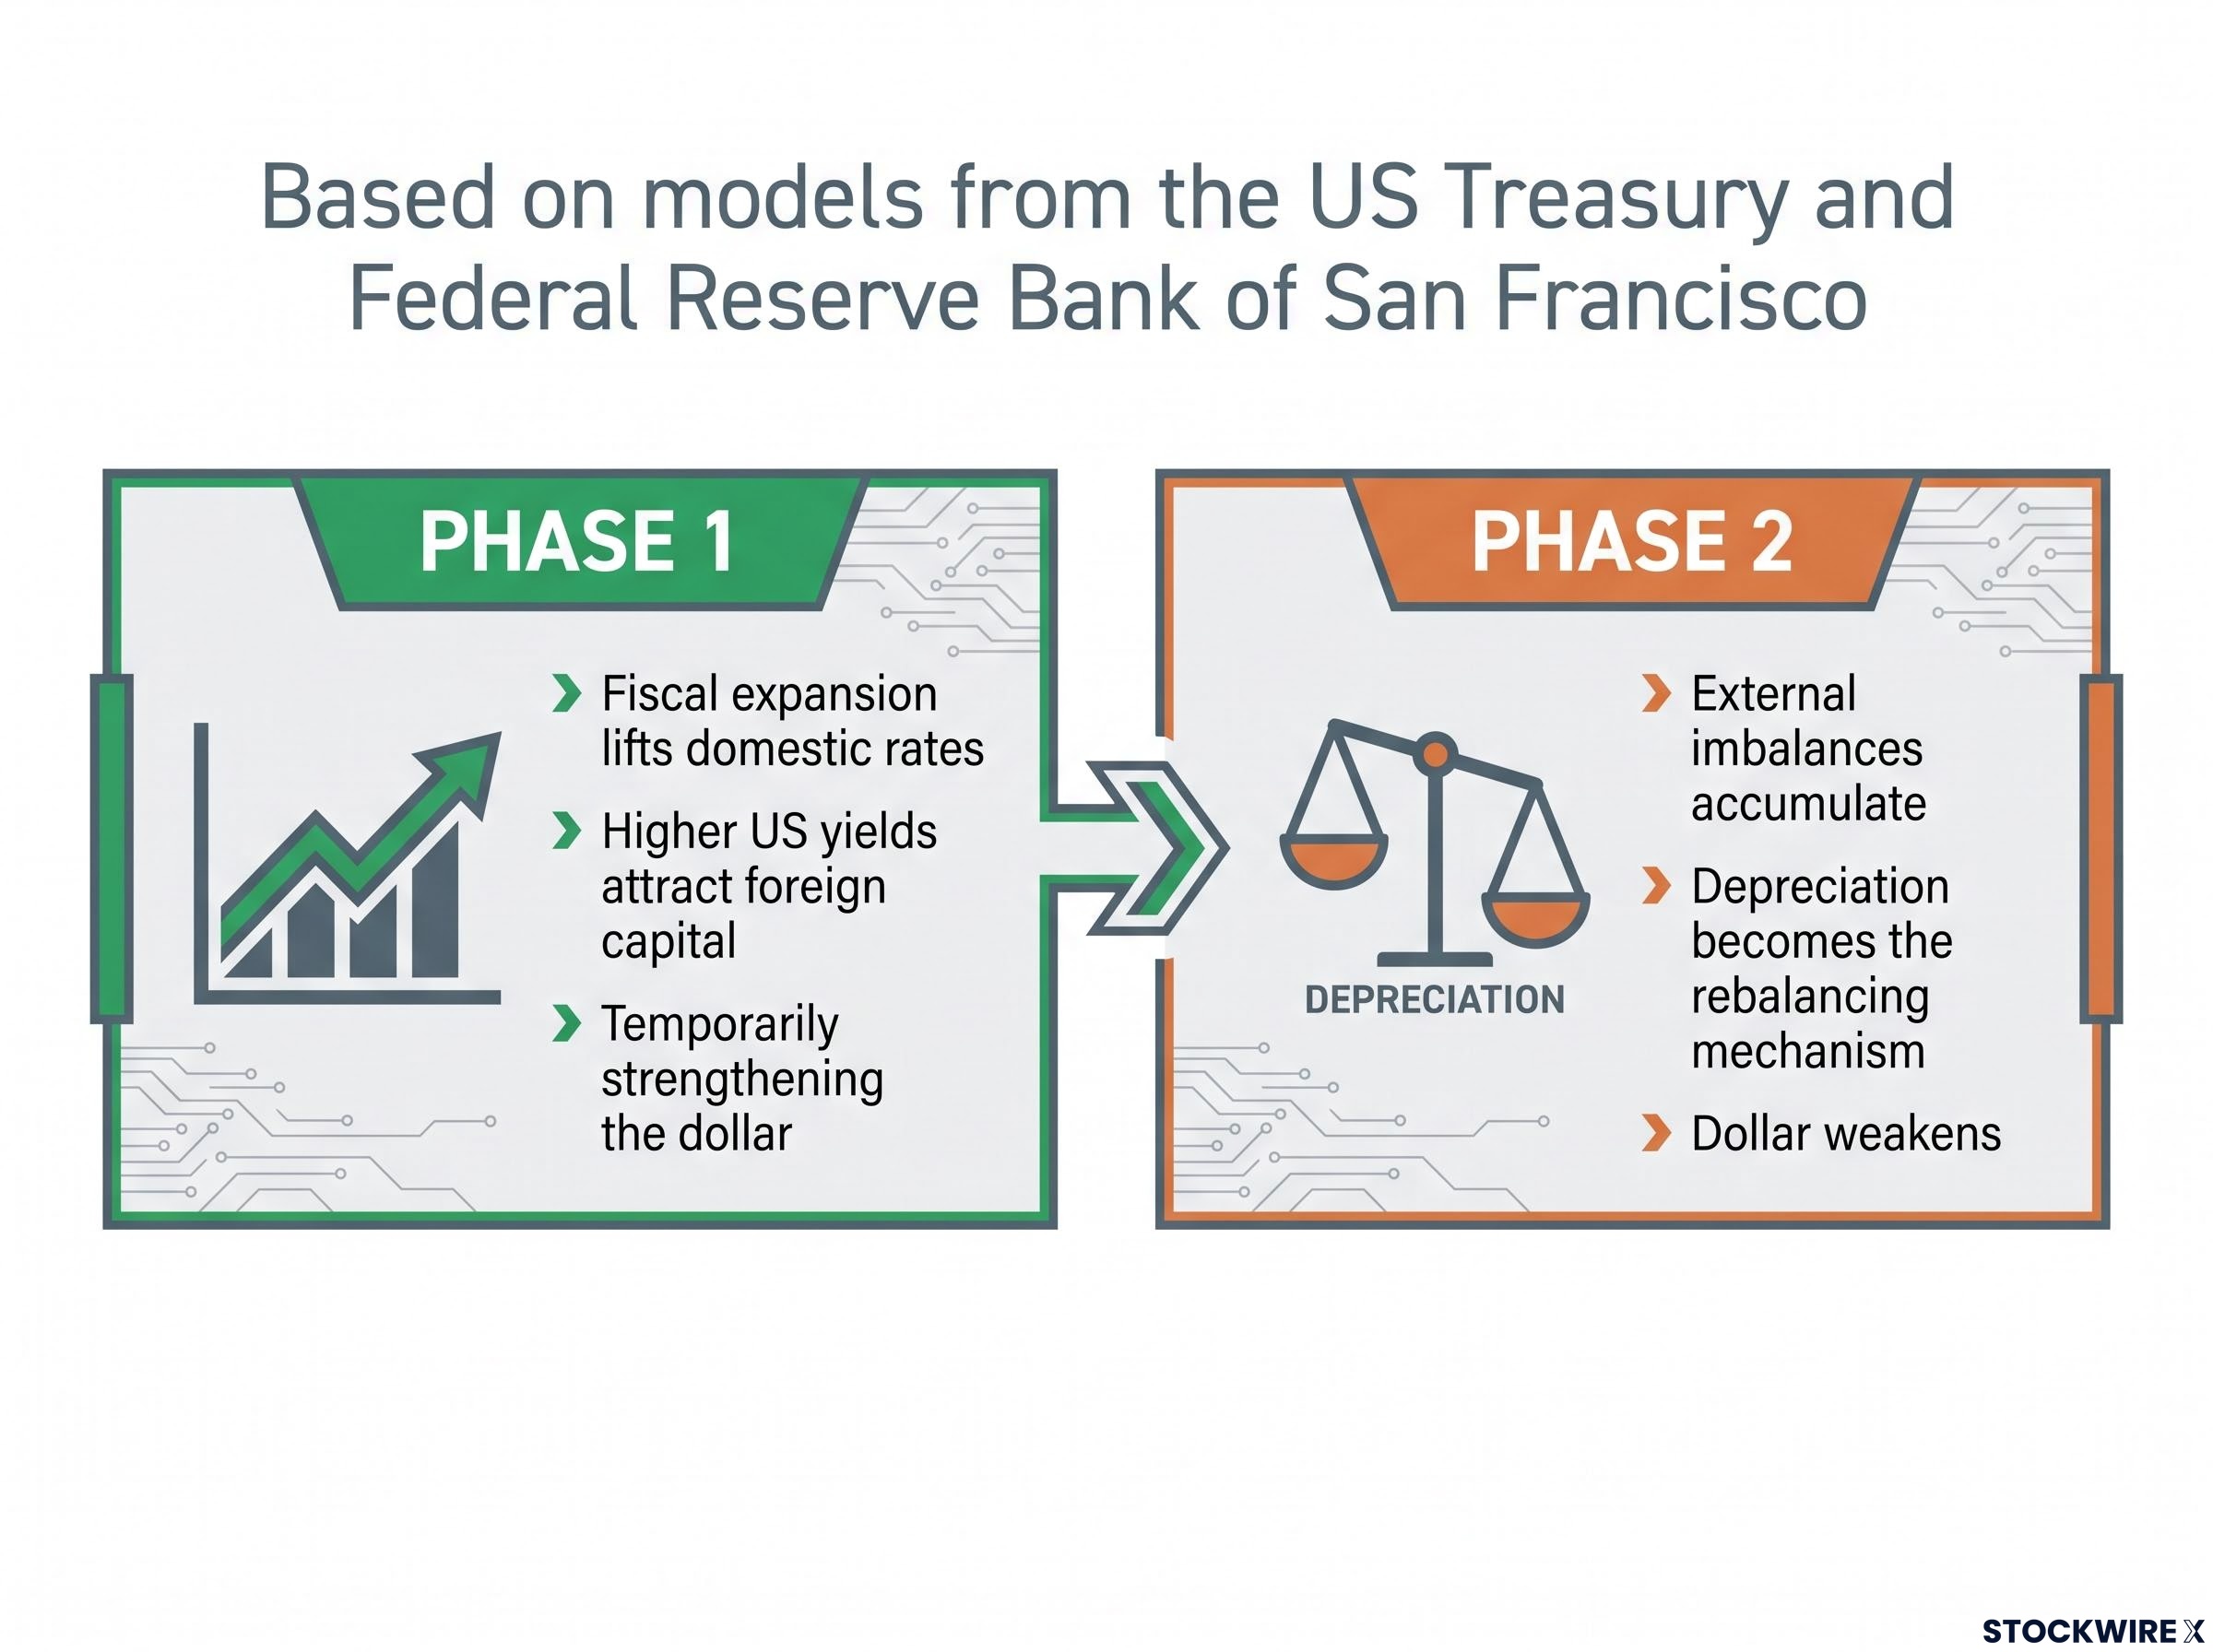
The US Treasury’s own econometric reviews found no reliable, stable correlation between government borrowing and exchange rate movements in the short run. A Federal Reserve Bank of San Francisco survey confirms the pattern: in many macro models, a larger budget deficit leads to currency appreciation first, then weakness later.
The Federal Reserve Bank of San Francisco survey of macro models confirms that a larger budget deficit frequently produces currency appreciation before weakness, because the rate differential effect dominates in Phase 1 while external imbalances are still building.
- Phase 1: Fiscal expansion lifts domestic rates. Higher US yields attract foreign capital, temporarily strengthening the dollar even as the deficit widens.
- Phase 2: External imbalances accumulate. Once the differential reverses or foreign appetite for US assets declines, depreciation becomes the rebalancing mechanism, and the dollar weakens.
What history shows
Some periods show deficits correlated with a stronger dollar, particularly when US rates remained meaningfully above those of other advanced economies. Others show persistent deficits correlating with dollar weakness, especially when external balances deteriorated. The sign of the effect depends on which phase of the mechanism is operative.
The fact that the dollar has not collapsed yet is evidence that Phase 1 is still partially in play, not that Phase 2 is fictional. When the turn comes, the accumulated imbalances from years of Phase 1 make it more consequential, not less. Dismissing the structural case because the dollar is still standing is the analytical error this distinction protects against.
The intervention dimension: how the US-Japan currency operation boxed in the DXY
The fiscal story moves slowly. The intervention story moved in days.
What the intervention did to USD/JPY
In 2026, the US and Japan conducted coordinated currency market operations for the first time since 1998. The actions moved USD/JPY from around 164 toward 157, and the DXY briefly traded below 100. The historical template is the 1985 Plaza Accord, the last time coordinated intervention durably redirected a major currency trend. The 2026 operation was smaller in scope, but the signal was unmistakable: the world’s two largest creditor and debtor nations agreed the dollar was too strong against the yen.
The structural design of the coordinated yen intervention reveals a second motive beyond exchange rate management: the US participated by selling euro reserves rather than dollars or Treasurys, deliberately avoiding a supply shock to the bond market at a moment when fiscal risk premium was already elevated.
How that translated into DXY range-bound behaviour
The yen carries significant weight in the DXY index. When coordinated intervention sold dollars against yen, it did not just move one bilateral pair. It removed a structural source of dollar demand: yen carry trades (borrowing cheaply in yen to invest in higher-yielding dollar assets) and Japan’s recycling of trade surpluses into Treasuries. Three forces are now simultaneously constraining DXY upside:
- Fiscal-driven yield erosion, reducing the net return that attracts foreign capital
- Intervention-reduced carry trade demand, cutting one of the dollar’s largest structural demand flows
- Declining Japanese recycling of surpluses into Treasuries, removing a persistent dollar bid
Philip Wee, economist at DBS Group Research, connected the USD/JPY selloff and coordinated intervention directly to the DXY trading corridor that emerged between 99.4 and 100.1.
Even after US consumer price inflation figures came in broadly as markets had anticipated, the DXY remained unable to push through the 100.1 ceiling. The shortfall cannot be attributed to soft data alone. The structural and intervention-driven forces capping the dollar are now more powerful than a single data release can overcome. For you, this means future USD/JPY moves are not isolated currency pair events. They are potential signals for broader DXY direction, connecting bilateral action to index-level behaviour.
What the dollar’s reserve currency status does and does not protect
The reserve advantage remains real
AllianceBernstein maintains that the dollar retains its reserve currency status because no viable alternative matches the depth, liquidity, and institutional framework of the US Treasury market. The Council on Foreign Relations adds that the dollar’s global role depends on market size and liquidity, rule of law, military and geopolitical influence, and network effects in trade and finance. These advantages are not eroding overnight.
The near-term risk is different from the long-term risk
The distinction matters because “structural dollar weakness” does not require betting on the end of dollar dominance. Two separate risks are at play, and only one is immediately actionable:
The de-dollarisation timeline matters here because it separates two distinct analytical questions: whether the dollar is losing marginal support from foreign capital flows, which this article argues is already underway, and whether it is losing reserve currency status, which the data places decades away.
- What the reserve status protects: The dollar’s role as the primary global transaction and reserve currency; the unmatched depth and liquidity of the Treasury market; the absence of a credible alternative reserve asset at comparable scale
- What it does not protect against: Weaker marginal capital flow support as risk-adjusted yields erode; reduced appreciation potential even when US rates are high; the gradual loss of the automatic foreign-capital bid that once made the dollar’s upside seem assured
The GAO and Bipartisan Policy Center have both warned that growing debt and political brinkmanship around the debt limit pose a medium- to long-term threat to the reserve role, but not an imminent loss of status.
The better-supported and more actionable thesis is about constrained appreciation and eroding marginal support. You do not need to believe the dollar is about to lose its reserve status to position for a structurally weaker trajectory. Over-dismissing the case because the dollar is still the reserve currency, or over-extrapolating it into a collapse narrative, both lead to poor positioning.
What a structurally constrained dollar means for the decisions ahead
Three structural forces are now converging on the same conclusion: fiscal-driven term premium elevation, intervention-reduced carry demand, and reserve status resilience without appreciation support. The result is a dollar that is range-constrained rather than collapsing. The DXY corridor of 99.4 to 100.1 is the present-day expression of these forces in equilibrium.
The cyclical-versus-structural distinction is the interpretive tool that ties it together. Data releases and central bank decisions drive cyclical oscillations within the structural baseline. But that baseline itself is shifting lower on a multi-year horizon. The ceiling for dollar strength after any given data point is lower than it was five years ago.
Three forward-looking variables would signal a structural turn in either direction:
- A credible US fiscal consolidation path would be dollar-positive, signalling that the deficit trajectory fuelling term premium elevation is being addressed.
- Further USD/JPY intervention or yen carry unwind would reinforce the current range constraint, keeping one of the dollar’s traditional demand props suppressed.
- A deterioration of fiscal credibility triggering a term premium spike would accelerate the structural headwind, potentially breaking the dollar below the lower bound of the current range.
Scotiabank’s multi-year depreciation pathway projects up to 7.5% cumulative dollar weakening by 2030 in its base case, and up to 9% with larger deficits, against a CBO fiscal trajectory that shows deficits rising to 6.7% of GDP by 2036.
Every subsequent USD data release, Treasury auction, or Fed commentary you encounter should now be filtered through one question: is this event changing the structural baseline, or is it just moving the dollar within a range that these forces have already defined? That distinction is the difference between reacting to noise and reading direction.
This article is for informational purposes only and should not be considered financial advice. Investors should conduct their own research and consult with financial professionals before making investment decisions. Financial projections referenced are subject to market conditions and various risk factors. Past performance does not guarantee future results.