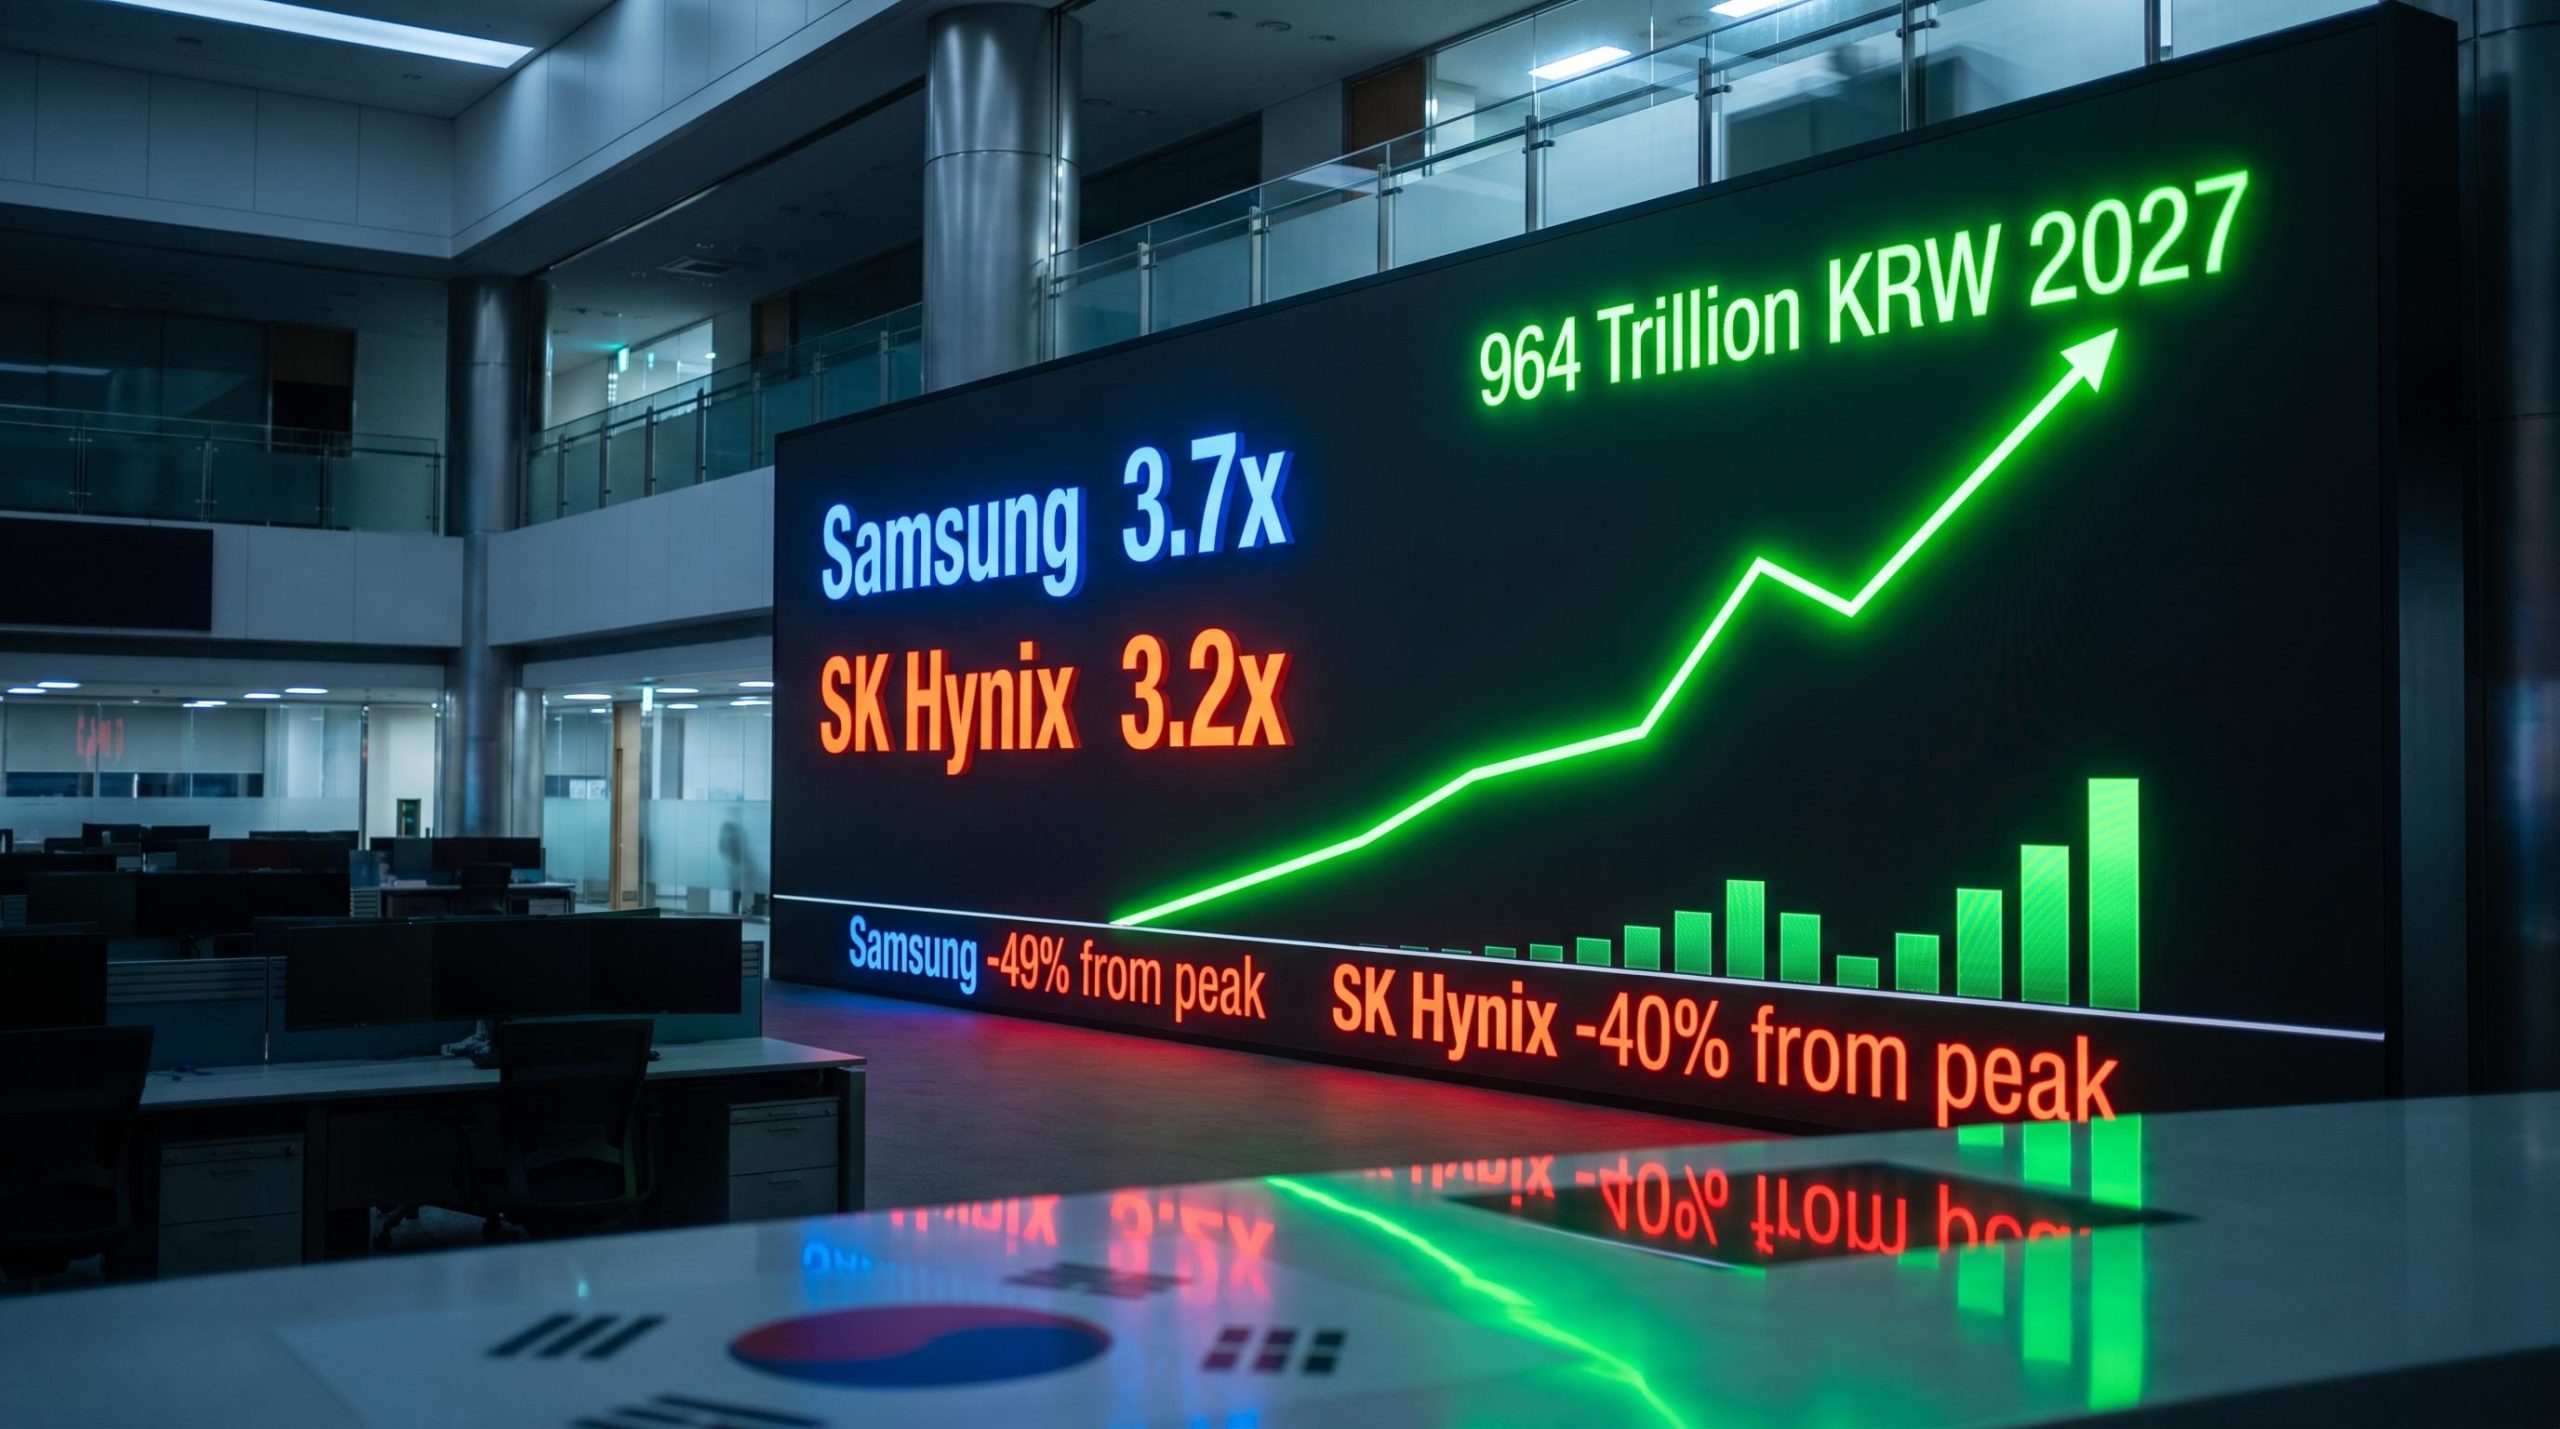
KB Securities published a high-conviction analyst note on 13 August 2026 naming Samsung Electronics and SK Hynix as two of the most mispriced large-cap stocks in global markets. The firm’s head of research, Kim Dong-won (Jeff Kim), pointed to forward price-to-earnings ratios of approximately 3.7x and 3.2x respectively on 2027 earnings estimates, after both stocks declined more than 40% from their peaks.
The note lands at a moment when many investors have rotated out of Korean memory stocks, citing concerns about artificial intelligence spending durability. That rotation has compressed multiples to levels typically reserved for structurally challenged businesses, not companies forecasting multi-fold profit growth. Together, Samsung and SK Hynix carry a combined market capitalisation of approximately 2,593 trillion Korean won.
Here is what KB’s numbers actually say about the valuation disconnect, how the earnings trajectory holds up under scrutiny, and which near-term events could force the market to close the gap.
Why KB Securities says the selloff was the wrong reaction
Samsung Electronics fell approximately 49% from its peak. SK Hynix declined more than 40%. Those are numbers that, on their face, look like the market pricing in a business going wrong.
KB Securities argues the opposite. The firm’s diagnosis identifies two specific drivers behind the selloff, neither of which reflects deterioration in the memory industry’s structural earnings outlook:
- Compulsory unwinding of credit positions built on excessive leverage, which generated broad-based selling pressure disconnected from underlying company performance.
- Excessive sentiment around an AI capital expenditure slowdown, which KB characterises as disproportionate to actual demand signals from hyperscale customers.
KB’s position is that both of these technical and psychological factors have already been fully absorbed into the share price, leaving the compressed multiples as an artefact of the selloff mechanism rather than a signal of fundamental weakness. For investors who conflated the price decline with a business warning, that distinction matters: a 49% drawdown driven by leverage unwinding is a categorically different signal than one driven by collapsing demand or margin erosion. KB’s entire thesis rests on that separation.
The chip selloff classification matters beyond Korean memory stocks: Bank of America’s framework identifies the 18% SOX underperformance reading as matching recoverable trade-shock episodes rather than full cyclical downturns, providing an independent analytical basis for distinguishing technical dislocation from fundamental deterioration.
When big ASX news breaks, our subscribers know first
What a 3-4x forward P/E actually means for companies forecasting triple-digit profit growth
A forward price-to-earnings (P/E) ratio measures how much investors are paying today for each dollar of expected future profit. It is the market’s shorthand for what it believes a company’s earnings are worth. A P/E of 3-4x typically signals one of three things: a business in structural decline, a deeply cyclical company at a cycle peak, or a stock the market has simply mispriced.
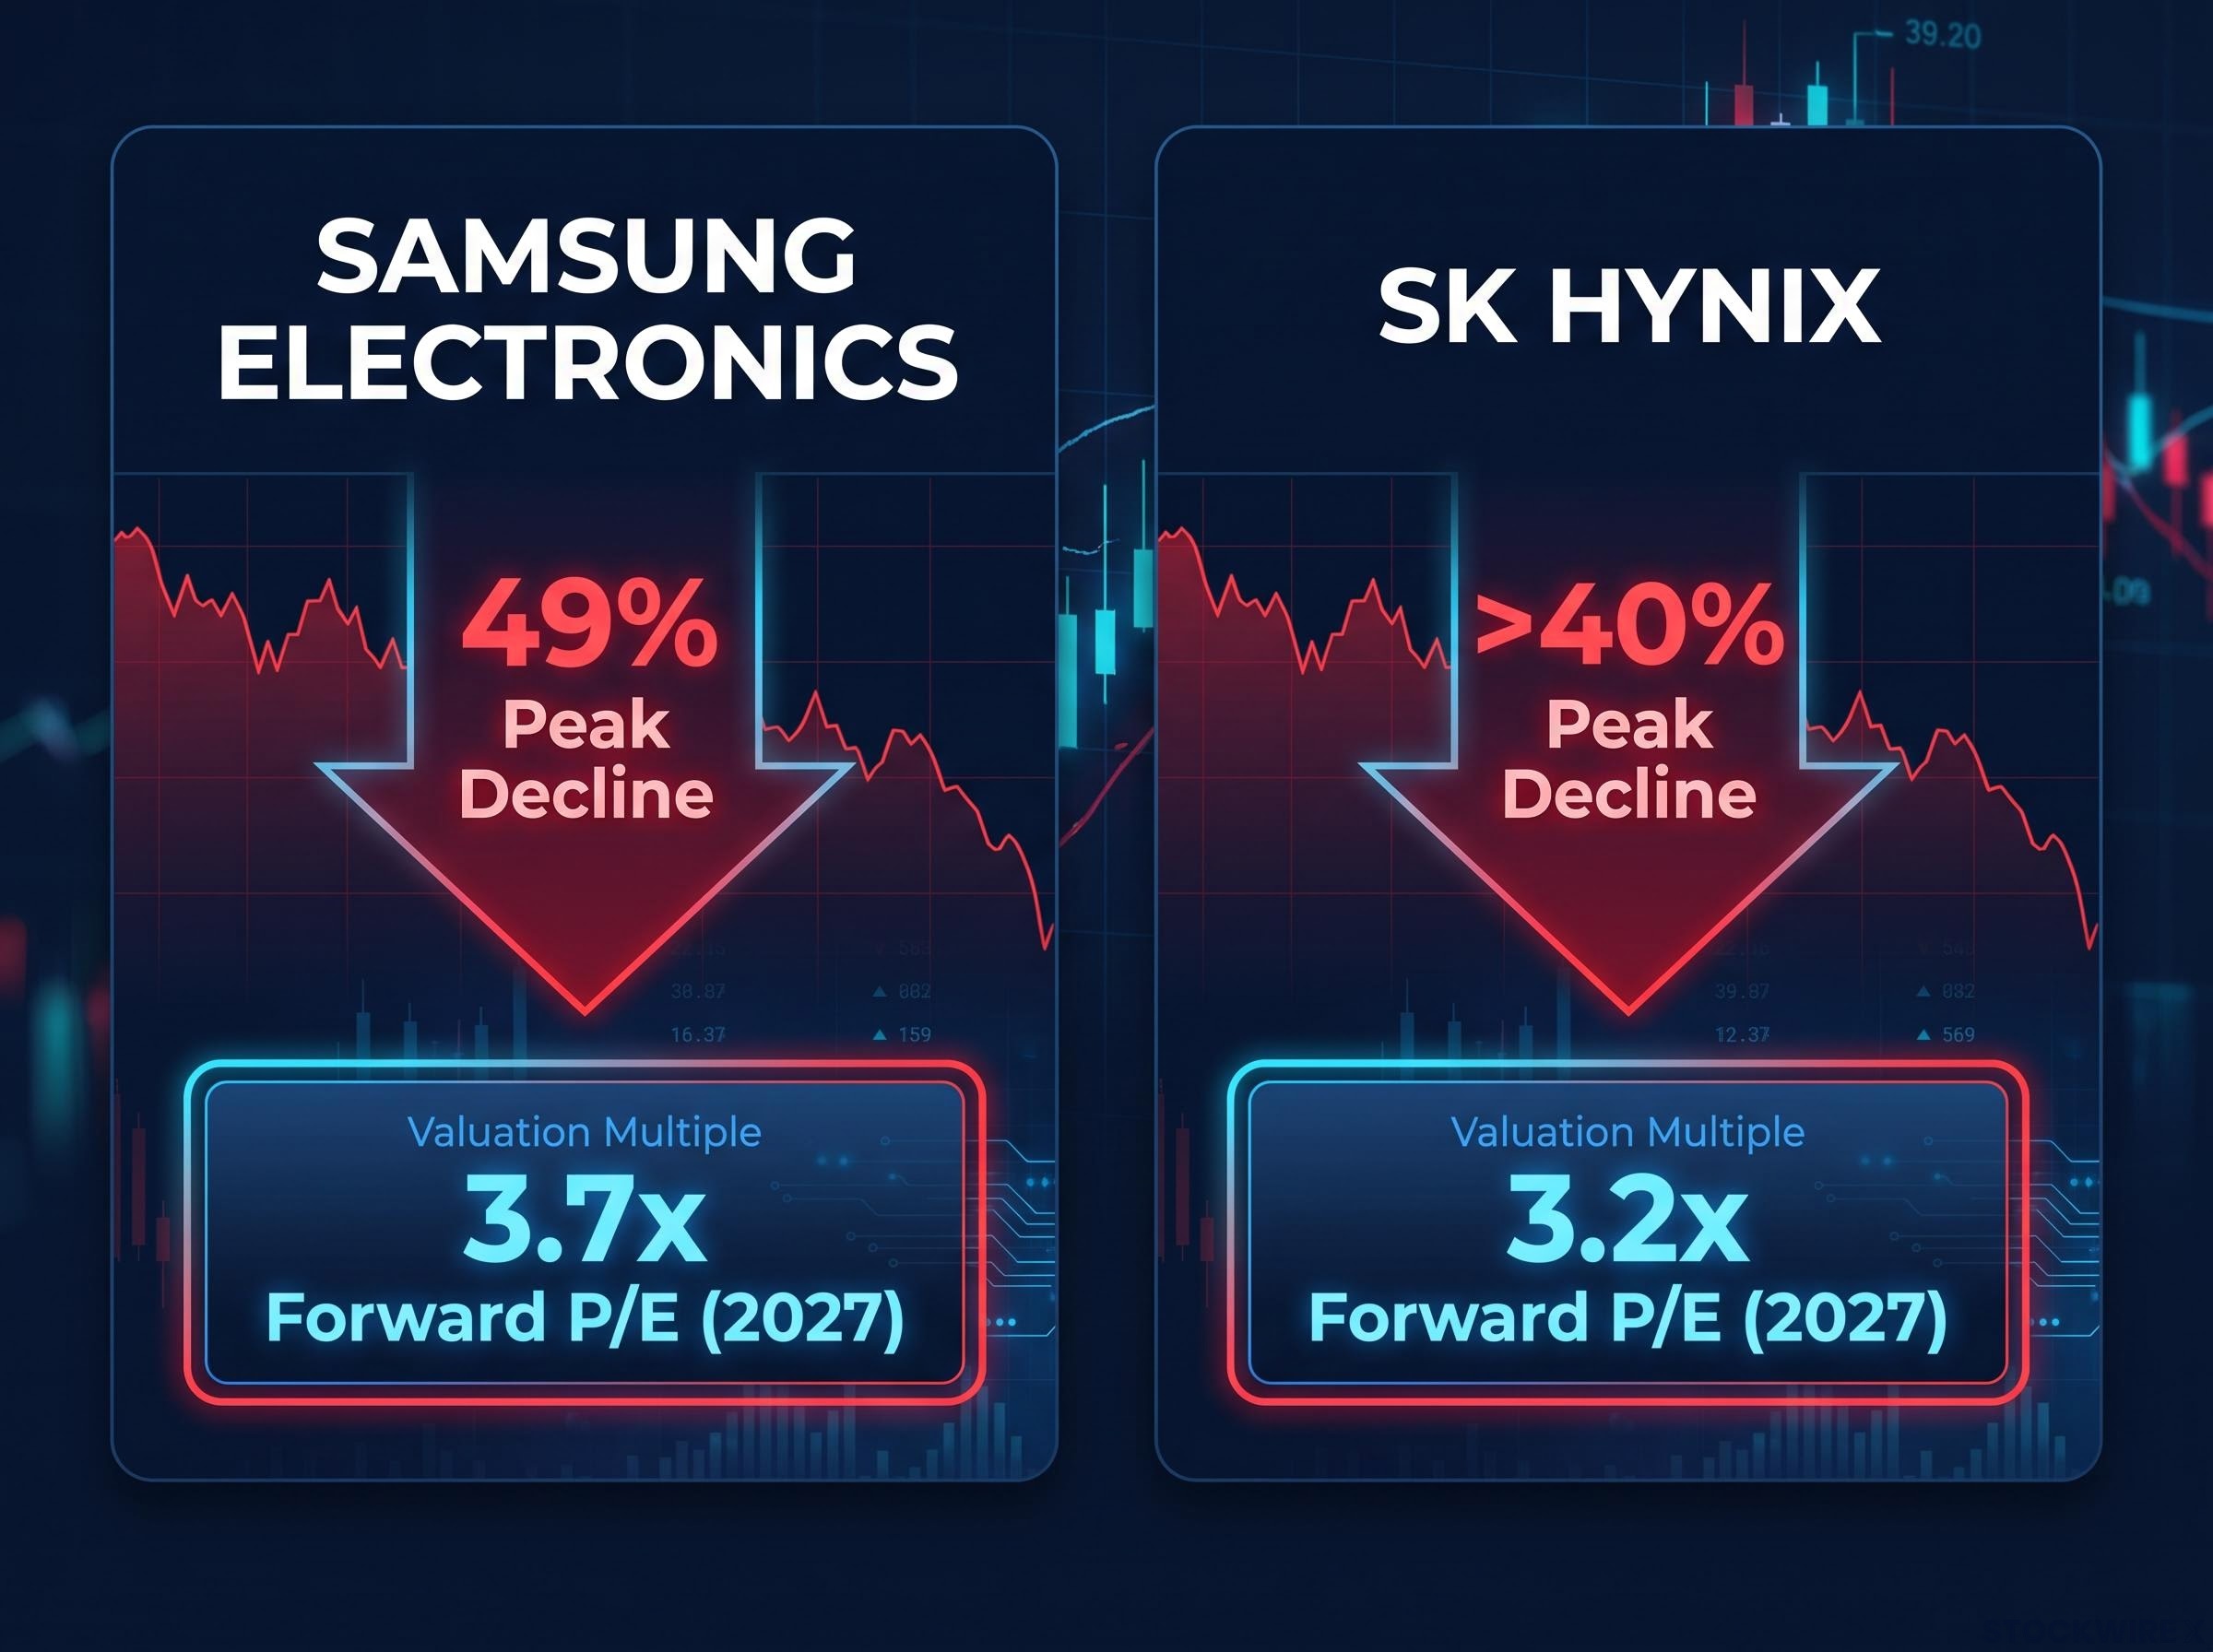
Measured against the 12 August 2026 close, Samsung Electronics is valued at roughly 3.7x forecast 2027 earnings, while SK Hynix sits at roughly 3.2x.
KB Securities describes current levels as an “extremely undervalued zone” relative to the pace of expected earnings growth.
Those multiples are not just low in absolute terms. They are structurally inconsistent with the scale of profit growth KB projects for both companies over the next two years. In a typical market context, a 3.2x forward P/E is priced for stagnation. KB is forecasting the opposite.
| Metric | Samsung Electronics | SK Hynix |
|---|---|---|
| Forward P/E (2027 estimates) | 3.7x | 3.2x |
| Typical signal at this multiple | Structural decline or deep cyclical trough | Structural decline or deep cyclical trough |
| KB’s projected 2027 vs 2025 profit multiple | ~13.2x | ~8.2x |
The gap between what these multiples typically signal and what the projected earnings trajectory actually shows is the analytical core of KB’s thesis. The market has not yet bridged that gap.
For investors who want to interrogate the 3.2-3.7x multiple more rigorously, our dedicated guide to forward P/E limitations covers the specific failure modes of P/E ratios for cyclical companies and the complementary metrics, including PEG and EV/EBITDA, that analysts use alongside it.
The earnings ramp that makes the valuation case explosive
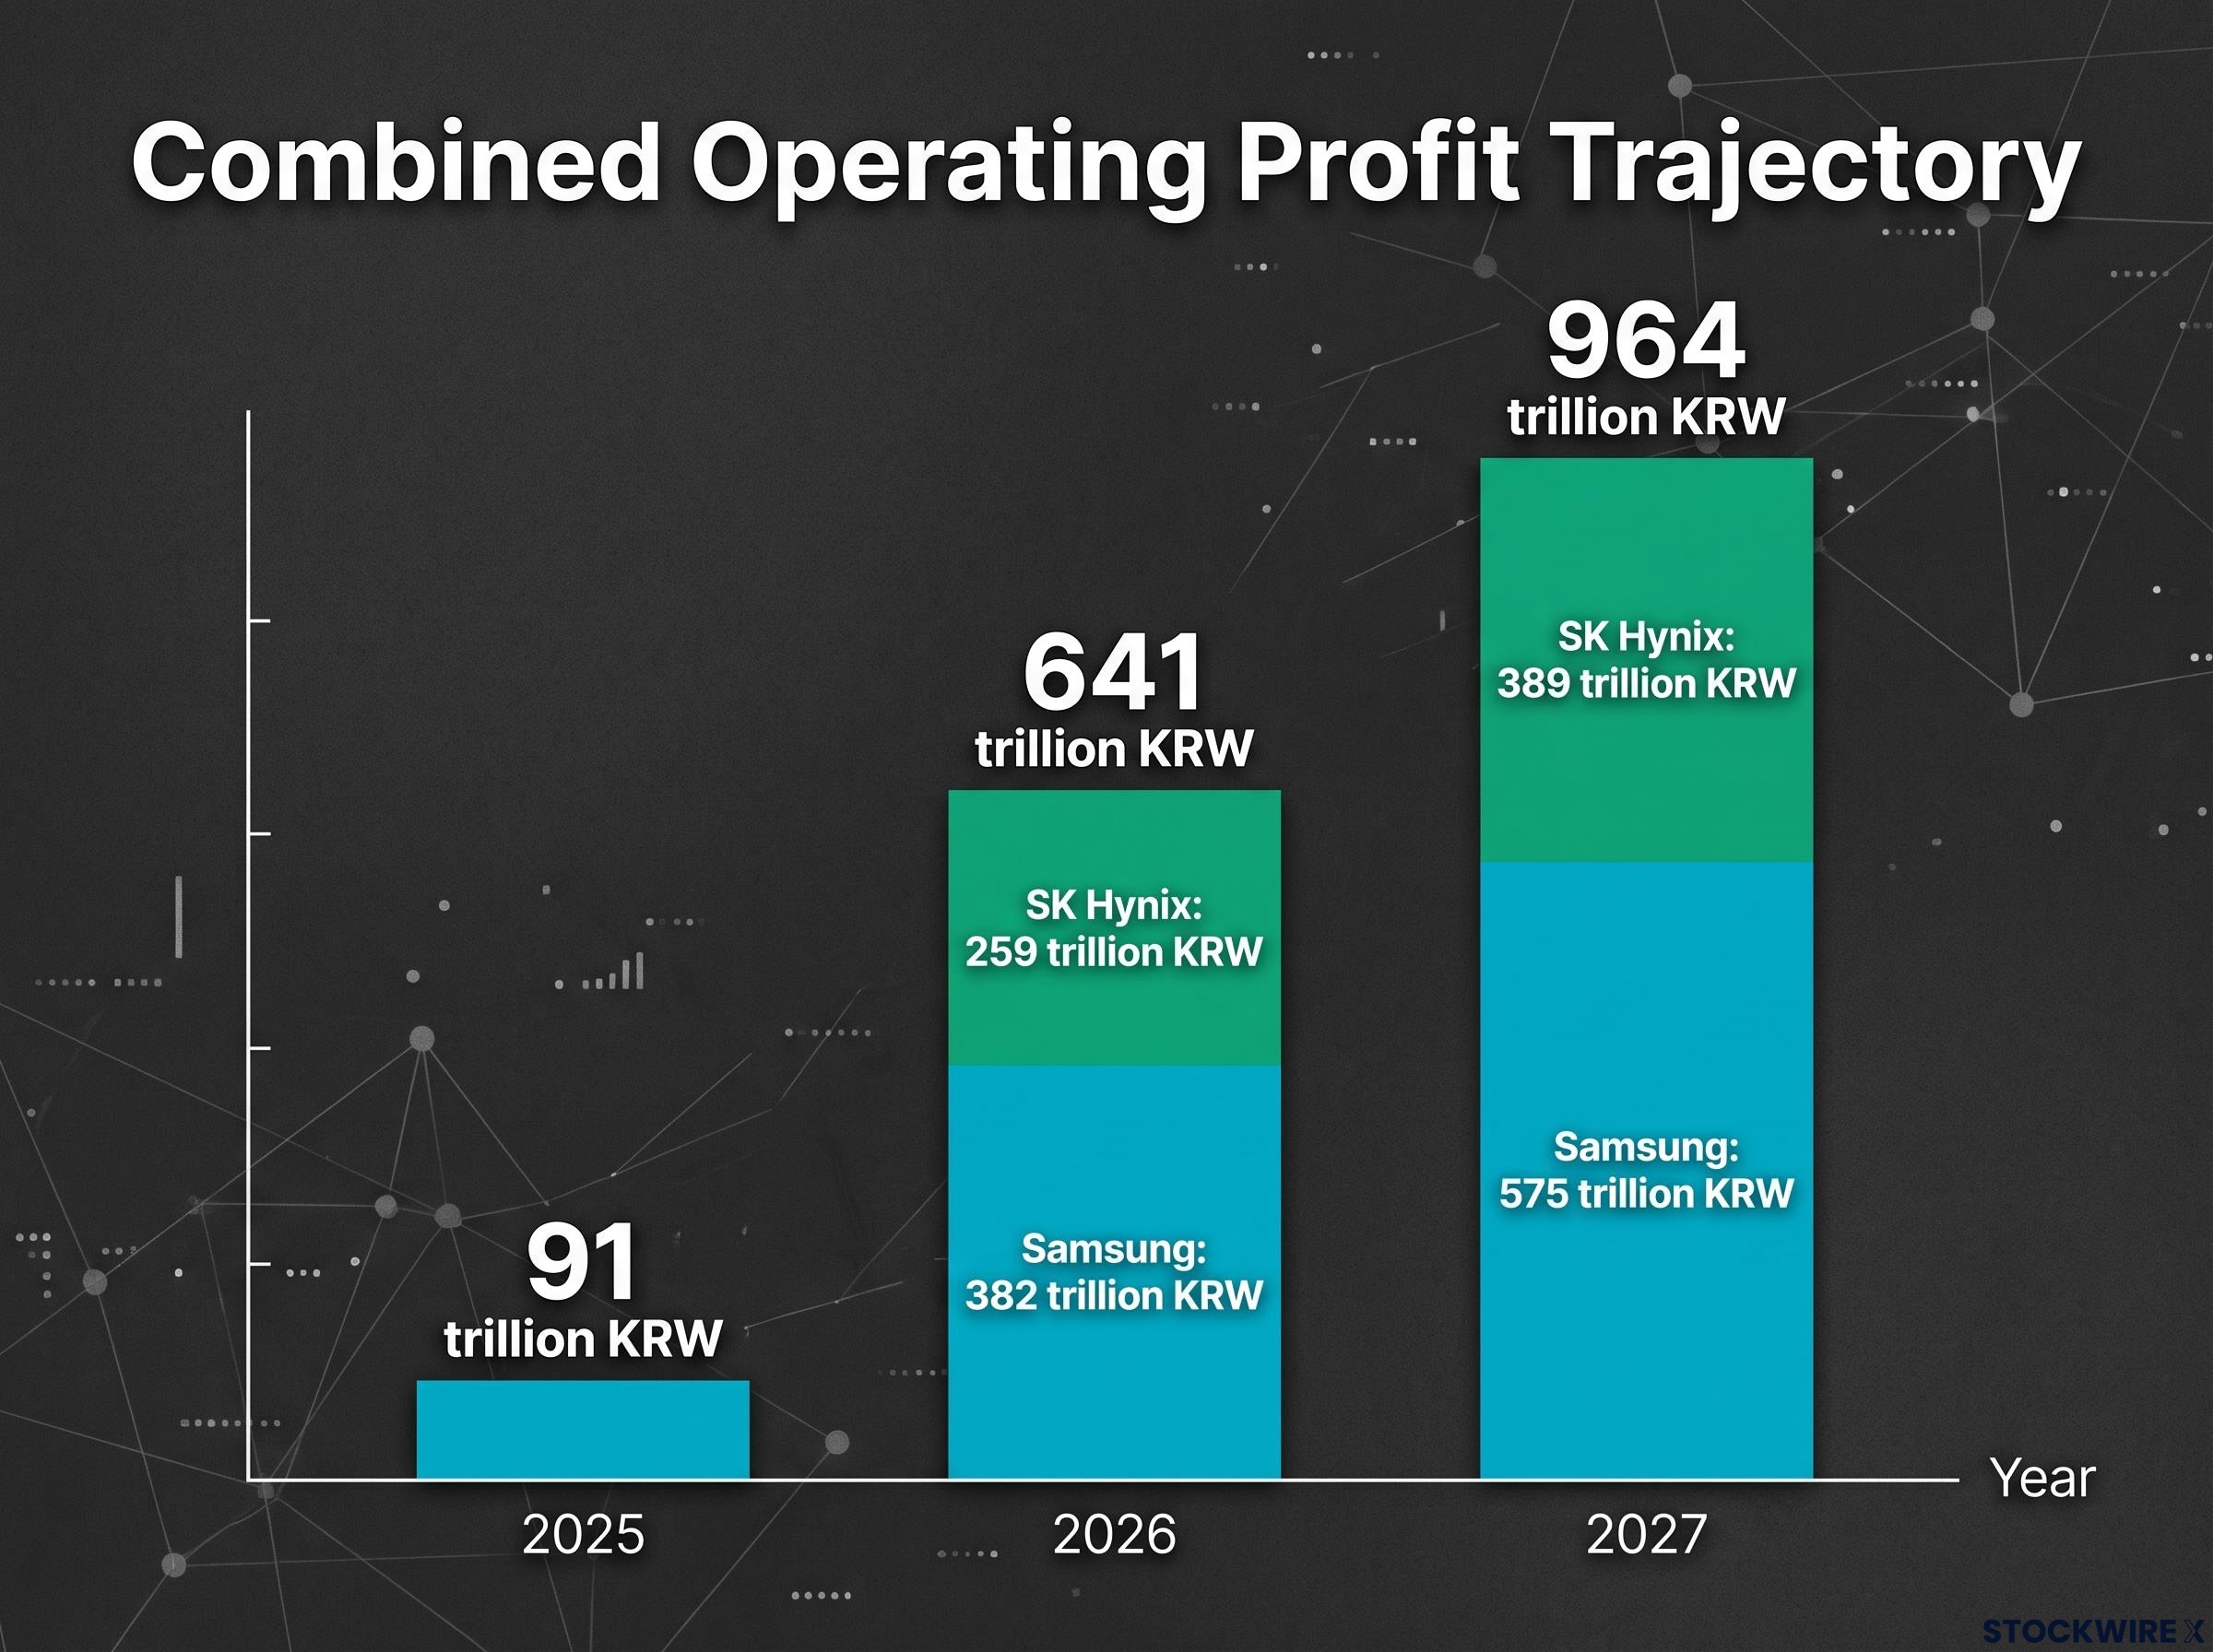
KB’s combined operating profit trajectory for Samsung Electronics and SK Hynix is the quantitative backbone of the thesis, and the numbers build in a way that rewards reading them in sequence.
| Year | Combined Operating Profit | Samsung Electronics | SK Hynix |
|---|---|---|---|
| 2025 | 91 trillion KRW | — | — |
| 2026 | 641 trillion KRW | 382 trillion KRW | 259 trillion KRW |
| 2027 | 964 trillion KRW | 575 trillion KRW | 389 trillion KRW |
Combined operating profit grows more than 10x from 2025 to 2027. KB’s 2027 operating profit projection for Samsung reaches 575 trillion KRW, which is roughly 13.2x the 2025 figure. The equivalent 2027 estimate for SK Hynix of 389 trillion KRW comes to approximately 8.2x its 2025 base.
What makes these projections less speculative than typical sell-side forecasts is the production structure underneath them. Under the terms KB references, each company has locked in more than 60% of its output volume through five-year supply contracts signed with major hyperscale operators. Contracted revenue underpinning the majority of forecast output is a materially different risk profile than spot-market exposure, and that distinction matters when evaluating whether these growth numbers are aspirational or anchored.
Memory industry pricing power is already visible in reported results rather than only in forward estimates: DRAM contract prices surged 90-95% in Q1 2026 and a further 58-63% in Q2 2026, with hyperscalers signing 3-5 year contracts with upfront deposits that treat memory as strategic infrastructure.
Q3 2026 as the first stress test of the thesis
The near-term check arrives in October, when both companies report Q3 2026 results. KB’s estimates set specific benchmarks:
- Samsung Electronics Q3 2026: KB projects 112 trillion KRW in operating profit for the quarter, reflecting year-over-year growth of roughly 817% and a 55% operating margin, which would extend the run of consecutive quarterly records to four.
- SK Hynix Q3 2026: KB’s estimate calls for 77 trillion KRW in operating profit, representing approximately 579% year-over-year growth at a 78% operating margin.
If those estimates are met, they validate the structural demand thesis ahead of the larger 2026-2027 forecast horizon. If they miss, the multi-year trajectory loses credibility at its first public checkpoint.
Why AI memory scarcity is not a typical semiconductor cycle
Memory stocks carry a long history of boom-bust pricing. Margins spike, competitors build capacity, supply floods the market, and margins collapse. That pattern has repeated often enough that many investors apply it reflexively.
KB Securities argues this cycle is structurally different, and the argument rests on specific supply-side mechanics:
- Typical cycle mechanism: Elevated margins attract capacity additions from competitors, eventually flooding the market and compressing margins back to historical norms.
- KB’s structural thesis: AI data-centre infrastructure requires high-bandwidth memory (HBM) and advanced DRAM at a pace that existing and planned capacity cannot satisfy. The usual supply response will be slower and less forceful than in prior cycles because the advanced manufacturing required for HBM4 and HBM4E constrains how quickly production can scale.
KB characterises 2027 as potentially the “tightest” supply year in the 70-year history of the semiconductor industry.
Samsung’s HBM4 and HBM4E production ramp on advanced DRAM nodes is expected to constrain commodity DRAM capacity and sustain elevated margins across multiple years, not just a single peak quarter. KB frames this as a “new phase of structural earnings growth” rather than a traditional cycle peak.
For investors pattern-matching against prior memory downturns, the structural supply constraint KB identifies is the load-bearing element that separates this thesis from a standard cyclical call. If that constraint holds, the mean-reversion playbook does not apply on its usual timeline.
The shareholder return catalyst that KB says will force a re-rating
Capital return programmes change who owns a stock. That is the mechanism KB highlights, not the cash itself.
Samsung Electronics is expected to announce an annual shareholder return programme of 100-200 trillion KRW per year. Jeff Kim’s research indicates that cumulative returns across the following three years could amount to at least 600 trillion KRW in total, supported by a dividend yield forecast to surpass 7%. KB’s published research frames the return as 100-200 trillion KRW annually rather than a fixed three-year total.
KB describes the capital return programme as a mechanism that could act as a significant trigger for share-price appreciation and a meaningful upward re-rating of valuation multiples.
KB draws explicitly on TSMC’s experience, where meaningful capital return announcements expanded institutional ownership and drove multiple expansion. The firm argues Samsung’s programme could trigger a similar dynamic through three mechanisms:
- Institutional inflow trigger: A 7%+ yield from a company trading at 3.7x forward earnings attracts foreign institutional investors who screen on dividend yield and total shareholder return.
- Yield screen attraction: Large, predictable returns bring Samsung into the buy universe of income-focused global funds that currently exclude it.
- Sector-wide re-rating signal: SK Hynix is expected to announce its own programme in the near term, and a combined sector-wide return policy could drive a coordinated re-rating of Korean memory stocks.
A dividend yield above 7% from a company forecasting 10x profit growth over two years is a combination that screens attractively for a very wide universe of institutional mandates. That is precisely the mechanism KB argues will bring new buying pressure into both stocks.
Where KB’s thesis can break, and what to watch for
KB’s conviction is high, but the thesis carries identifiable risks that deserve specific weight:
- Cyclicality and value trap risk: Memory has historically experienced severe boom-bust patterns. A low P/E near peak earnings is a recognised value trap signature. If profits mean-revert, today’s multiples are not cheap; they are misleading.
- Forecast and AI capex risk: KB’s projections are not guarantees. If AI capital expenditure slows, competitors add capacity faster than expected, or demand normalises, the 2026-2027 earnings estimates could prove materially optimistic. If 2027 estimates are revised down substantially, the 3.2-3.7x P/E framing loses much of its analytical force.
- Geopolitical and export control risk: US-China tech tensions and export controls on advanced memory represent a material external factor for both companies’ ability to serve Chinese customers. This risk is not deeply addressed in KB’s published reports.
Cycle reversal risk is the sharpest counterargument to KB’s thesis: SK Hynix’s $29 billion Nasdaq IPO targeting a 60% capacity expansion by 2030 matches the textbook supply response that has historically ended every previous memory upcycle, and Samsung fell roughly 7% in a single session after Q2 2026 results showed decelerating price increases.
KB’s counter-argument is that 40-50% price corrections and compressed multiples already absorb much of the cyclical and macro risk, while the upside from structural AI memory demand and shareholder returns remains unpriced. Whether the broader market agrees, and on what timeline, remains uncertain.
This article is for informational purposes only and should not be considered financial advice. Investors should conduct their own research and consult with financial professionals before making investment decisions. These forward-looking statements and earnings projections are subject to change based on market developments and company performance.
Two variables that will determine whether KB’s thesis plays out by year-end
KB’s framework is unusual for a thesis of this magnitude: the confirming events are identifiable in advance and near-term. Two specific variables will determine whether the re-rating materialises:
- Q3 2026 earnings delivery (reported in October 2026):
- Samsung benchmark: 112 trillion KRW operating profit
- SK Hynix benchmark: 77 trillion KRW operating profit
- A material miss on either figure weakens the multi-year trajectory that underpins the entire valuation case.
- Samsung Electronics shareholder return policy announcement:
- Scale threshold: 100-200 trillion KRW per year
- The timing, structure, and size of this announcement will determine how quickly the institutional re-rating KB anticipates can begin.
KB frames the current price level, following Samsung’s roughly 49% drawdown, as the end of the correction phase. For investors deciding whether to engage with this thesis now or wait for confirmation, the implication is specific: the two confirming events are dateable, meaning the cost of waiting is the pre-announcement price move that KB argues constitutes the primary re-rating trigger.