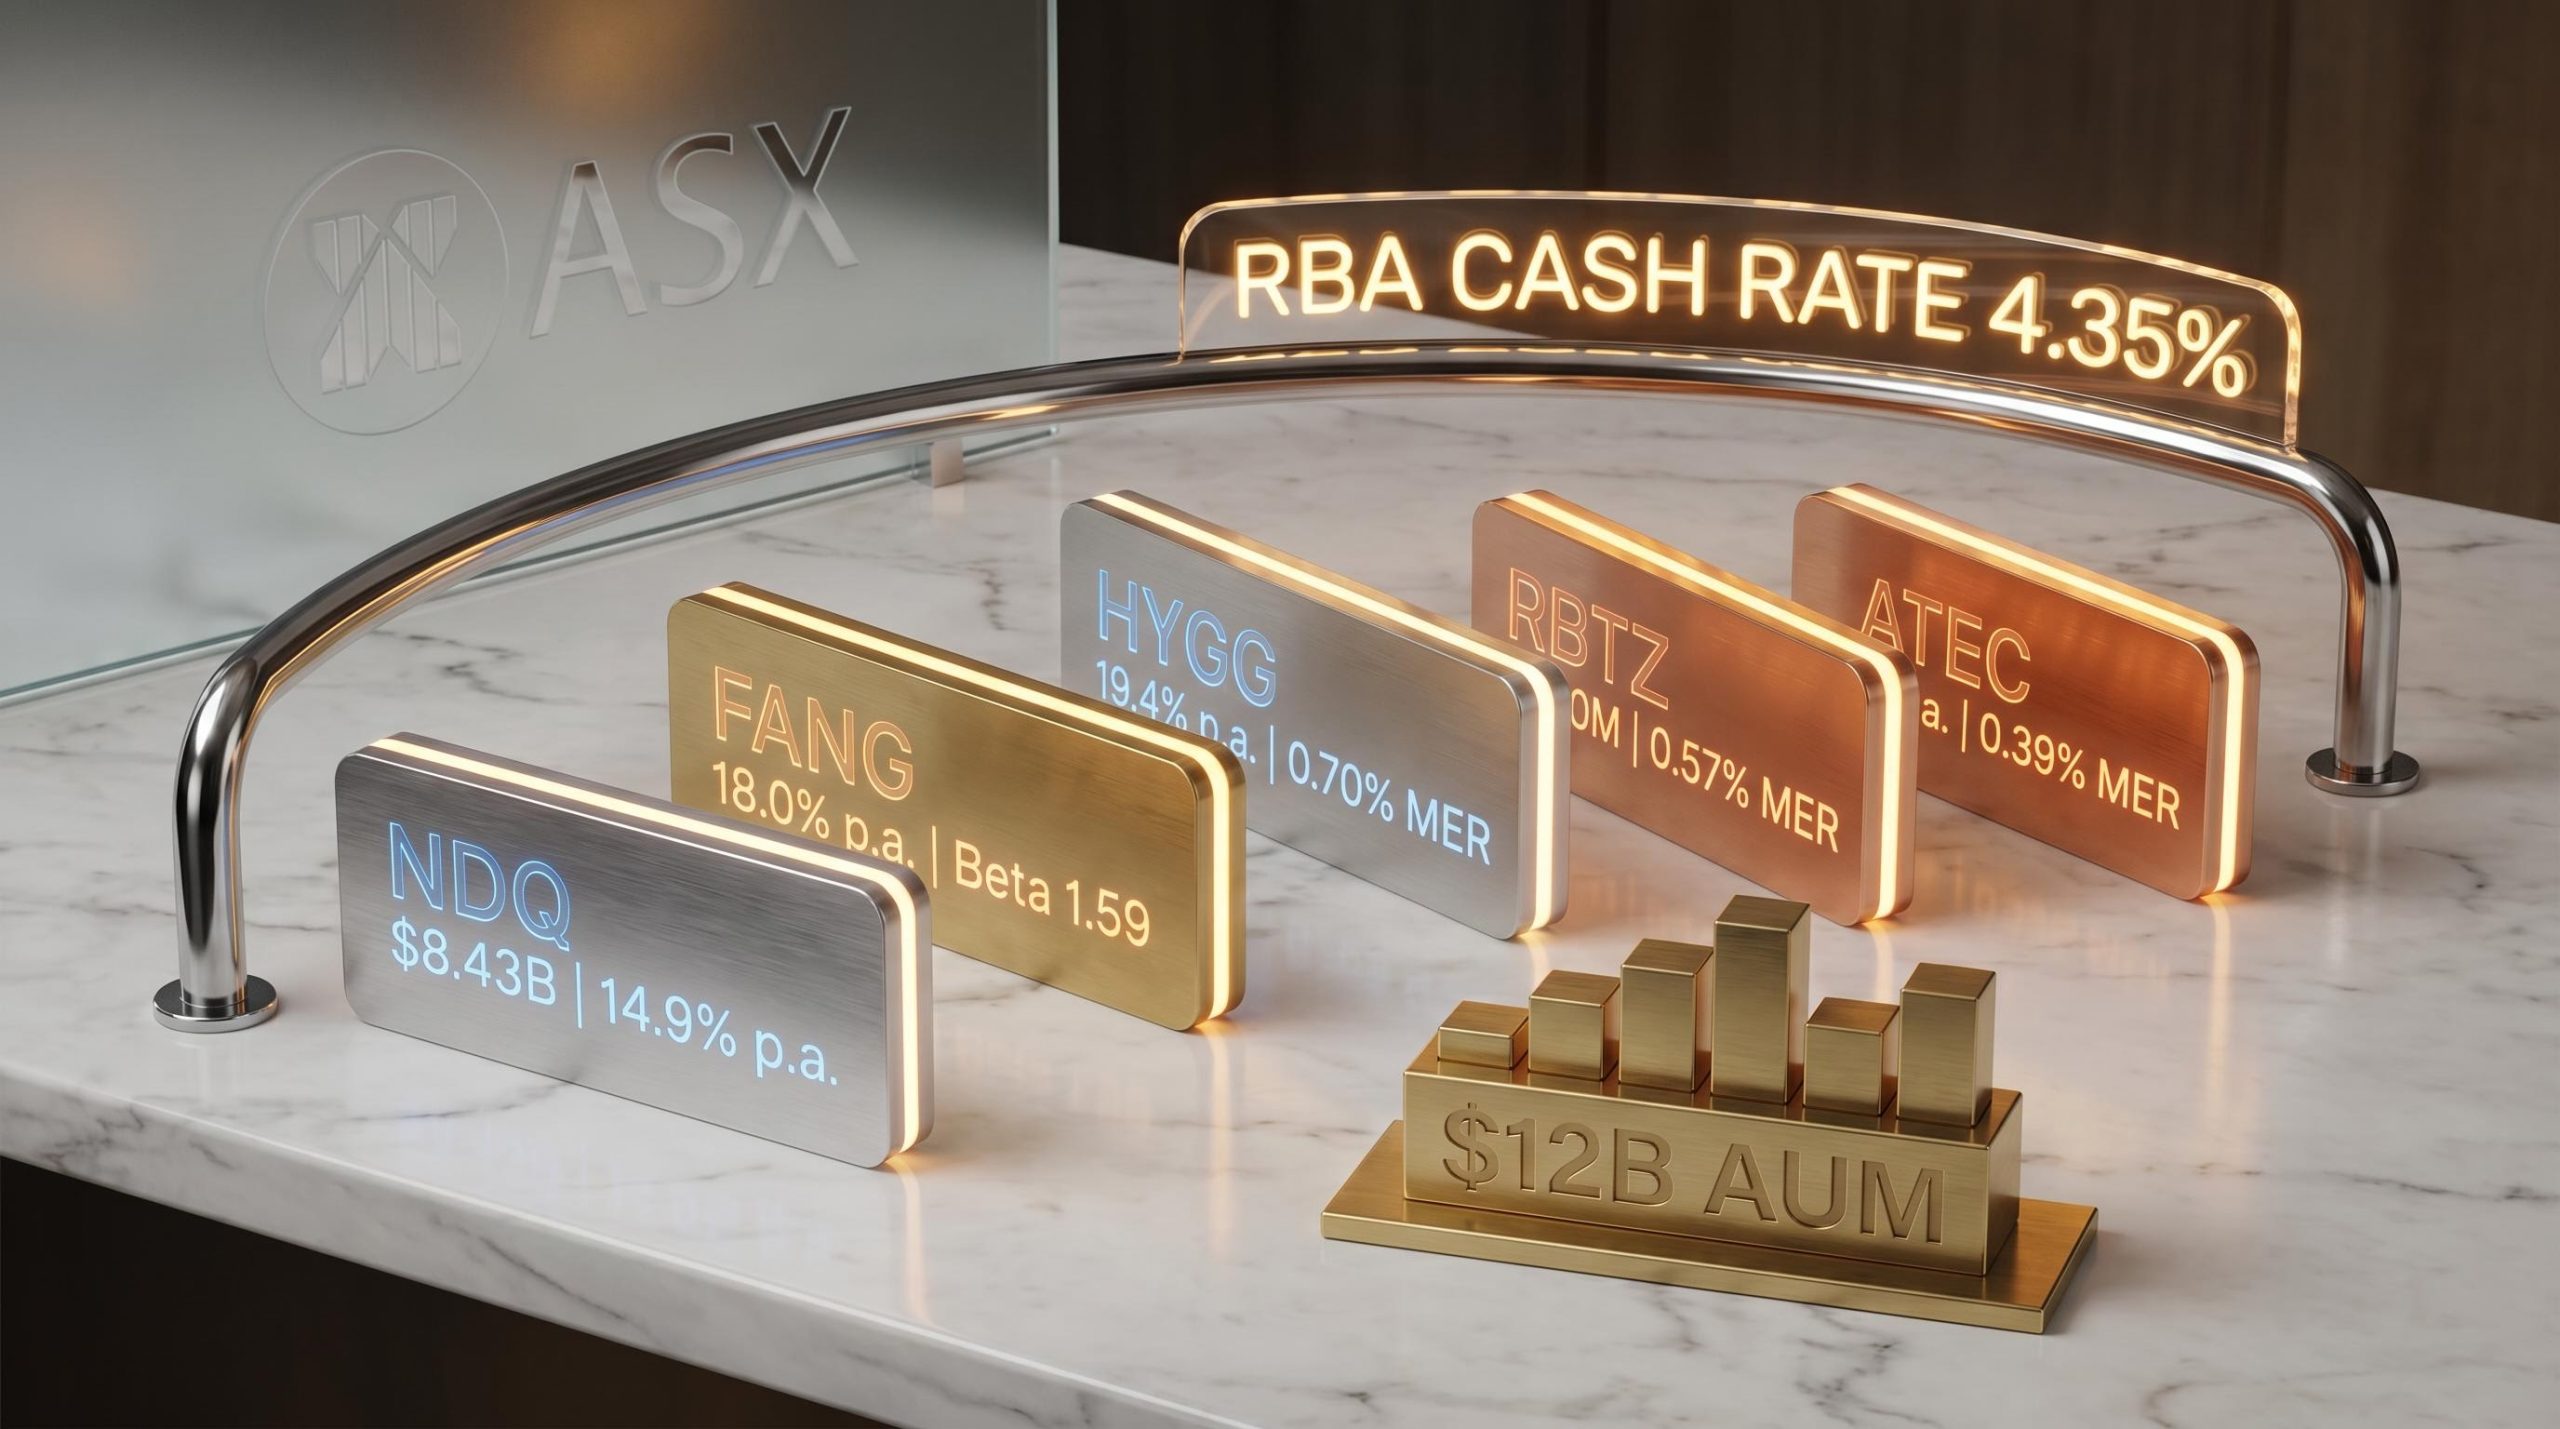
Australian investors have poured billions into growth ETFs over the past two years, riding AI tailwinds and Nasdaq momentum to returns that made the allocation decision feel obvious. The RBA’s third consecutive rate hike in 2026, lifting the cash rate to 4.35% on 5 May 2026, has changed that calculation. High-multiple, long-duration equities, the very companies that dominate growth ETF holdings, face direct discount rate pressure that was absent during the boom years. The question for investors is no longer simply “which growth ETF?” but which growth ETF serves which purpose, at what level of risk, and within what portfolio structure. With assets under management across the five leading ASX growth ETFs now collectively exceeding $12 billion, the stakes of getting this wrong have grown alongside investor enthusiasm. What follows is a ranking of the five most significant growth ETFs available on the ASX, the numbers that matter for each, and a framework for how growth exposure should sit inside a portfolio built to last across cycles.
What actually counts as a growth ETF on the ASX
No ASX-listed ETF exclusively tracks a dedicated growth index in the way the S&P 500 Growth Index operates in the United States. Instead, Australian investors access growth exposure through broad index ETFs with heavy tech weightings, active funds with growth mandates, and thematic ETFs targeting structural trends such as artificial intelligence. The result is that the label “growth ETF” covers a broad spectrum of risk profiles, and treating every tech-tilted product as equivalent is a common mistake.
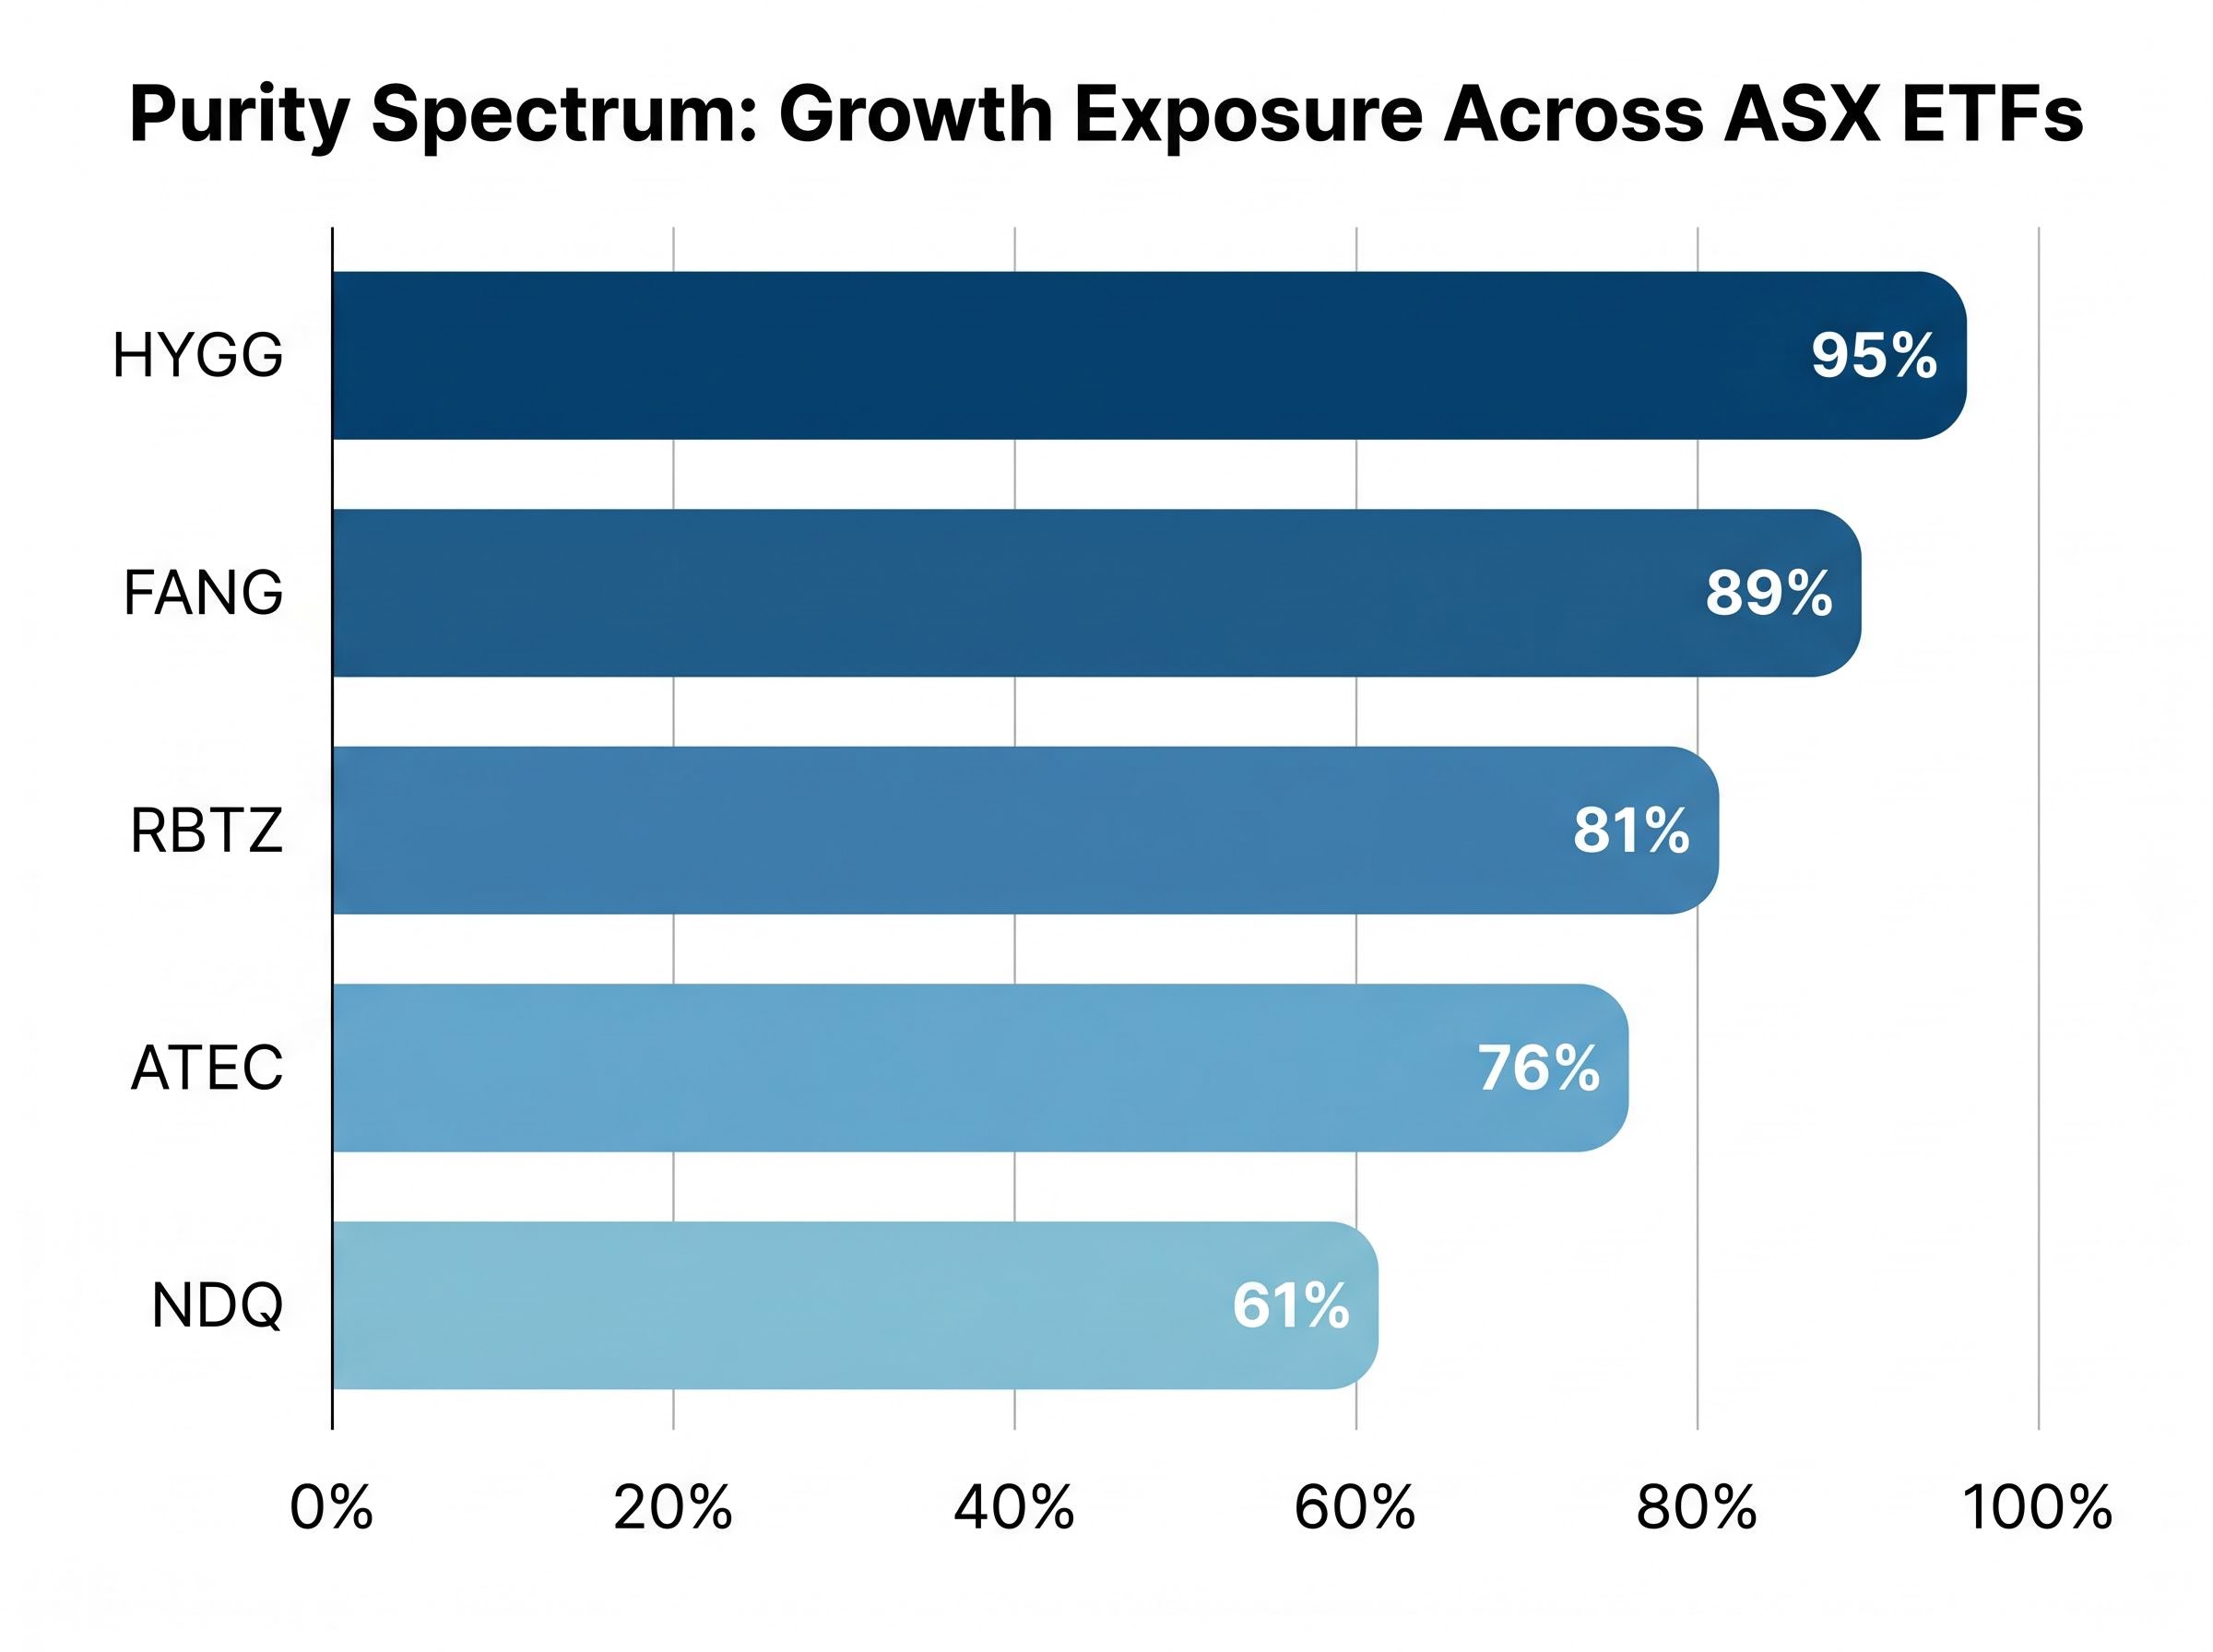
Growth company exposure across the five ETFs ranked here ranges from 40% to 95%:
- HYGG: 95% growth company exposure
- FANG: 89% growth company exposure
- RBTZ: 81% growth company exposure
- ATEC: 76% growth company exposure
- NDQ: 61% growth company exposure
Management expense ratios across the 13 identified ASX growth ETFs range from 0.35% to 1.35% per annum. Fee dispersion at that scale compounds meaningfully over a decade. Passive ETFs dominate the lower end of that range, while active funds such as HYGG charge a premium for stock selection, a trade-off worth scrutinising given that more than 80% of active fund managers fail to outperform their benchmarks over time.
SPIVA Australia Year-End 2025 data from S&P Dow Jones Indices shows that over 15-year periods, 87% of Australian Equity General Funds and more than 95% of Global Equity General Funds failed to outperform their respective benchmarks, a persistence of underperformance that sharpens the cost-benefit scrutiny any active growth ETF must face.
When big ASX news breaks, our subscribers know first
Five leading growth ETFs on the ASX: a comparative ranking
The five ETFs ranked below were selected and ordered using four criteria: assets under management (as a proxy for liquidity and investor confidence), five-year annualised return, management expense ratio, and beta as a measure of volatility relative to the broader market. All five are primarily exposed to USD-denominated assets, meaning unhedged AUD/USD currency fluctuations represent a shared characteristic and a shared risk.
| Ticker | AUM | 5-Year Return (p.a.) | MER | Beta |
|---|---|---|---|---|
| NDQ | $8.43B | 14.9% | 0.48% | 1.21 |
| FANG | $1.8B | 18.0% | 0.35% | 1.59 |
| HYGG | $1.1B | — | 0.70% | — |
| RBTZ | $450M | 2.1% | 0.57% | — |
| ATEC | $320M | 0.1% | 0.39% | — |
“The RBA raised the cash rate to 4.35% on 5 May 2026, its third consecutive hike in 2026, creating a direct headwind for long-duration growth assets.”
Year-to-date returns tell a compressed story: NDQ sits at 4.65% and FANG at 1.03% as of early 2026. These figures reflect the RBA hiking environment squeezing growth multiples rather than a structural collapse in the underlying businesses.
Growth ETFs alone are not a portfolio: the case for blending
In 2025, S&P 500 Growth returned approximately +25% versus Value’s +12%, according to Morningstar data. Global growth outperformed value by approximately 14% across the full year on MSCI ACWI data. Those numbers make growth allocation look effortless in hindsight.
The problem is that style leadership rotates. The same rate environment now compressing growth multiples could favour value-oriented sectors for the next several years, and forecasting that rotation reliably is something even professional fund managers struggle to do. Growth ETFs can produce drawdowns exceeding 50% in adverse conditions, a risk that pure-growth portfolios absorb fully.
The structural solution is blending. Broad Australian and global share ETFs combined with a measured growth satellite allocation remove the need to forecast which style leads next.
Core ASX ETF portfolio construction typically anchors on a small number of broad, low-cost funds before any satellite allocation is added: a domestic equity base such as A200, paired with global exposure through VGS, keeps the weighted MER of the entire portfolio below 0.25% even after a growth satellite is layered in.
| Asset Class | Example ETF(s) | Role in Portfolio |
|---|---|---|
| Australian equities | VAS | Domestic core, franking credits |
| Global equities | IOO | International diversification |
| Growth satellite | NDQ or HYGG | Targeted growth exposure |
Stockspot’s Turquoise Balanced Portfolio, as of 31 March 2026, allocated just 22% to growth-style assets, 43% to blended holdings, and 35% to value, even within a portfolio designed for long-term capital appreciation. Three reasons support this approach:
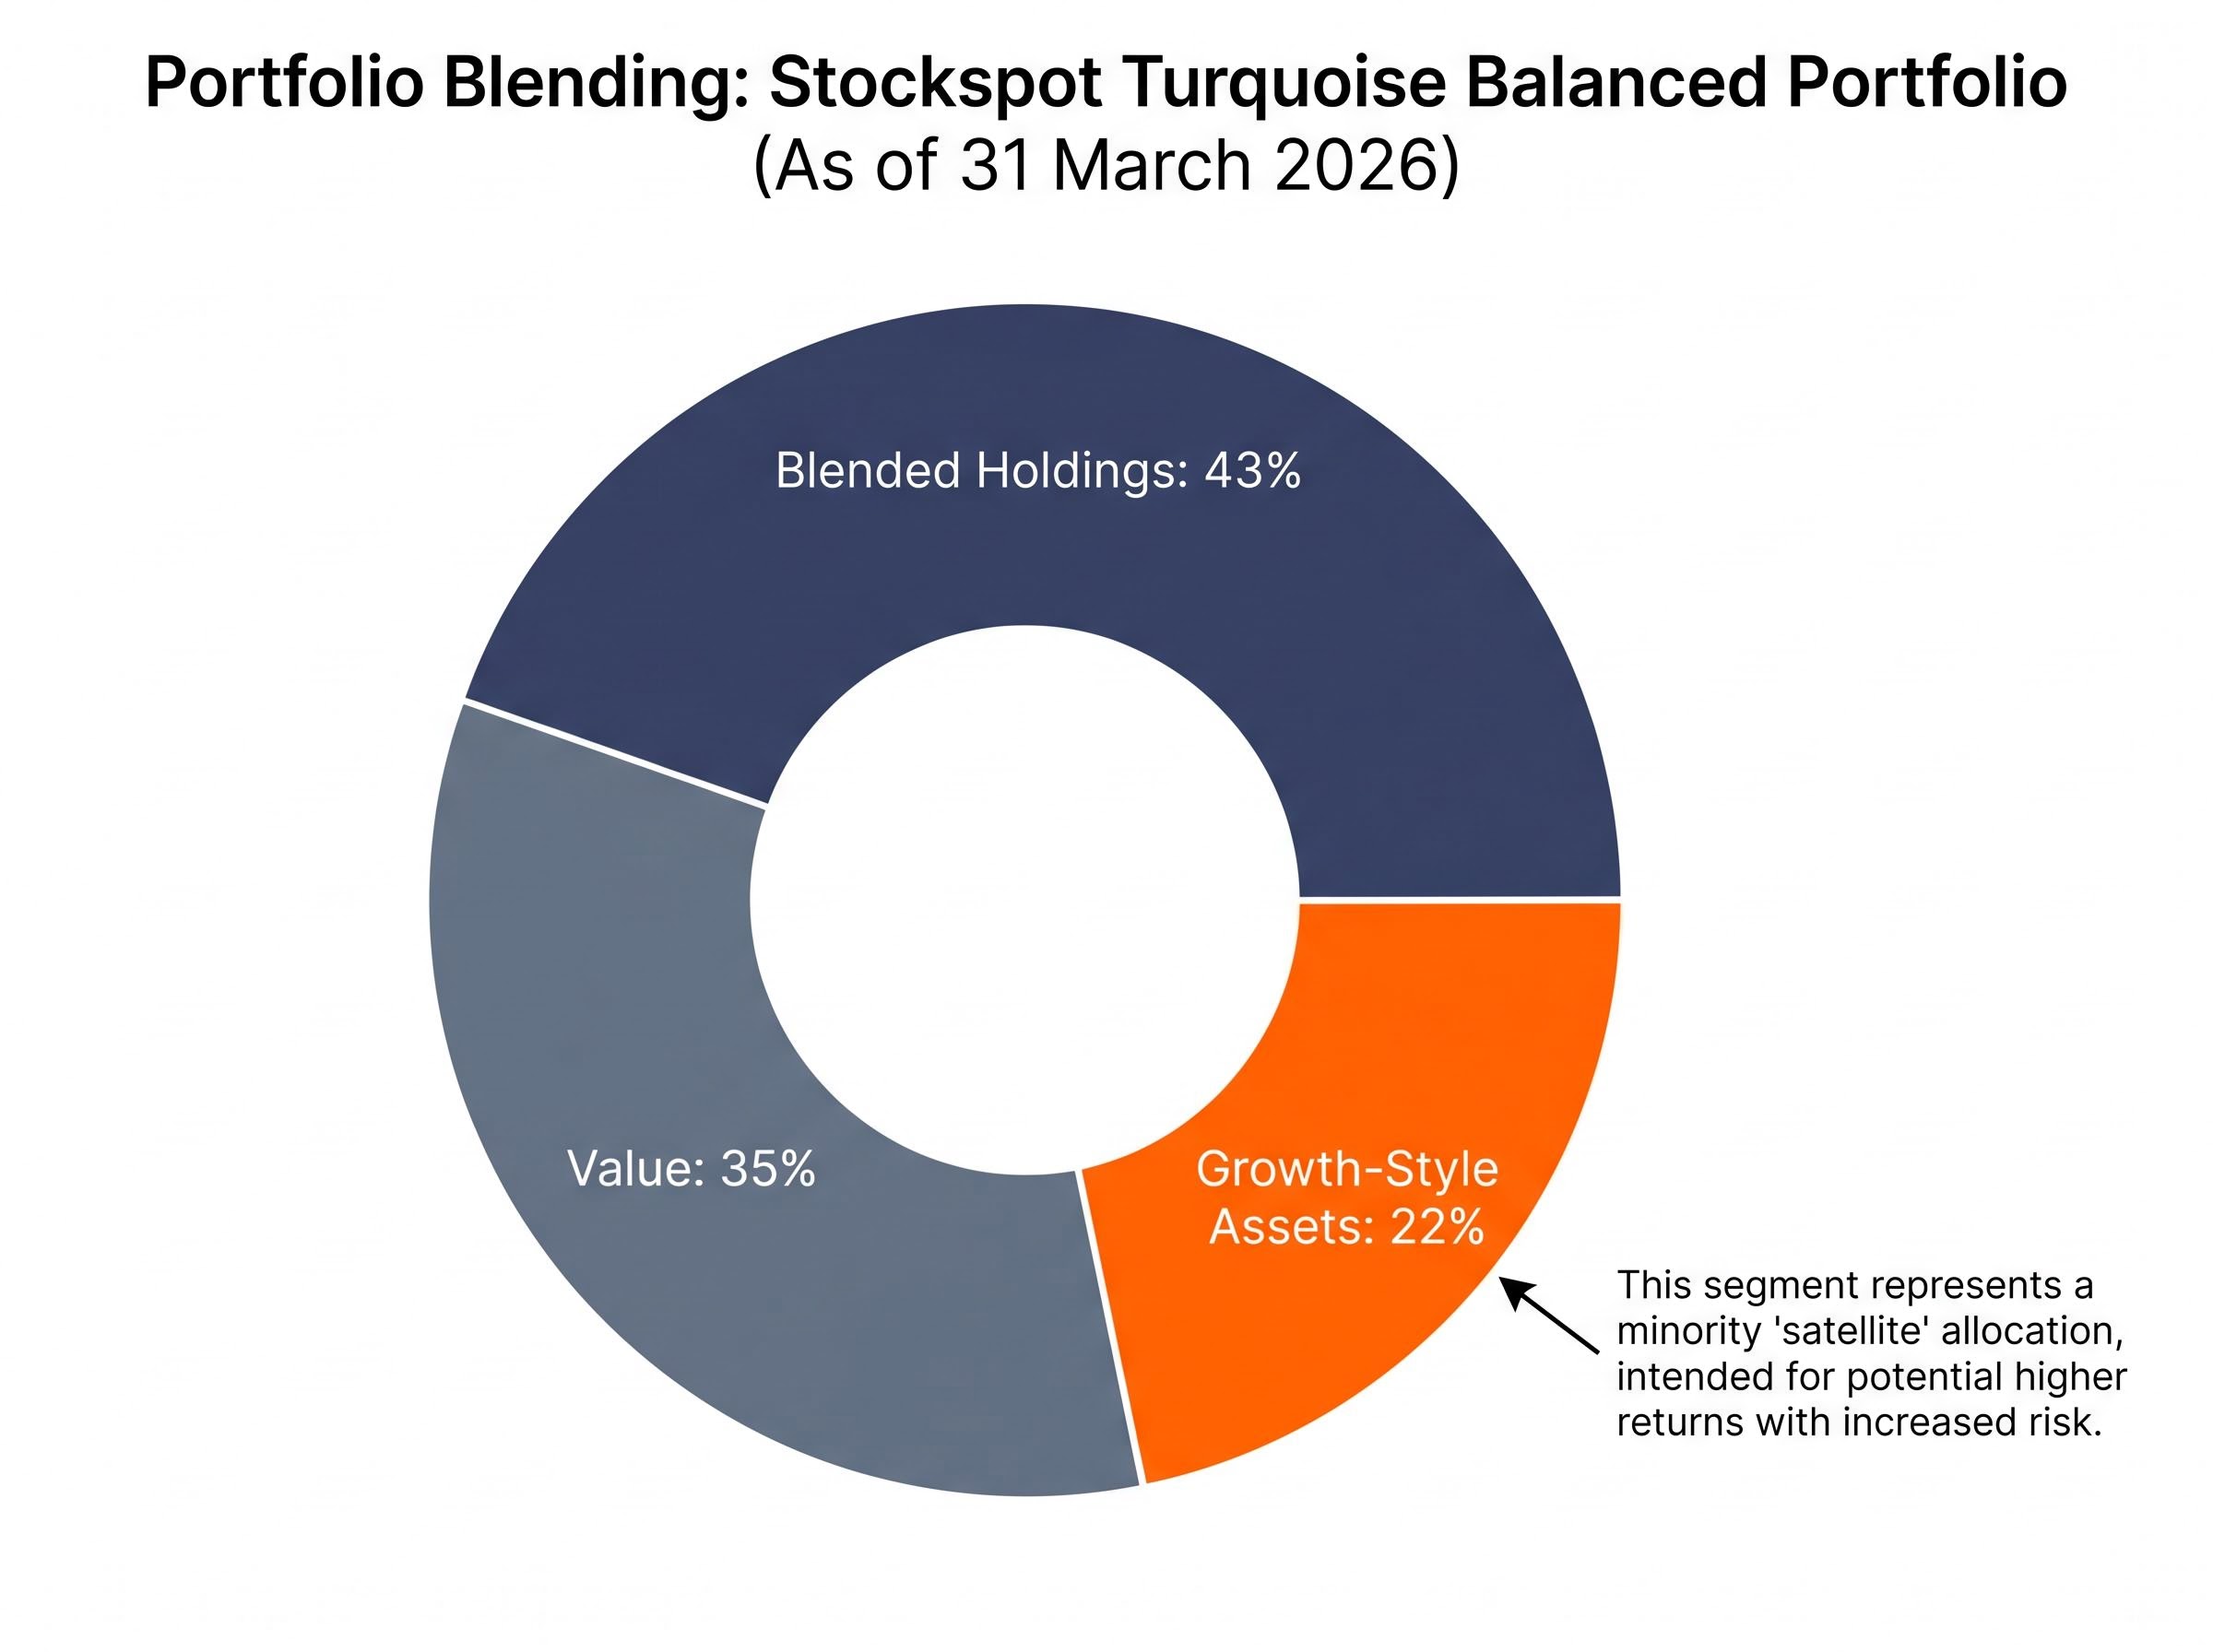
- Market cycles alternate between growth and value leadership, making style concentration a timing bet
- Blended portfolios limit drawdown severity when the growth cycle turns
- Removing style-timing decisions reduces behavioural error, the largest source of retail investor underperformance
NDQ and FANG: the two biggest bets on US mega-cap tech
NDQ, the BetaShares Nasdaq 100 ETF, is the largest growth ETF on the ASX by a wide margin. Its $8.43 billion in assets under management reflects its position as the default retail vehicle for US tech exposure. The fund charges a 0.48% MER, carries a beta of 1.21, and has delivered a 14.9% five-year annualised return. Its holdings are anchored by Microsoft and Nvidia, with approximately 35% of the portfolio weighted toward the technology sector.
NDQ‘s breadth across 100 Nasdaq-listed names provides diversification relative to more concentrated alternatives. Its 4.65% YTD return in 2026 reflects rate-driven multiple compression, not earnings deterioration.
Concentration risk within NDQ is less obvious than the 100-stock count implies: the fund’s top 10 holdings represent approximately 50% of the portfolio, meaning investors are making a heavily weighted bet on a small number of technology mega-caps rather than the diversified basket the headline figure suggests.
FANG: higher ceiling, higher floor risk
FANG, the Global X FANG+ ETF, holds just 10 mega-cap names and concentrates the bet. Its $1.8 billion AUM is a fraction of NDQ‘s, but its 18.0% five-year annualised return is the strongest in this comparison. The MER sits at 0.35%, the lowest of the five. Net Q1 2026 inflows of approximately $180 million indicate sustained conviction.
The trade-off is beta. At 1.59, a 10% market decline historically amplifies to approximately 15.9% for FANG holders. Retail investor forums including r/AusFinance and Whirlpool have flagged the fund as “too volatile for core holdings,” a sentiment that captures the concentration mechanic: with 10 names, a single earnings miss or regulatory action can move the entire fund materially.
A hedged variant, HNDQ, exists for NDQ as a currency risk management option. No equivalent hedged product is available for FANG.
- AUM: NDQ $8.43B vs. FANG $1.8B
- MER: NDQ 0.48% vs. FANG 0.35%
- Beta: NDQ 1.21 vs. FANG 1.59
- 5-year return: NDQ 14.9% vs. FANG 18.0%
- Holdings: NDQ approximately 100 names vs. FANG 10 names
The NDQ vs. FANG choice is effectively a question of how much single-name and sector concentration an investor is willing to accept in exchange for a higher historical return ceiling.
HYGG, RBTZ, and ATEC: active conviction, thematic AI, and domestic tech
- HYGG (Hyperion Global Growth Companies Fund) is the active high-conviction option. With $1.1 billion in AUM and a 0.70% MER, it is the most expensive fund in this comparison. The cost has been justified by results: Hyperion delivered 19.4% per annum over three years to March 2026, among the strongest active growth fund results available on the ASX. YTD inflows of approximately $120 million suggest investors are willing to pay for the manager’s stock selection. At 95% growth company exposure, this is the most concentrated growth bet in the ranking by style purity.
“Hyperion’s HYGG delivered 19.4% p.a. over three years to March 2026, among the strongest active growth fund results available on the ASX.”
- RBTZ (BetaShares Global Robotics & Artificial Intelligence ETF) serves the structurally bullish AI investor. At $450 million AUM and a 0.57% MER, it sits mid-range on both size and cost. TSMC and AMD Q1 2026 earnings beats added approximately 5% to the fund’s performance, demonstrating how thematic concentration can pay off when the thesis delivers. Its three-year annualised return of 8.1% and five-year return of 2.1% reflect the fact that the AI investment cycle is still maturing. YTD inflows of approximately $75 million show growing structural interest.
Investors wanting to stress-test the structural AI thesis before sizing a position in RBTZ or any thematic fund will find our deep-dive into AI thematic ETF risk on the ASX, which draws on dot-com era data to examine why being correct about a transformative technology does not reliably translate into identifying the winning companies, and includes return comparisons across GXAI, NDQ, and IVV.
ATEC: the case for keeping it local
- ATEC (BetaShares S&P/ASX Australian Technology ETF) offers something none of its peers do: AUD-native tech exposure without the currency drag that affects every international ETF in this ranking. At $320 million AUM and a 0.39% MER, it is the smallest and second-cheapest option. Its approximately +16% YTD return in 2026 contrasts sharply with a 0.1% five-year annualised return, a spread that illustrates the cyclicality of domestic tech exposure. Investors should treat ATEC as a tactical satellite position rather than a core growth holding given this return history.
The risk factors every growth ETF investor needs to price in for 2026
The historical return figures cited throughout this article were produced in a fundamentally different environment. The 2020-2021 growth ETF boom unfolded against near-zero interest rates. The 2026 environment, with the RBA at 4.35% and rising, represents a structural headwind that compresses the multiples applied to future earnings streams.
Four specific risk factors deserve attention:
- Rate sensitivity: Growth ETFs are long-duration assets. Each rate increase lifts the discount rate applied to earnings that arrive years into the future, directly compressing the valuations of the high-P/E companies that dominate these funds.
- Currency exposure: NDQ, FANG, HYGG, and RBTZ are all primarily exposed to USD-denominated assets. AUD/USD fluctuations can materially amplify or compress returns, and none of these four funds fully insulate investors from this risk.
- Sector and name concentration: FANG‘s 10-name portfolio, NDQ‘s 35% technology sector weighting, and the overlap of Nvidia and Microsoft across multiple ETFs in the same portfolio create layered concentration that may not be obvious at a glance.
- Fee drag over long horizons: HYGG at 0.70% versus ATEC at 0.39% may appear marginal in any single year. Over a 10-year horizon at a 7% base return, that differential compounds to a meaningful dollar difference in terminal wealth.
The RBA’s May 2026 rate decision, which passed with eight of nine Board members voting for the hike, left forward guidance deliberately open-ended, preserving optionality on whether a fourth consecutive increase follows in July and keeping Q2 CPI data as the critical input for investors.
“Goldman Sachs has flagged a bubble risk scenario if Magnificent 7 earnings growth decelerates from the forecast +22% to approximately 12%.”
The S&P 500 tech sector trades at a forward P/E of approximately 23.62x as of mid-2026. That valuation assumes continued earnings delivery. If AI-driven revenue growth disappoints relative to elevated expectations, the multiple compression could be swift, and high-beta funds such as FANG would amplify the move.
How to choose the right growth ETF for your portfolio
The choice between these five ETFs reduces to three investor-specific variables: risk tolerance (proxied by beta preference), investment horizon (longer horizons absorb more volatility), and fee sensitivity (the compounding impact of MER differentials over 10-plus years).
- NDQ suits investors seeking core broad growth exposure with moderate beta (1.21) and the liquidity of an $8.43 billion fund
- FANG fits high-conviction tech investors who accept beta of 1.59 and 10-name concentration in exchange for the strongest five-year return (18.0%)
- HYGG serves investors with conviction in active management and willingness to pay 0.70% for a manager delivering 19.4% per annum over three years
- RBTZ fills a structural AI allocation for investors who want thematic specificity beyond broad Nasdaq exposure
- ATEC works as a tactical domestic satellite position for investors seeking AUD-native tech exposure, noting its 0.1% five-year return as a caution
The range in outcomes is wide. FANG‘s 18.0% five-year annualised return and ATEC‘s 0.1% sit at opposite ends of the spectrum, illustrating how much the specific product choice matters within the growth category.
“HGEN’s 101.2% one-year return and CRYP’s swing from +78.5% to -1.6% in a single quarter are reminders that thematic ETF outperformance can reverse violently.”
No growth ETF should be held as a whole portfolio. The highest-returning ETF in any five-year window is not necessarily the right choice for the next five years.
Growth ETFs can earn a place in any portfolio, but only with clear eyes on the conditions ahead
The five ETFs ranked here represent legitimate, well-governed, liquid investment options with real track records. Collective AUM exceeding $12 billion confirms that Australian investors have broadly endorsed these products. The risk discussion throughout this article is about sizing and context, not avoidance.
ASIC regulatory guide RG 282 for exchange traded products, published in November 2025, consolidates the disclosure and portfolio transparency obligations that ETP issuers including ETF providers must meet, establishing the governance framework within which all five funds ranked here operate.
Two structural themes should inform every allocation decision from here. The RBA at 4.35% creates near-term discount rate pressure on the very companies these ETFs hold. And the growth-value cycle alternation, visible in 2025‘s 14% MSCI ACWI growth outperformance that has already compressed in 2026, means buying what worked last year is not a strategy.
“As of March 2026, a well-regarded Australian robo-adviser held only 22% in growth-style assets, even within a portfolio designed for long-term capital appreciation.”
The practical next steps are specific. Define the role for growth ETFs in a portfolio as a satellite allocation, not the core. Choose the product that matches beta tolerance and fee sensitivity. Ensure the rest of the portfolio provides the value and income ballast that growth ETFs, by design, cannot.
This article is for informational purposes only and should not be considered financial advice. Investors should conduct their own research and consult with financial professionals before making investment decisions. Past performance does not guarantee future results. Financial projections are subject to market conditions and various risk factors.