SpaceX’s $2.1T IPO Exposes a Structural AI Valuation Problem
51 mins ago
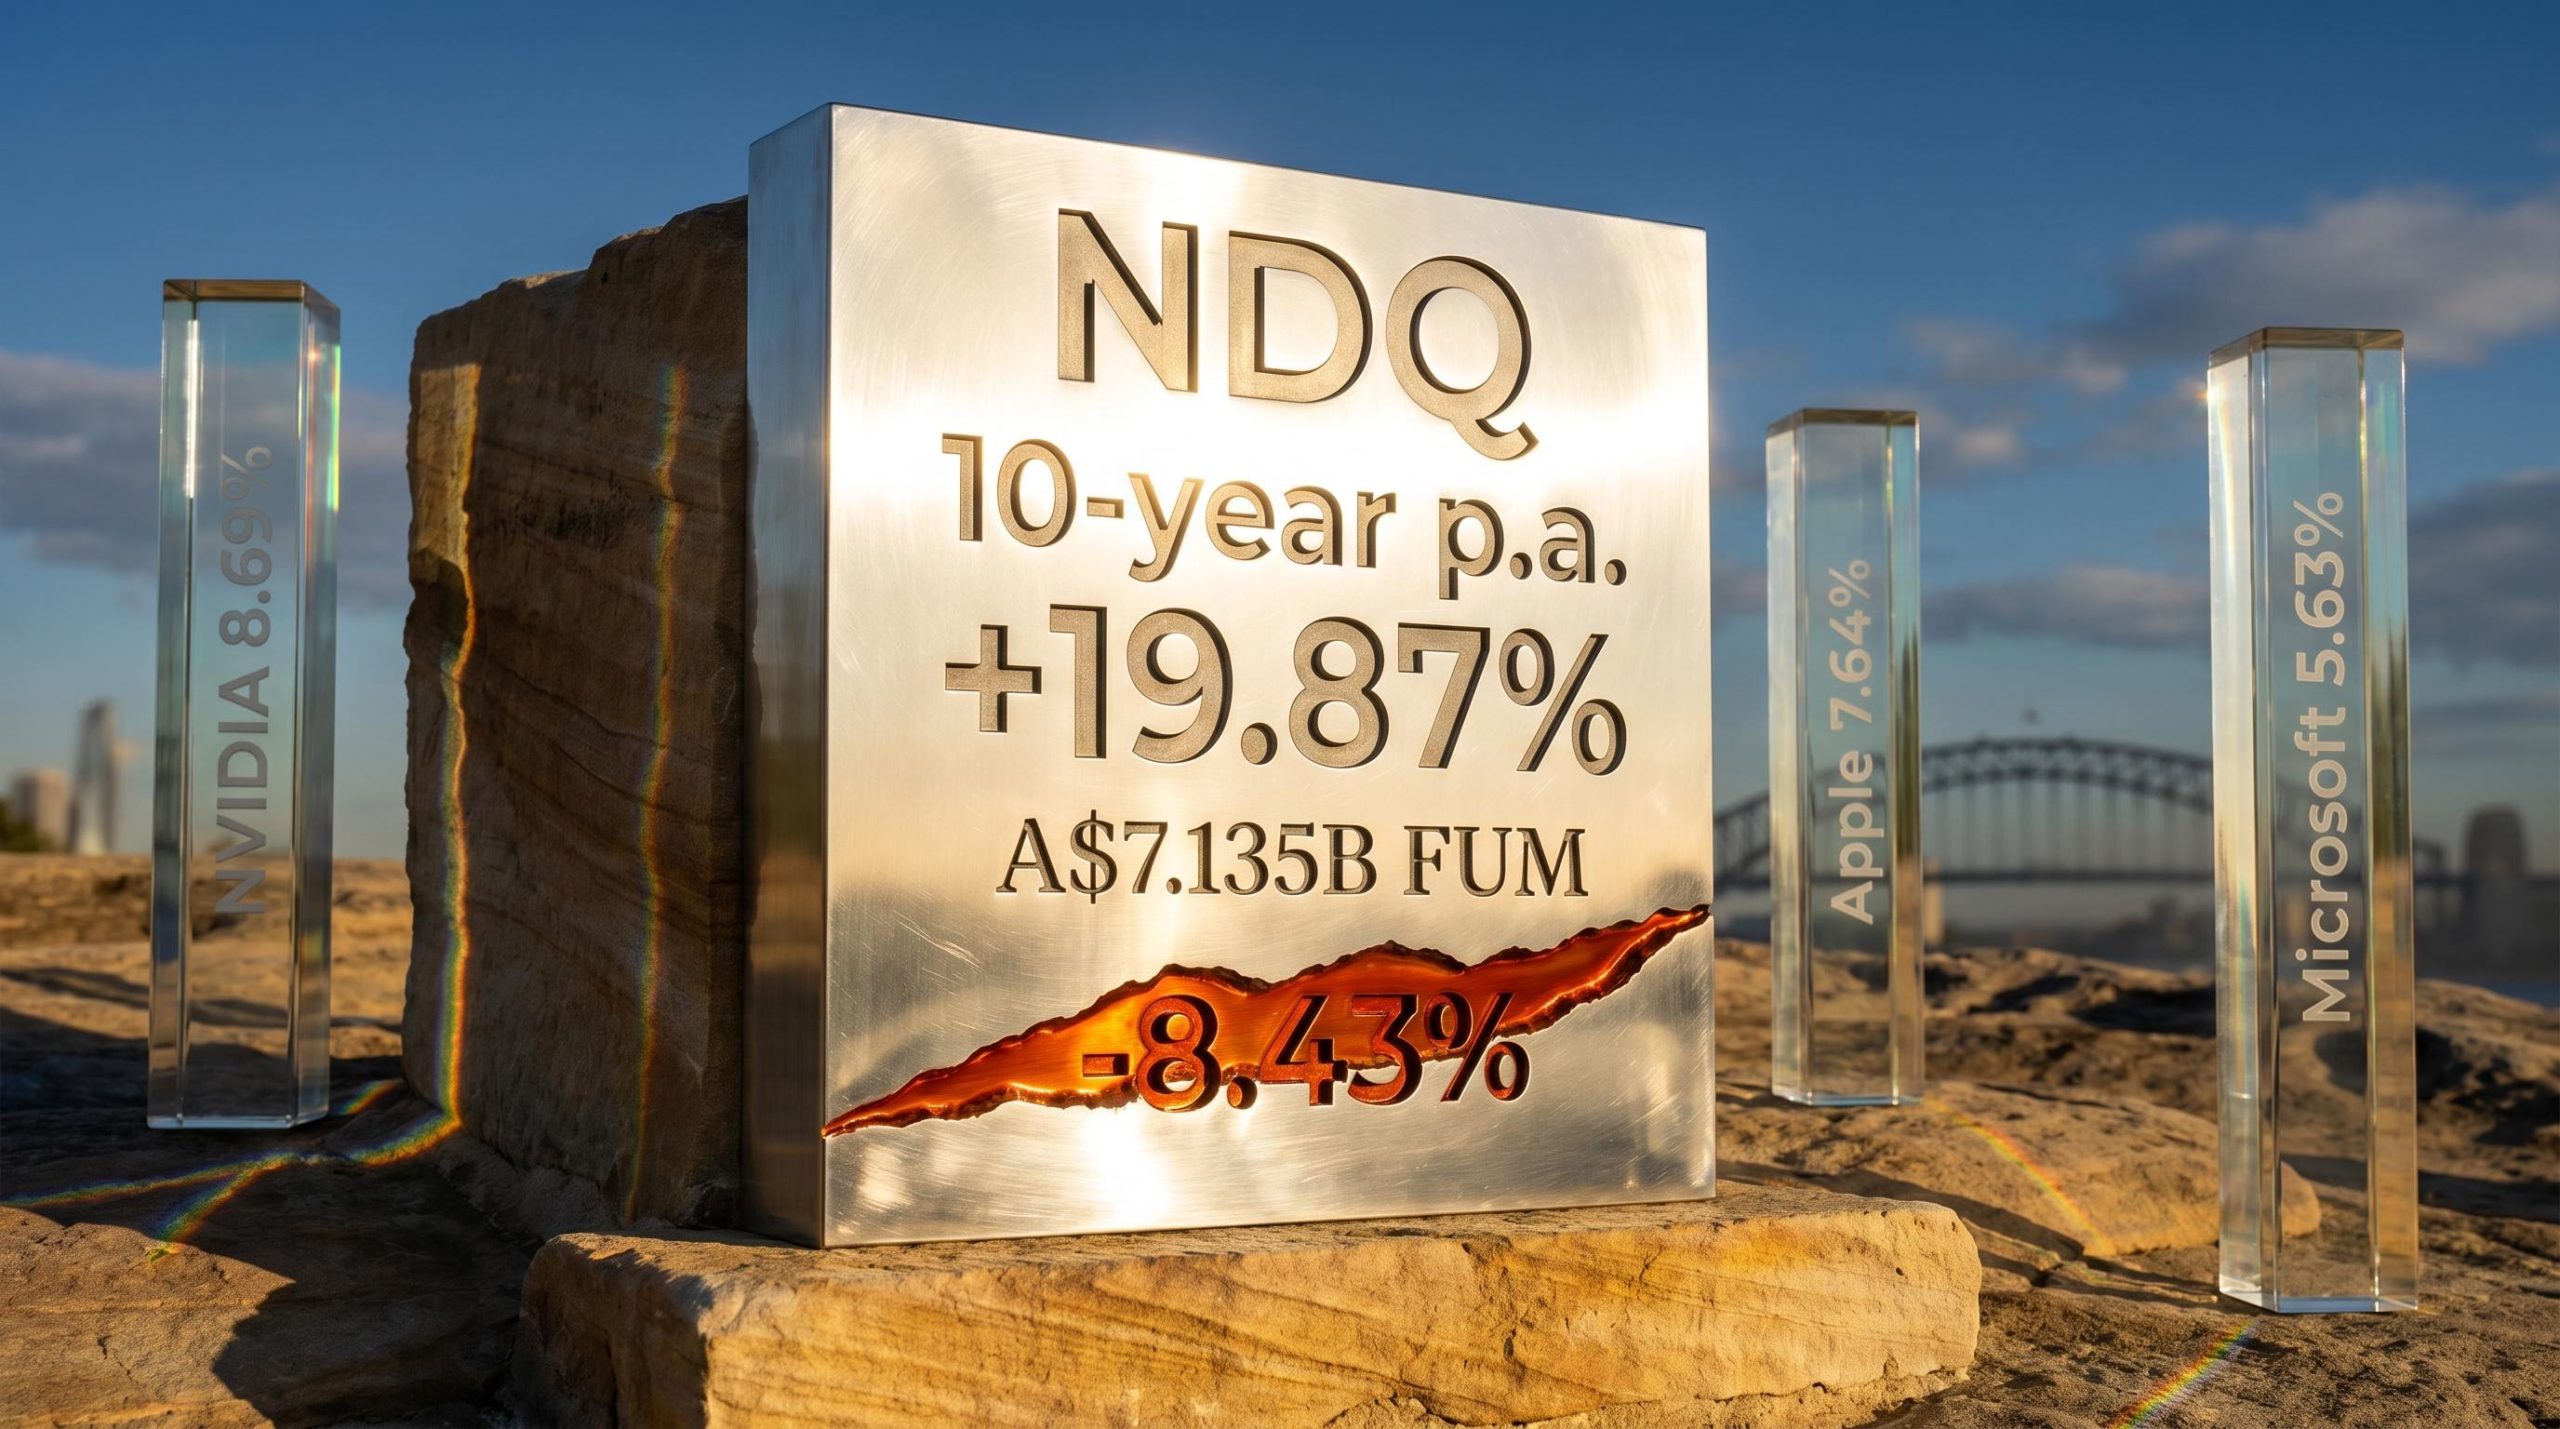
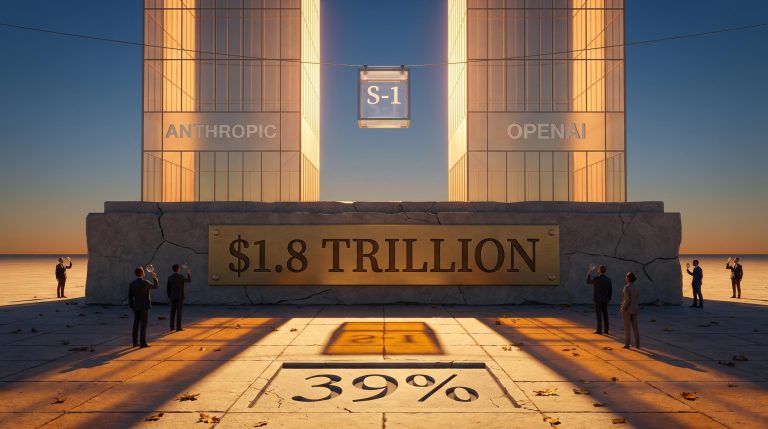
With A$7.135 billion in funds under management and a 10-year annualised return approaching 20%, the BetaShares Nasdaq 100 ETF (ASX: NDQ) ranks among the most compelling growth vehicles available to Australian retail investors. Those numbers, however, come with caveats that matter enormously over a decade. NDQ provides ASX-listed access to the Nasdaq 100 without the administrative burden of a W-8BEN form, making it structurally attractive for portfolios seeking technology and growth exposure. But the same features producing its headline returns, concentration, unhedged currency exposure, and sector cyclicality, are also the sources of its most significant risks. With the fund posting negative returns across both its 3-month and 6-month windows as of March 2026, the timing of a full risk-reward assessment is sharper than usual. What follows unpacks NDQ’s performance data, structural growth tailwinds, concentration and currency risks, and how the fund sits relative to ASX-listed alternatives, so investors can make a genuinely informed allocation decision.
The compounding record speaks first. Over 10 years, NDQ has delivered an annualised return of approximately 19.86-19.88% after fees, a figure that dwarfs most Australian equity benchmarks and places it in rare company among ASX-listed ETFs of any category.
| Timeframe | NDQ return (after fees) |
|---|---|
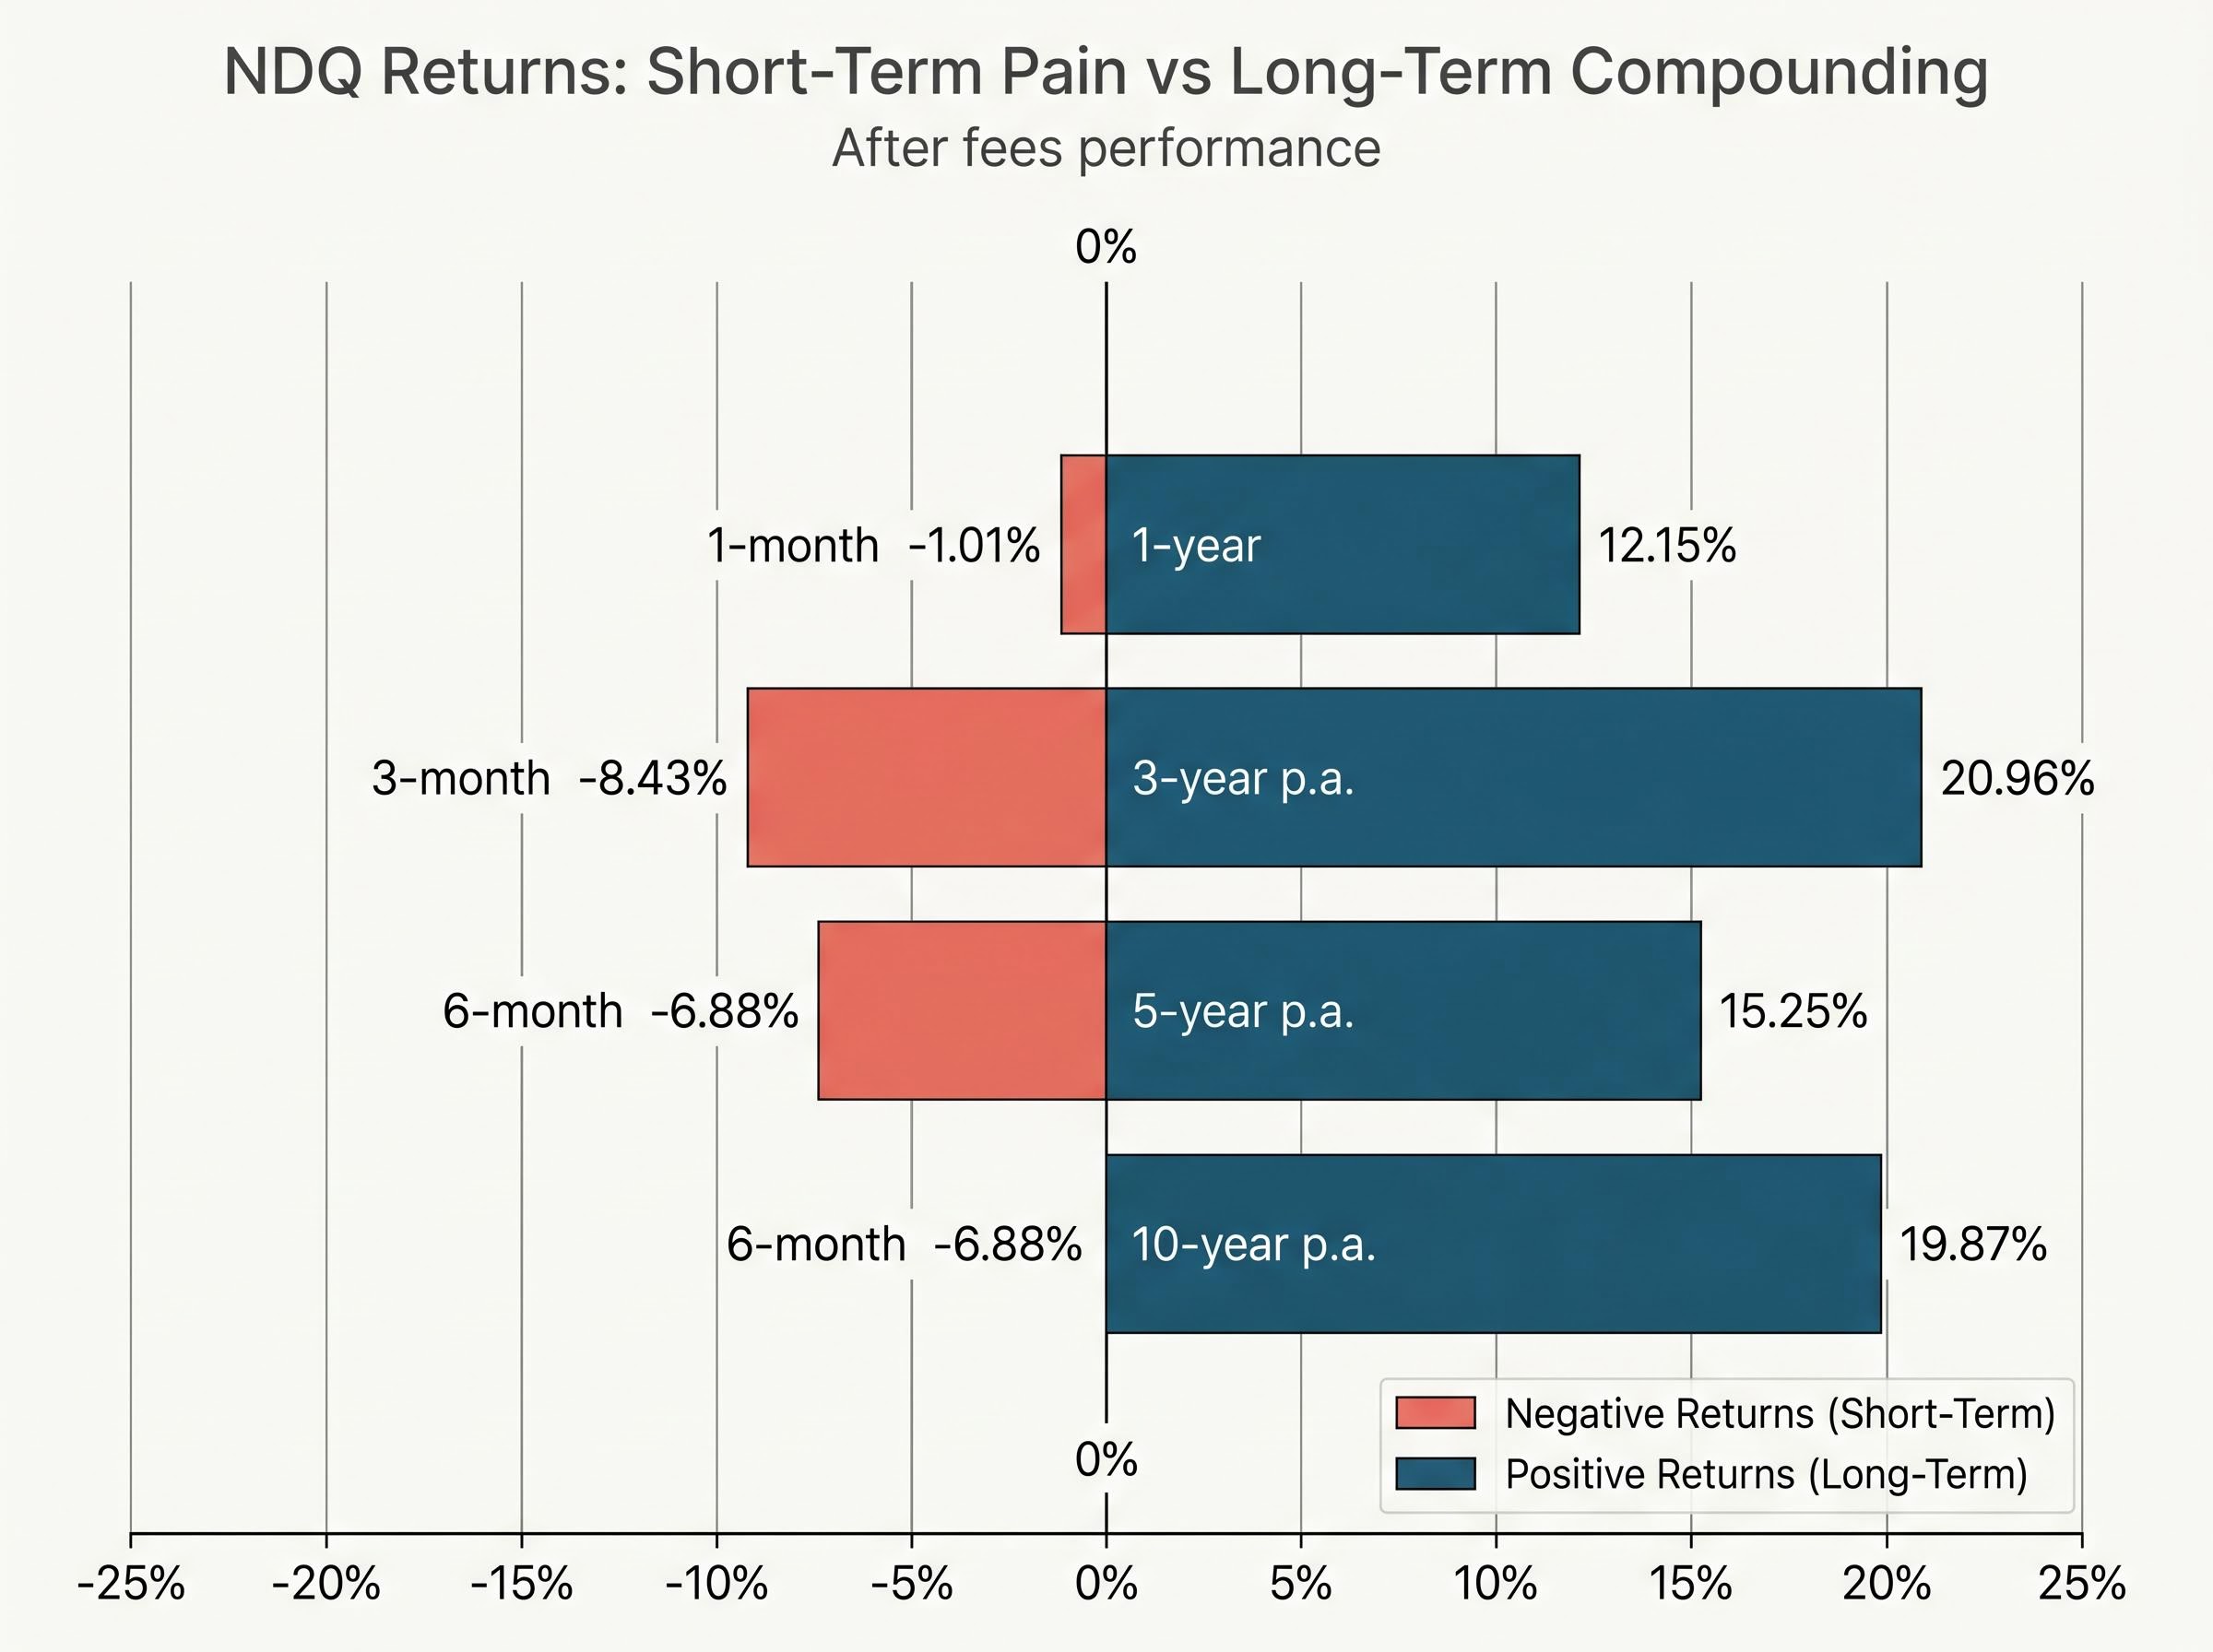
| 1-month | -1.01% |
| 3-month | -8.43% |
| 6-month | -6.88% |
| 1-year | 12.15% |
| 3-year p.a. | 20.96% |
| 5-year p.a. | 15.25% |
| 10-year p.a. | 19.87% |
The short-term columns tell a different story. An -8.43% drawdown over three months is the kind of volatility that separates investors who hold for a decade from those who intended to.
Superannuation comparison: NDQ’s 15-year annualised return of approximately 13.56% materially outpaces AustralianSuper’s balanced option at roughly 8.72% over the same period. That gap compounds into a significant difference in terminal wealth, but only for investors who remained invested through every drawdown along the way.
The management expense ratio sits at 0.48% per annum. For an investor who rode out these years without selling, the cost of access was modest relative to the return earned. For an investor who sold during the drawdowns, the return table above was irrelevant.
For investors newer to index-based investing who want to understand the mechanics before assessing a specific fund, our dedicated guide to ETFs for Australian investors covers how units are created and redeemed, how ASX execution works, and why the ETF structure keeps your assets legally separate from the issuer’s balance sheet.
NDQ’s past performance is a product of the companies it holds, and the question for a forward-looking allocation is whether the growth drivers behind those companies have a long enough runway to justify a 10-year commitment.
Four structural trends anchor the bull case:
The ASX offers limited native exposure to these sectors. Australian equity portfolios are structurally overweight financials and resources, meaning NDQ is additive rather than duplicative for most local investors. It fills a sector gap that the domestic market does not close on its own.
Understanding why these companies dominate the index, not just that they do, is what separates durable conviction from a position that gets sold during the next drawdown.
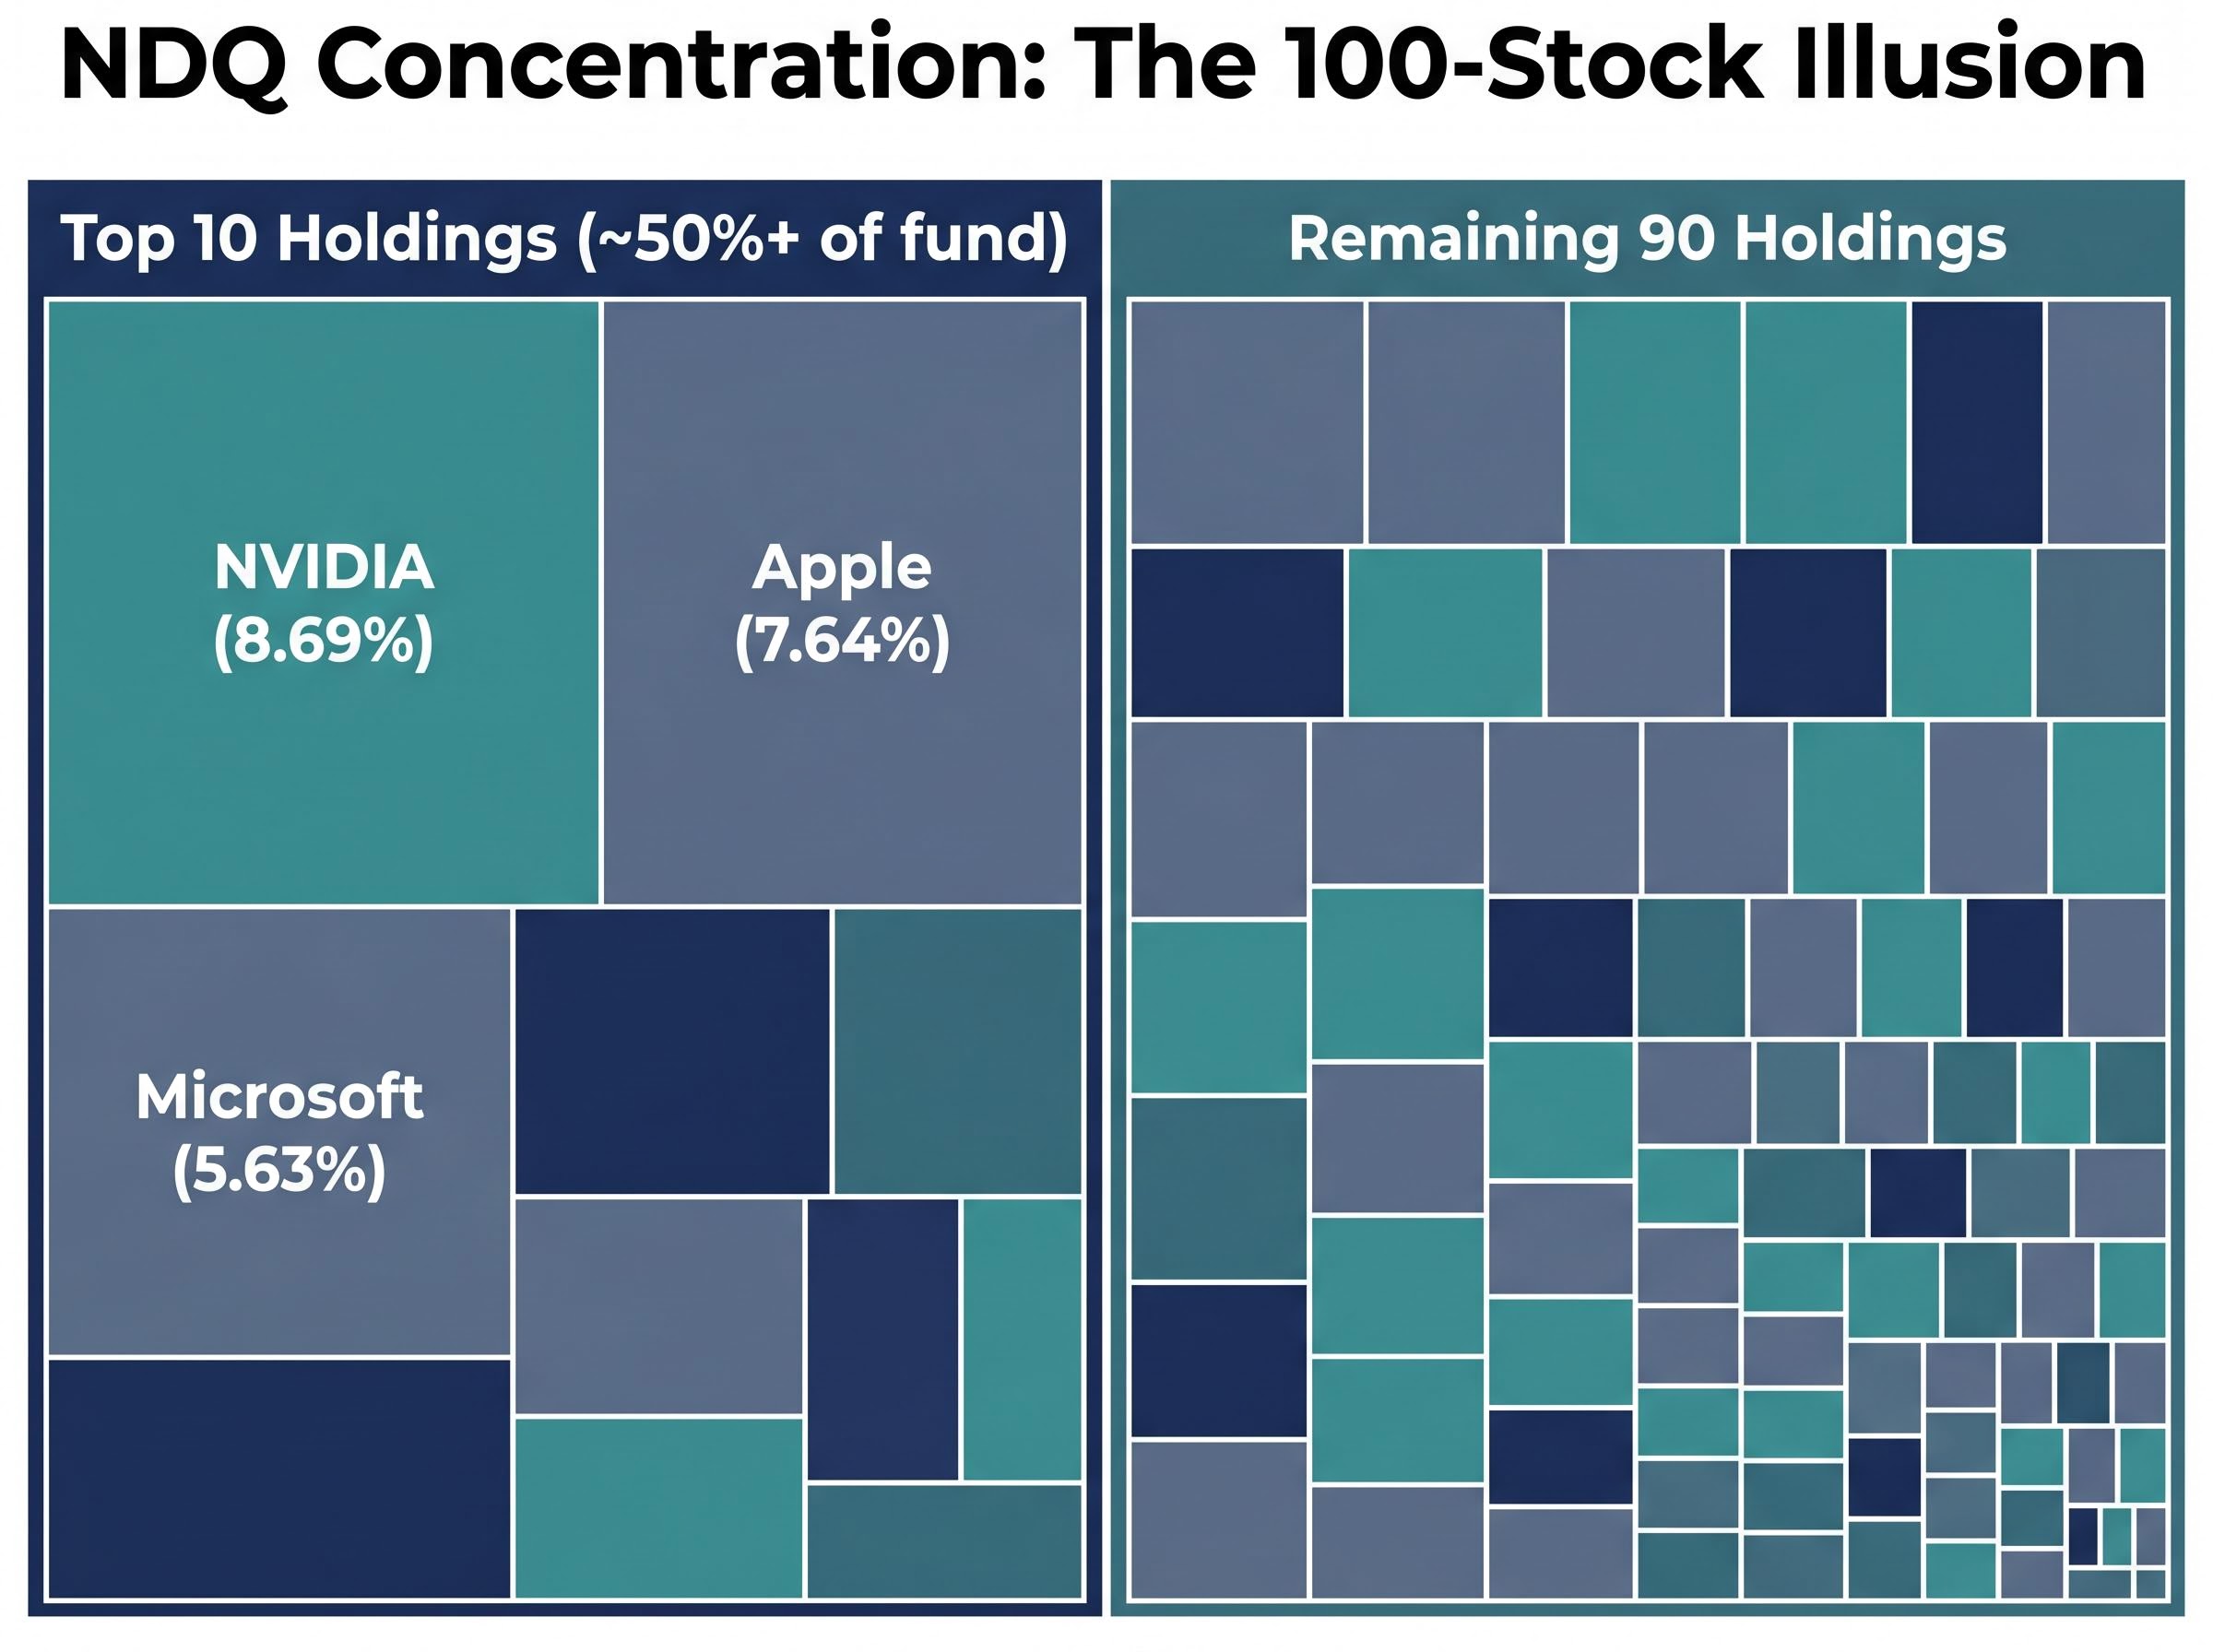
The number 100 implies diversification. The weight distribution tells a different story.
NDQ tracks the Nasdaq 100 Index, which is market-cap weighted. That means a small number of mega-cap holdings dominate the fund’s net asset value regardless of the 100-stock breadth.
| Holding | Approximate weight | Primary sector |
|---|---|---|
| NVIDIA | 8.69% | Semiconductors |
| Apple | 7.64% | Consumer technology |
| Microsoft | 5.63% | Enterprise software |
The top 10 holdings combined account for approximately 50% or more of NDQ’s portfolio. A sharp move in any single mega-cap name ripples through the entire fund.
In practice, this means an investor holding NDQ is making a concentrated bet on a handful of technology leaders, with the remaining 90-odd holdings providing only partial diversification.
Mega-cap concentration risk is not unique to NDQ; the broader S&P 500 index tracked by funds like IVV has reached a point where five stocks control roughly 23% of the total index weight, a level that has surpassed historical concentration peaks and amplifies moves in both directions across passive portfolios.
For calibration, the BetaShares FANG+ ETF holds just 10 equal-weighted U.S. mega-tech stocks, making it significantly more concentrated than NDQ. NDQ sits in a middle band: broader than a pure mega-cap bet, narrower than investors often assume. The Nasdaq 100 also excludes financial sector constituents entirely, removing another diversification layer that broader indices provide.
The Nasdaq 100 Index methodology specifies that constituents are weighted by modified market capitalisation and that financial sector companies are explicitly excluded, two structural rules that directly explain the concentration dynamics and sector gaps that Australian investors take on when allocating to NDQ.
NDQ is unhedged against AUD/USD movements. That single structural feature introduces a return driver, and a risk, that operates entirely independently of anything happening inside the portfolio companies.
When Australian investors hold NDQ, they receive USD-denominated returns converted back into AUD. The exchange rate at the point of conversion directly affects the realised return.
During NDQ’s recent drawdown period, with NAV ranging approximately 55.58-56.09, part of the fund’s short-term divergence from the U.S.-listed QQQ was attributable to currency movements rather than differences in underlying company performance. An investor who attributed all of that volatility to the technology sector was misreading their own portfolio.
Structural AUD/USD dynamics in 2026 have been further complicated by the Strait of Hormuz crisis, which elevated Australia’s LNG and gold export revenues while simultaneously pushing domestic inflation higher, creating a mixed-signal environment for the currency that complicates straightforward hedging decisions for Australian investors holding unhedged offshore positions.
NDQ does not exist in isolation. Several ASX-listed ETFs offer overlapping or adjacent exposure, and understanding where each sits helps convert an all-or-nothing decision into a calibrated portfolio construction choice.
| Ticker | Key feature | Concentration | Currency hedging | MER |
|---|---|---|---|---|
| NDQ | Nasdaq 100, broadest coverage | 100 holdings (top 10 ~50%+) | Unhedged | 0.48% |
| HNDQ | Nasdaq 100, currency risk removed | Same as NDQ | Hedged (AUD/USD) | Not specified |
| QNDQ | Lower concentration Nasdaq exposure | Lower than NDQ | Not specified | Not specified |
| FANG+ | 10 equal-weighted U.S. mega-tech | Very high (10 holdings) | Not specified | Not specified |
| HACK | Cybersecurity thematic | Sector-specific | Not specified | Not specified |
NDQ’s advantages are clear on two dimensions: liquidity (backed by A$7.135 billion in FUM, the largest among ASX-listed Nasdaq-oriented ETFs) and track record (the only fund in this peer group with 10 years of performance data). It requires no W-8BEN form, unlike direct purchases of U.S.-listed ETFs such as QQQ.
HNDQ and QNDQ are best understood not as competitors that make NDQ redundant, but as risk-adjustment tools within the same BetaShares family. HNDQ removes currency exposure for investors who want pure Nasdaq 100 company performance. QNDQ reduces single-stock concentration for investors who find NDQ’s top-heavy weighting uncomfortable. FANG+ moves in the opposite direction, concentrating exposure further into 10 mega-cap names. Thematic options like HACK and RBTZ target narrower segments of the technology sector.
The choice between these funds is a question of which risk an investor wants to manage, not which fund is objectively superior.
Global tech ETF alternatives launched in 2026 have added a new dimension to this comparison: Vanguard’s VTEK, which tracks 300 global technology companies through a capped index structure at 0.23% per annum, offers broader geographic diversification across the technology sector than either NDQ or FANG+, at a lower management cost than NDQ’s 0.48%.
The evidence is on the table. The remaining question is whether it applies to a specific investor’s circumstances.
Three suitability questions structure that assessment:
Forward-looking caveat: NDQ’s historical 10-year annualised return of approximately 19.87% may not be replicated. Analysis from industry commentators has noted that the Nasdaq’s historical growth rate of roughly 17% per annum could decelerate as the largest constituents mature and face tighter regulatory scrutiny.
Concentration risk within the fund argues for treating NDQ as a growth allocation sleeve rather than a total portfolio position. Position sizing matters more than binary inclusion or exclusion.
This article is for informational purposes only and should not be considered financial advice. Investors should conduct their own research and consult with financial professionals before making investment decisions. Past performance does not guarantee future results.
NDQ’s 10-year record is genuinely exceptional, but it was earned through sustained exposure to volatility, concentration, and currency risk that many investors would have exited during drawdowns. The fund’s structural advantages, ASX accessibility, 100-stock breadth, no W-8BEN requirement, and an established track record, make it the most practical Nasdaq 100 vehicle for Australian investors. The suitability caveats remain operative.
The structural growth themes underpinning NDQ’s holdings, artificial intelligence, automation, and digital infrastructure, remain intact as of May 2026, even as short-term volatility continues. That gap between short-term noise and long-term signal is precisely where a 10-year investor operates. The question is not whether NDQ has delivered; it is whether an individual investor’s circumstances, temperament, and portfolio construction allow them to stay positioned long enough for the compounding to work.
The BetaShares Nasdaq 100 ETF (ASX: NDQ) is an ASX-listed fund that tracks the Nasdaq 100 Index, giving Australian investors exposure to 100 of the largest non-financial companies listed on the Nasdaq exchange, including Apple, Microsoft, and NVIDIA, without requiring a W-8BEN form.
As of March 2026, NDQ has delivered an annualised return of approximately 19.87% after fees over 10 years, though the fund posted negative returns over its 3-month and 6-month windows, highlighting the volatility investors must tolerate to capture long-term gains.
No, NDQ is unhedged against AUD/USD movements, meaning a strengthening Australian dollar can erode returns even when the Nasdaq 100 rises; investors who want to remove this currency variable can consider HNDQ, the BetaShares hedged equivalent.
Despite holding 100 stocks, NDQ's top 10 holdings account for approximately 50% or more of the portfolio, with NVIDIA, Apple, and Microsoft each carrying weights above 5%, meaning a sharp move in any single mega-cap name significantly impacts the entire fund.
NDQ offers the broadest Nasdaq 100 coverage and the largest fund size at A$7.135 billion with a 0.48% management fee, while HNDQ removes currency risk, QNDQ reduces concentration, and FANG+ concentrates exposure further into just 10 equal-weighted mega-cap technology stocks.