
Australia just printed a GDP result that beat every major forecast, including the RBA’s own projection. The currency fell anyway.
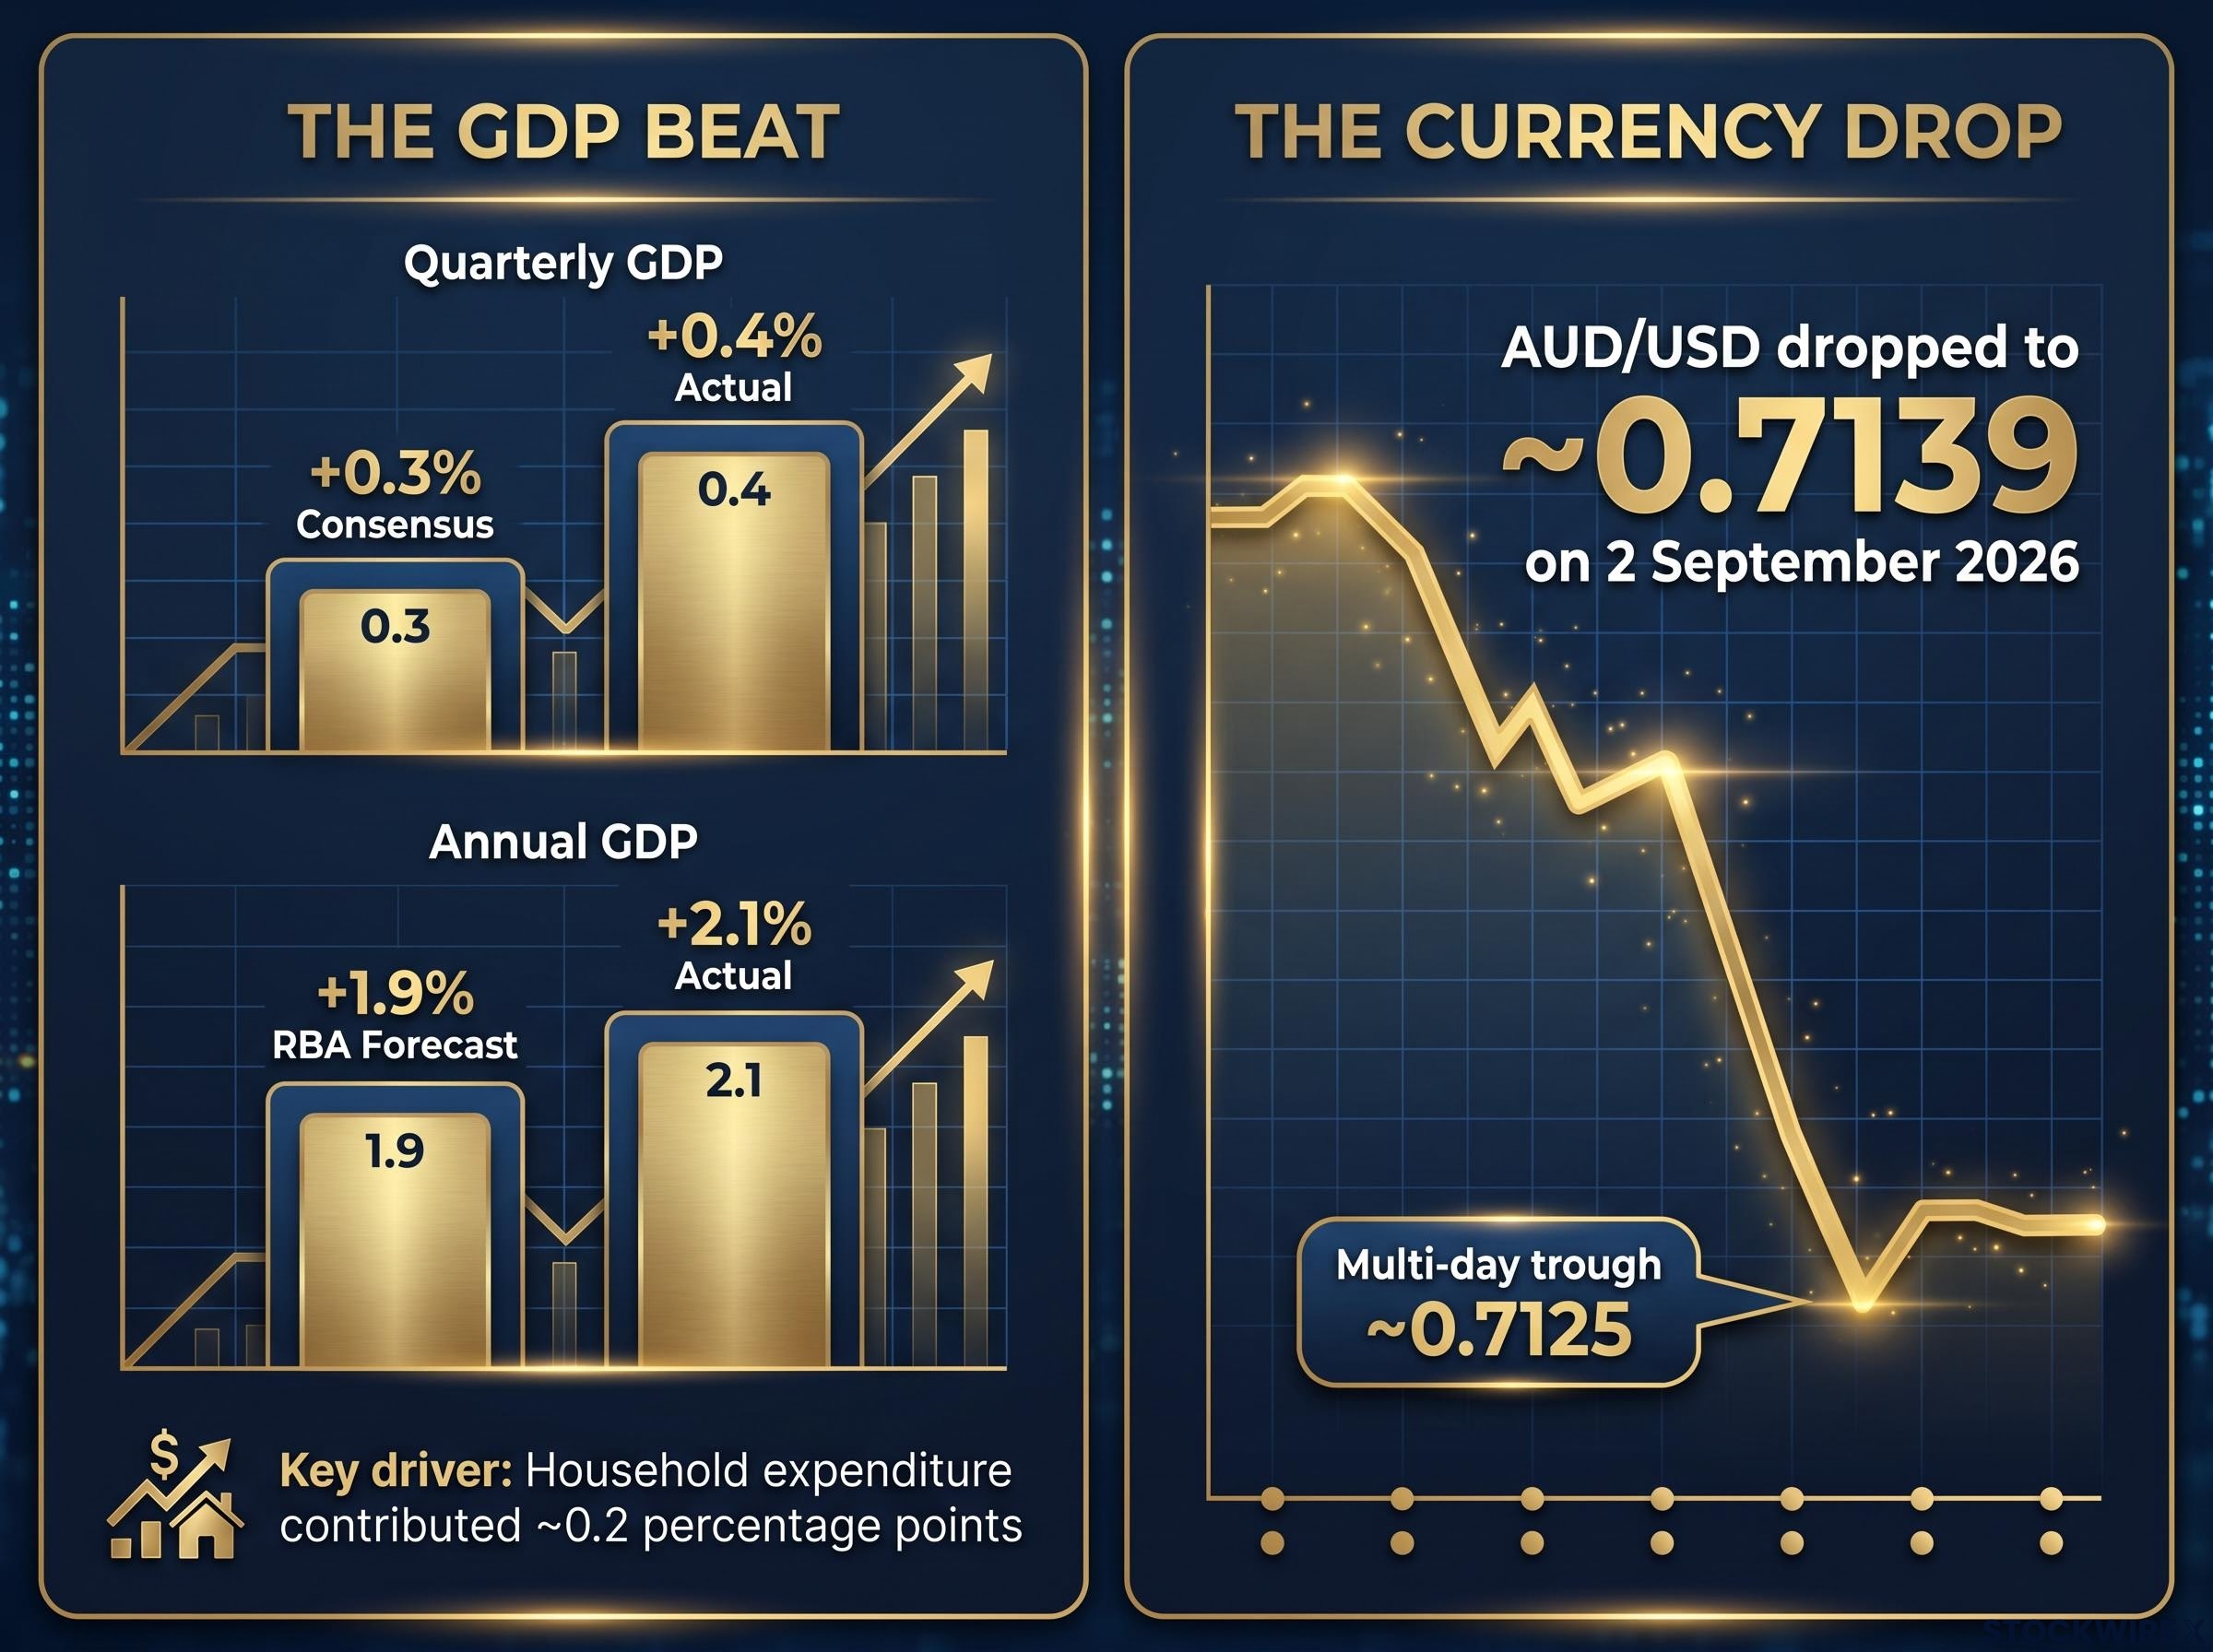
If you assumed “strong economy equals stronger AUD,” the market just told you something worth understanding about how forex actually works. The AUD/USD pair slid to around 0.7139 on 2 September 2026, holding near multi-day lows, even as second-quarter GDP data showed the Australian economy growing at 0.4% for the quarter and 2.1% year-on-year, both ahead of consensus.
That disconnect is not a glitch. It is a working illustration of a principle experienced traders treat as foundational: in a USD-dominant environment, the strength of the currency on the right side of the pair routinely overrides good news on the left.
This piece gives you a framework for understanding why AUD/USD moves the way it does, what broad USD strength means in practice, and how to read domestic economic data without assuming it controls the pair’s direction. Approaching AUD/USD forex trading this way leaves you with a mental model that applies well beyond this single episode.
What just happened: a GDP beat that sent AUD/USD lower
Start with the numbers, because the tension between them is the whole point. Australia’s second-quarter real GDP expanded by 0.4% quarter-on-quarter, beating the market consensus of 0.3% and accelerating from the prior quarter’s pace. On an annual basis, growth reached 2.1% year-on-year, ahead of the RBA’s own forecast of 1.9%.
Here is that data in scannable form:
- Quarterly GDP: +0.4% actual versus +0.3% consensus
- Annual GDP: +2.1% actual versus the RBA’s +1.9% forecast
- Household expenditure contributed roughly 0.2 percentage points, with vehicle purchases highlighted as a key driver
By any straightforward reading, that is a solid result. Domestic demand held up. Households kept spending. The economy grew faster than the people whose job it is to forecast it expected.
And the currency went the other way. AUD/USD sat at approximately 0.7139 on 2 September 2026, near a multi-day trough of around 0.7125 identified by Elias Haddad, an analyst at Brown Brothers Harriman (BBH), as reported by FXStreet.
According to Haddad’s analysis via FXStreet, the decline was driven by generalised US Dollar appreciation, not by anything specific to Australia. The pressure came from the USD side of the pair, not from Australian weakness.
So you have good data, a falling currency, and no obvious domestic reason for the two to sit together. That gap tells you something specific: the pair’s direction is being set somewhere other than Canberra’s economy. Before you draw any conclusion from an Australian data release, you need to know where that “somewhere” is, and it is the USD side of the equation. Misreading this is where traders most often get wrong-footed, acting on a positive local print as if it will automatically lift the pair.
When big ASX news breaks, our subscribers know first
How USD dominance works: four mechanisms that override domestic data
Why does one side of a currency pair get to overrule the other so consistently? The answer is not a single rule but four mechanisms that stack on top of each other. FX strategy teams at Brown Brothers Harriman, ING, and large Australian banks broadly converge on this framework, and each layer matters.
The five structural AUD drivers, covering RBA policy, iron ore prices, Chinese economic conditions, global risk sentiment, and the trade balance, each operate on different time horizons, which is why a single quarterly GDP print rarely has the weight to shift the pair’s direction when multiple other forces are pulling against it.
The first is about interest rates. Markets price currencies on expected relative interest rate paths, not on a single GDP print. A positive Australian surprise can nudge local yields up slightly, but if traders expect the US Federal Reserve to hold rates higher than the RBA, the relative advantage stays with the dollar. One quarterly beat rarely shifts that calculus.
The second is the dollar’s safe-haven and reserve status. In risk-off episodes, whether equity sell-offs or global growth worries, investors pull capital out of higher-beta currencies like the AUD and move into USD assets. That flow happens regardless of what Australian data show.
The third is structural. Because much of global trade and debt is denominated in dollars, changes in US yields or dollar funding conditions create broad USD demand that has nothing to do with the bilateral comparison between Australia and the US. When dollars get more expensive or scarce, firms hedge or reduce non-USD exposures, mechanically pushing pairs like AUD/USD lower.
Federal Reserve research on the dollar’s reserve role documents how USD invoicing of global trade and deep US capital markets create structural demand for the currency that operates independently of any bilateral economic comparison, which is precisely why a positive Australian print cannot neutralise broad dollar strength.
When the trend becomes the signal
The fourth mechanism is about momentum and positioning. Once markets settle into a “strong USD” regime, that lens colours how every new data point is read. Positive non-US data, rather than triggering a reversal, is often treated as a chance to re-enter USD long positions at a better level.
Here is how the four layers compare:
| Mechanism | How it works | Why Australian GDP cannot override it |
|---|---|---|
| Interest rate path expectations | Currencies priced on expected relative policy trajectories | One quarterly beat rarely shifts the Fed-versus-RBA calculus |
| Safe-haven and reserve role | Risk-off flows move capital into USD assets | Flight to safety ignores local data entirely |
| Global funding and invoicing | Dollar liquidity conditions drive structural USD demand | Demand is independent of the Australia-US comparison |
| Positioning and momentum | Strong-USD regimes reframe all news through a USD lens | Good non-US data becomes a USD re-entry opportunity |
That markets look past the quarterly print is visible in the RBA’s own numbers. Its May 2026 Statement on Monetary Policy projected year-ended growth of 1.9% to June 2026 falling to 1.3% by December 2026, and its August 2026 Statement put full-year 2026 growth at 1.4%. Notably, no single named USD-side catalyst has been publicly flagged as the trigger for this latest leg, which tells you the driver is regime-level dollar pressure, not one discrete event. Checking Australia’s GDP before trading the pair gives you, at best, half the picture.
Why a GDP beat does not always mean what it looks like
Set USD dominance aside for a moment. Even on its own terms, this particular GDP print carried features that would have moderated any currency lift. Markets price the forward path of growth and policy, not the latest number, and the forward path here was pointing down.
Consider what the beat sat against. The RBA’s August 2026 Statement expected growth to stay subdued, running below the bank’s estimate of potential throughout the forecast period. Secondary forecasters agreed: NAB’s “Australian Forward View” from 21 August 2026 described three consecutive years of below-trend growth at 1.4% in 2026, 1.6% in 2027, and 1.8% in 2028, while the Australian Industry Group on 28 August 2026 saw growth softening from 1.9% in June 2026 to 1.4% by end-2026.
The RBA’s August 2026 Statement on Monetary Policy expected growth to be subdued over 2026, remaining below its estimate of potential growth throughout the forecast period.
Composition matters too. The quarter’s growth leaned heavily on household consumption, including vehicle purchases, contributing around 0.2 percentage points. Markets often treat consumption-led growth as less durable than investment or export-led growth, particularly when it looks credit-financed and high inflation is eroding real incomes.
What the RBA’s forward guidance actually signals
When a central bank signals it will look through a short-term beat rather than adjust its policy path, traders draw a logical conclusion: the data will not change the interest rate differential that matters most for FX direction. If the RBA is not moved by the print, the case for the pair to rally on it weakens considerably.
RBA forward guidance carries more weight for AUD direction than the headline GDP number itself, because the statement language determines whether a positive data surprise will actually shift the rate differential that drives positioning; a hold accompanied by unchanged forward guidance leaves the interest rate calculus exactly where it was before the print.
Pulling these threads together gives you four caveats for reading any GDP release:
- Forward trajectory: a beat that precedes officially forecast deceleration is a weaker signal than the headline suggests
- Composition: consumption-led growth is treated as less durable than investment or export-led growth
- Central bank reaction function: if policy does not move, the differential does not move
- Context: this is a pattern, not a rule that Australian data is always irrelevant
None of this means domestic data never matters. It means context, composition, and forward guidance decide how much weight markets place on a single quarter. A print that beats consensus but leads into a downgraded outlook is a thinner bullish case than it first appears, and factoring in the forward path, not just the latest figure, is what separates reactive from analytical thinking.
How long can USD dominance suppress a fundamentally sound currency?
So the dollar is calling the shots. The natural question is how long that lasts, and here the honest answer is that credible analysts genuinely disagree.
One camp argues fundamentals eventually reassert themselves. On this view, USD-dominant phases are cyclical. Once the Fed reaches peak rates, risk sentiment steadies, and the dollar’s relative pull fades, undervalued currencies with solid domestic fundamentals tend to attract rotation back in. Suppression, in other words, is temporary.
The other camp stresses structure. The dollar’s reserve status, the depth and liquidity of US capital markets, and persistent safe-haven demand can sustain its strength long after its domestic story looks less compelling. A fundamentally sound currency can stay suppressed for years if US assets keep offering decent yields with perceived safety.
Here is how the two views line up:
| View | Core argument | What would need to change |
|---|---|---|
| Fundamentals eventually reassert | USD dominance is cyclical and unwinds once its relative pull fades | Fed pivot, risk sentiment stabilising, USD attractiveness declining |
| USD can stay strong despite fundamentals | Reserve status and market depth sustain the dollar for extended periods | Prolonged lower US real yields or an erosion of USD safe-haven appeal |
Most experienced analysts blend the two. For the AUD to reclaim ground, several conditions would likely need to align:
- A clear Fed pivot or pause signal
- US growth converging toward global averages
- Equity and credit volatility normalising
- US real yields declining relative to Australian real yields
The current range near 0.714 to 0.715 is the practical expression of this suppression in the present cycle. Whether you hold AUD assets, trade the pair, or simply want to know what a soft exchange rate means for your purchasing power, the useful takeaway is this: dominance can last longer than fundamentals suggest it should. Positioning around a “catch-up” thesis means knowing which signals would actually trigger the turn, not assuming a timeframe.
The breakout conditions that would shift AUD/USD from its current suppressed range require simultaneous convergence across three factors: a sustained weekly close above the 0.7275-0.7309 resistance zone, synchronised Asian FX strength, and structural rather than data-driven USD weakness, a combination that illustrates precisely why a single domestic GDP beat is insufficient to trigger a new trend leg.
Reading AUD/USD with a full-picture framework, not just Australian data
The lasting value here is not the specific numbers. It is a habit of analysis you can reuse on every future release.
Before you interpret any Australian data print for AUD/USD, run two steps in order:
- Assess the USD regime first. Is broad USD in a dominant trend? What are US yields, Fed guidance, and global risk sentiment doing? This sets the backdrop everything else plays out against.
- Then assess the domestic data on its merits. Look at the quality and composition of growth, and read it against the RBA’s forward guidance, not just the headline beat.
Neither input alone is enough. The most common and costly error is running only the domestic analysis while ignoring the USD side entirely, which is exactly the trap the September episode illustrates. A 0.4% quarterly and 2.1% annual beat, a pair stuck near 0.714 despite it, and RBA projections pointing below potential through 2026: that combination is a recurring pattern across USD-dominant cycles, not a one-off.
Keep these forward-looking variables on your radar:
- Fed guidance and the US rate path
- US real yields relative to Australian real yields
- Global risk sentiment and equity volatility
- The RBA’s policy trajectory relative to the Fed’s
Haddad’s read, that broad USD strength rather than Australian weakness drove the move, is the model this framework is built on. The single most transferable lesson is to ask “what is the USD doing and why?” before “what does this Australian data mean?” Traders and investors who separate the bilateral story from the USD regime story tend to be wrong-footed far less often than those who react to individual prints.
For readers wanting to complement the macro framework with a structured approach to price levels and momentum signals, our dedicated guide to forex technical analysis covers the five-step conditional process using SMAs, trend lines, and RSI that traders use to build scenario maps around any currency pair.
This article is for informational purposes only and should not be considered financial advice. Investors should conduct their own research and consult with financial professionals before making investment decisions.
Forward-looking projections referenced here are subject to market conditions and various risk factors, and past performance does not guarantee future results.