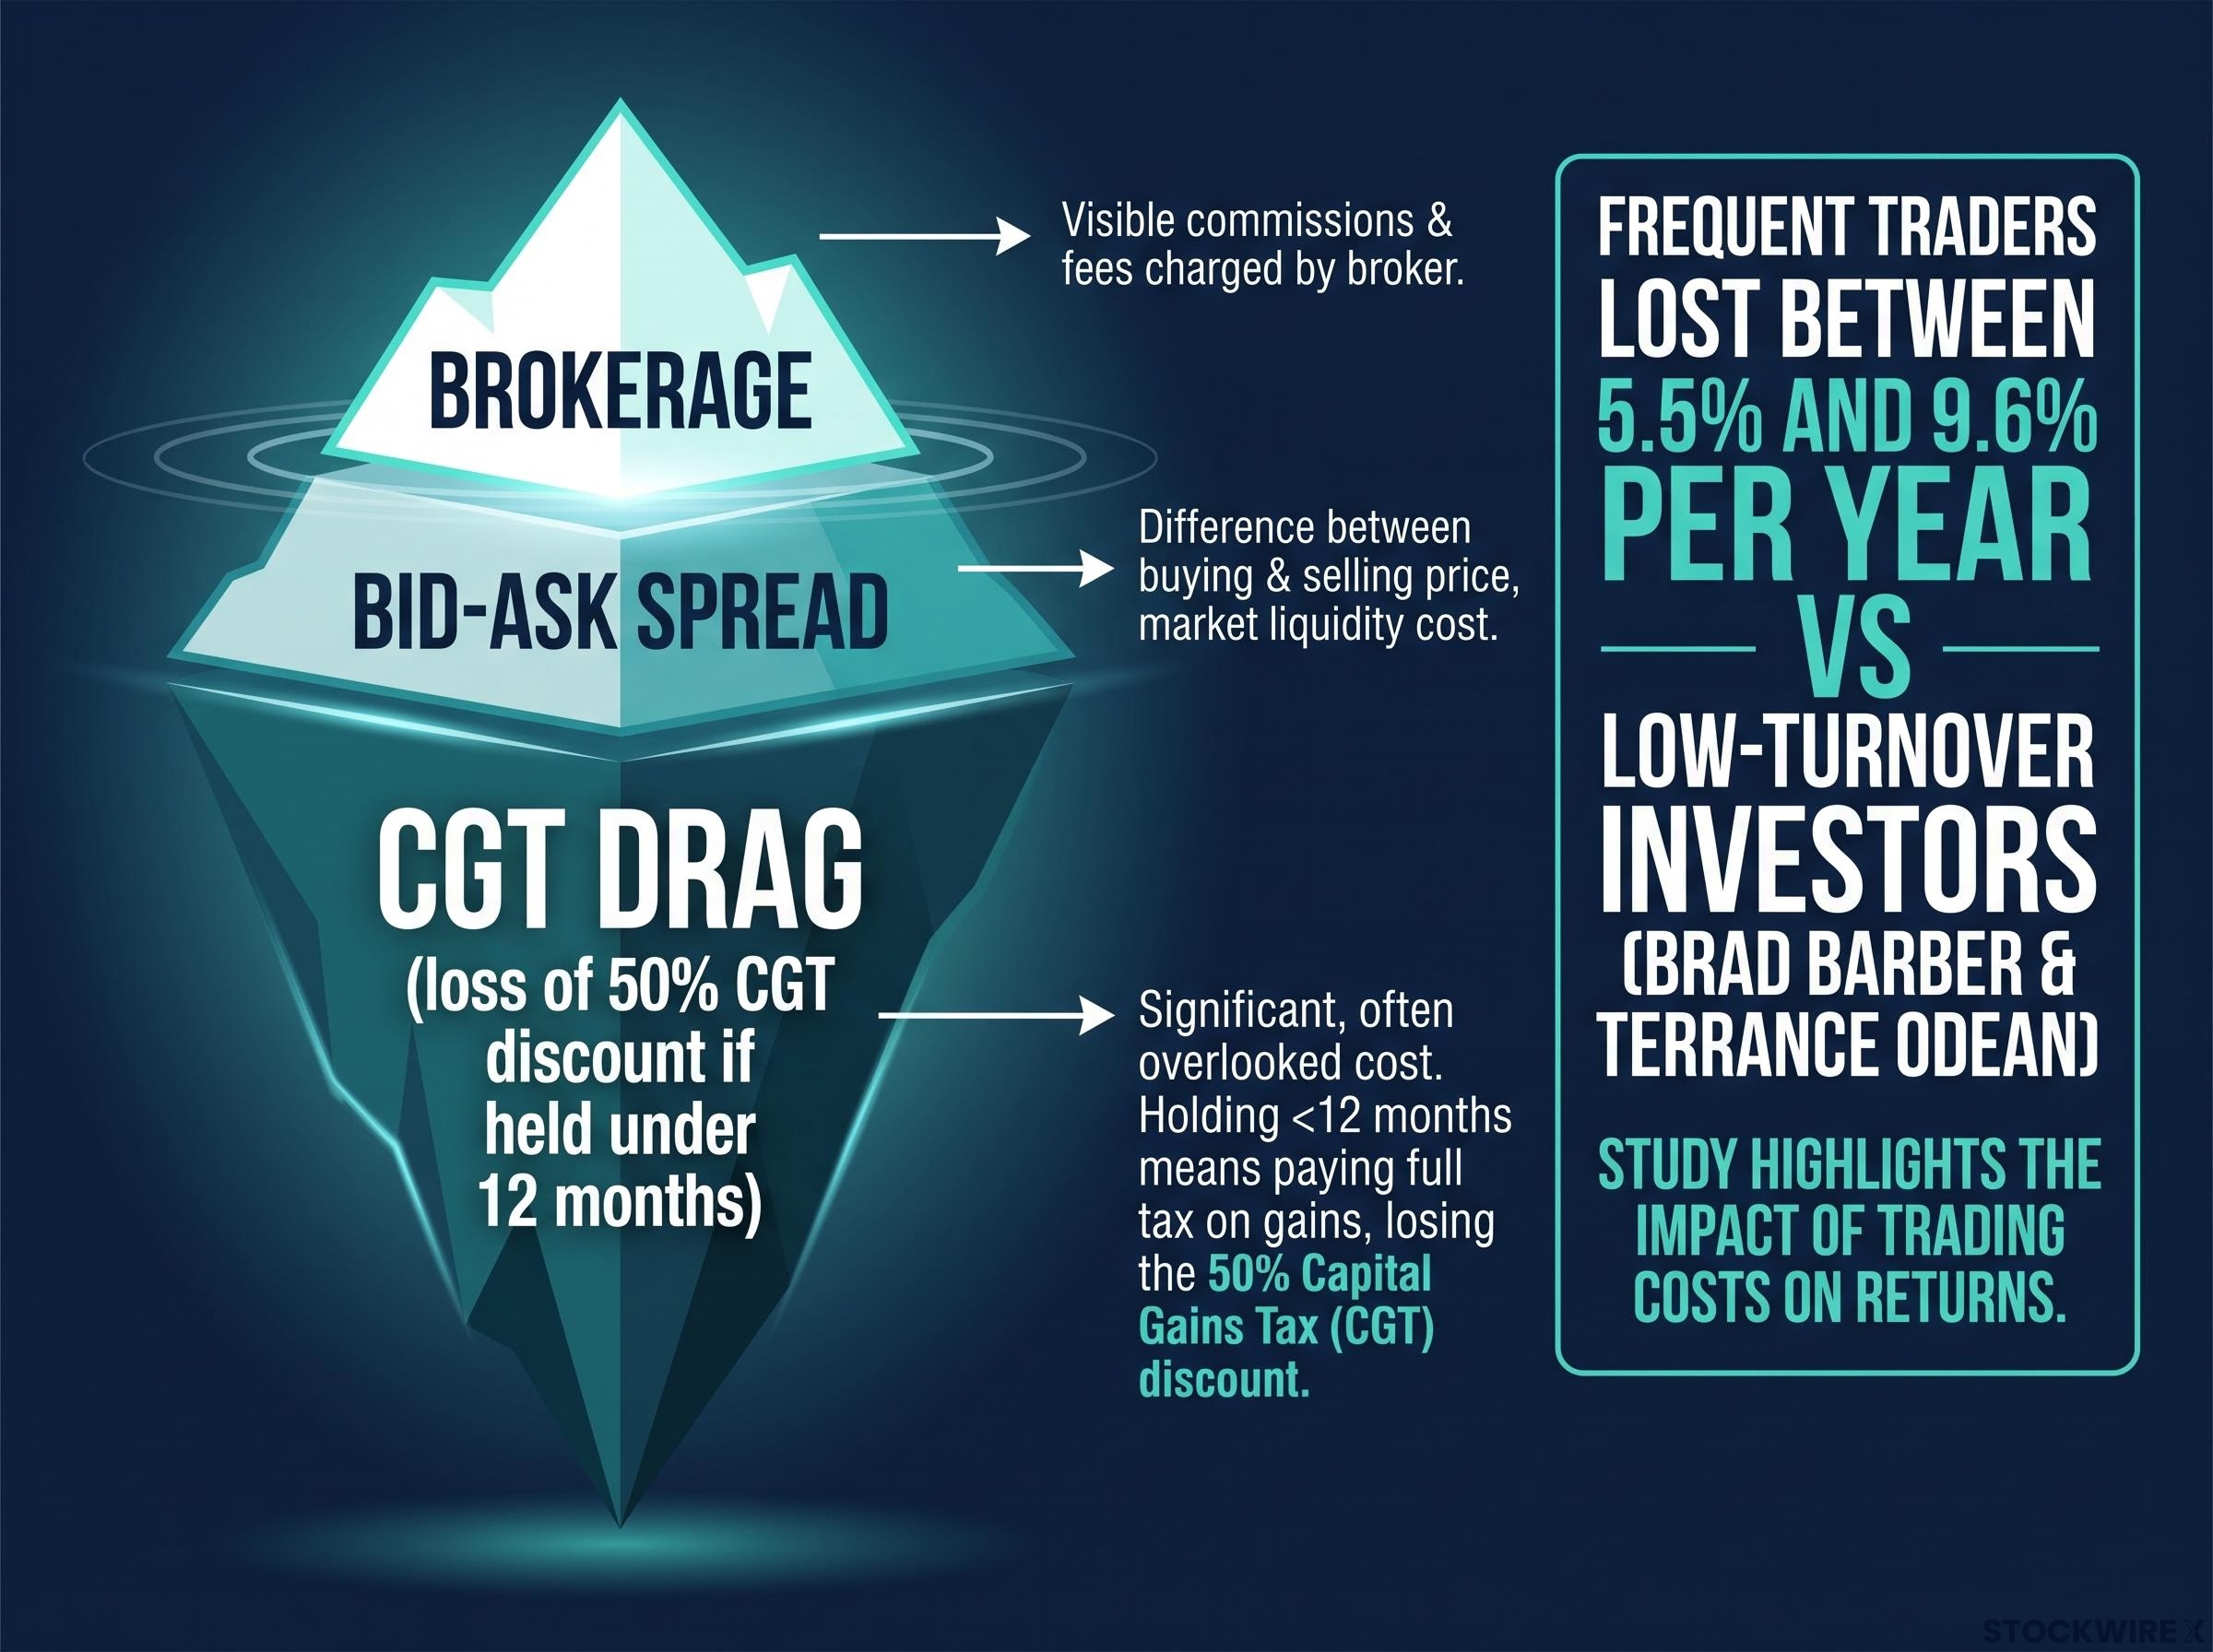
Two groups of investors bought roughly the same stocks and earned roughly the same gross returns. One group traded constantly. The other barely traded at all. When Brad Barber and Terrance Odean measured what each group actually kept, the frequent traders had lost between 5.5% and 9.6% per year to the low-turnover group, and none of it came from picking worse stocks.
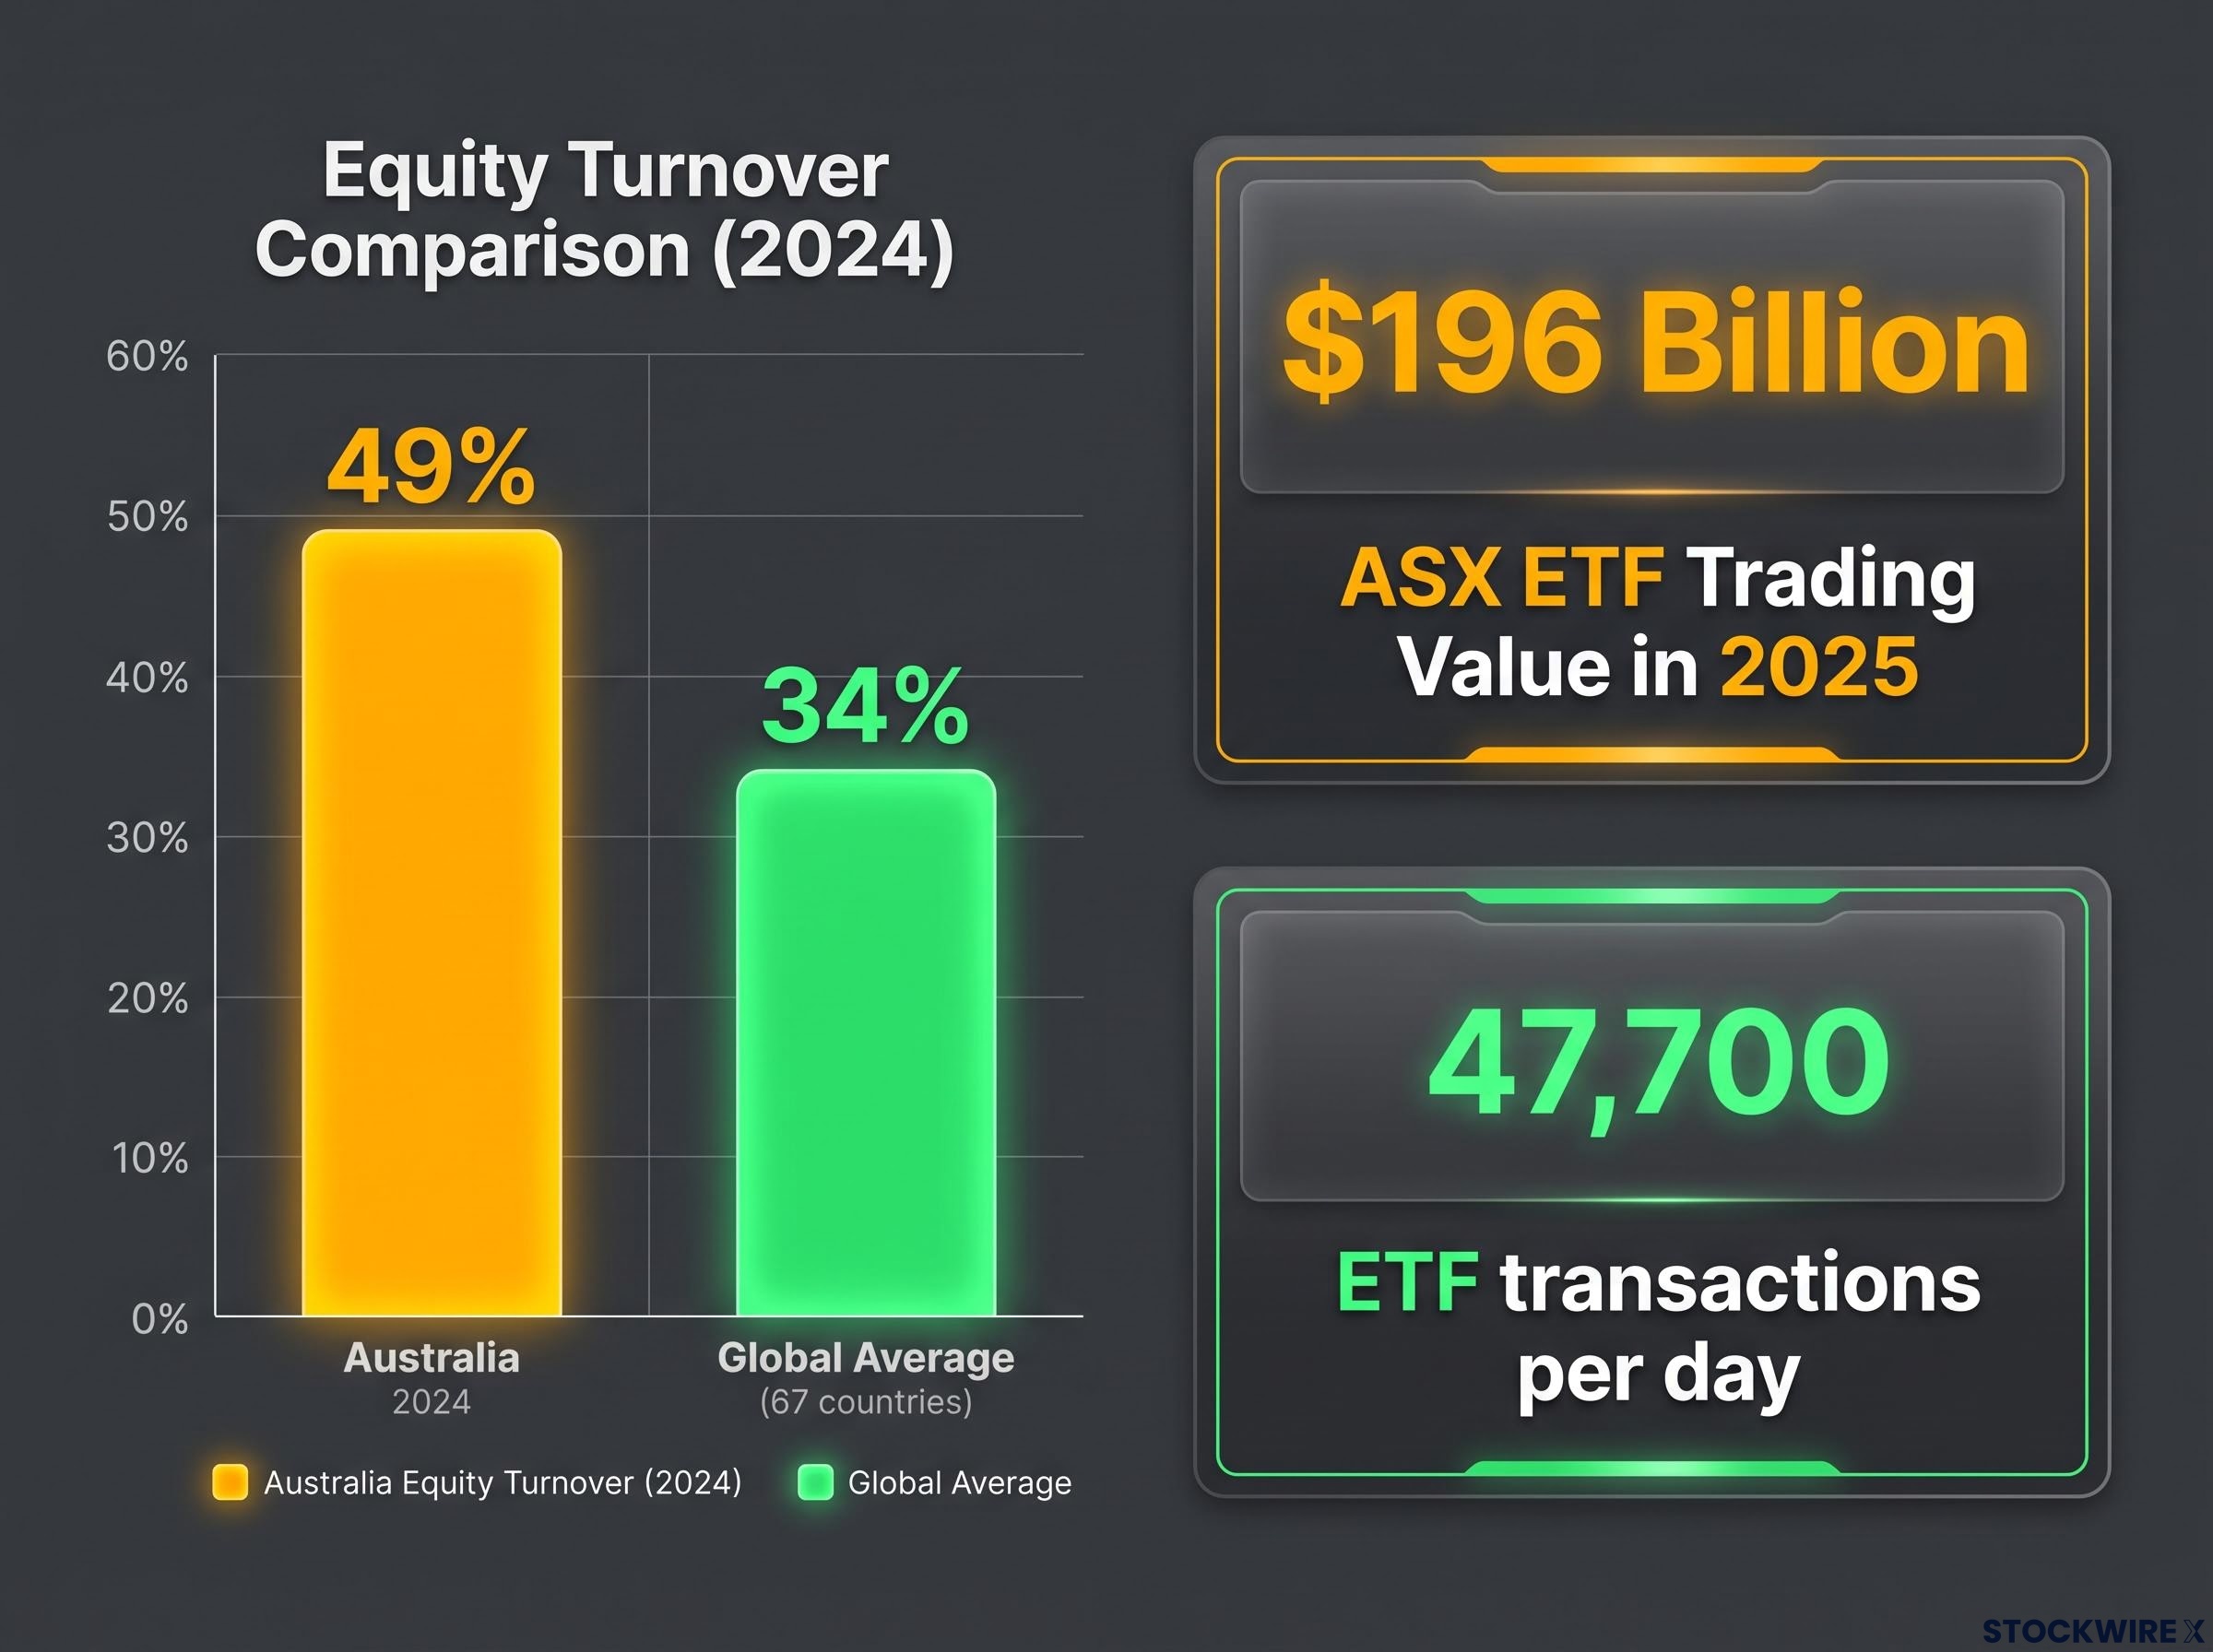
That gap is the entire story of overtrading, and it has a distinctly Australian setting right now. ASX ETF trading value hit $196 billion in 2025, up 39% in a single year, with roughly 47,700 ETF transactions moving through the market every day. Those numbers describe a lot of investors treating buy-and-hold instruments as trading vehicles.
You almost certainly own at least one ETF, and you have almost certainly felt the pull to act on a headline. This piece gives you a way to tell whether that pull is a real change to your investment case or a reflex worth ignoring.
The real price tag on a busy ETF portfolio
Start with the cost you can actually see. Every time you trade an ETF, you pay brokerage, and even at the low headline rates offered by Australian platforms, that fee applies to every buy and every sell. That is the visible layer, and it is also the smallest one.
The second layer is the bid-ask spread, the gap between the price at which you can buy and the price at which you can sell at any given moment. It applies to every trade regardless of what your broker charges, and it is largely invisible because it never appears as a line item. Trade a thinly traded thematic ETF instead of a broad-market one, and that spread widens, quietly taxing every round trip you make.
The third layer is usually the largest, and it is tax. Selling an ETF that has risen in value realises a capital gain, and if you have held that position for less than 12 months, you forfeit the 50% capital gains tax (CGT) discount entirely. The CGT discount is a rule that halves the taxable gain on assets held longer than a year, so trading fast means paying tax on the full gain rather than half of it.
The CGT discount rules that apply to ETF trades are themselves in transition: from 1 July 2027, the 50% discount is scheduled to be replaced by a CPI-indexed real-gains model taxed at a 30% minimum rate, meaning the cost of selling appreciated positions before the 12-month mark will be recalculated under an entirely different framework.
| Cost Type | When It Applies | Visibility | Typical Impact |
|---|---|---|---|
| Brokerage | Every buy and sell | Visible line item | Smallest layer, but scales with frequency |
| Bid-ask spread | Every trade, all ETFs | Invisible, never itemised | Widens sharply on thematic ETFs |
| CGT drag | Selling appreciated positions | Deferred until tax time | Often largest; full gain taxed if held under 12 months |
Here is the part that matters most. The performance gap Barber and Odean found was not a stock-picking gap.
Across more than 60,000 brokerage accounts, gross returns were broadly comparable between the highest-turnover and lowest-turnover investors. After commissions and spreads were applied, the frequent traders trailed by up to 9.6% per year. The entire difference came from cost, not from choosing worse investments.
Most investors evaluating an ETF fixate on the management expense ratio, the annual percentage the fund charges. What this evidence shows is that your own trading behaviour can dwarf that fund-level fee as a driver of what you actually keep. The drag never shows up in any single trade. It compounds silently across brokerage, spreads, and tax events, which makes the total cost structurally invisible until the damage is already done.
When big ASX news breaks, our subscribers know first
Why smart investors keep pressing the trade button anyway
If the cost is so clear, why does anyone trade this much? Because the urge feels rational in the moment, and it is driven by real emotions and real market data. Naming the specific mechanism behind a trade is the first step to evaluating whether it deserves to happen.
The mechanisms cluster into two groups: the forces that pull you in and the forces that push you out. Here is what pulls you in:
- Overconfidence and illusion of control: Intraday pricing and instant execution create a feeling that you can out-manoeuvre the market by switching exposures at the right moment, even though the evidence says the switching itself is what costs you.
- Attention-driven buying: Barber and Odean’s “All That Glitters” documented that investors systematically buy what has recently been in the news or shown extreme price movement. In ETFs, that means rotating into hot sector and thematic funds precisely as they near their peaks.
- Recency bias: Morningstar’s investor-return research repeatedly finds that investors underperform the very funds they own, chasing recent winners and dumping recent losers, which is buy-high, sell-low behaviour by another name.
These pull you toward the buy button. A different set pushes you toward the sell button.
Research into behavioural biases at the sell decision finds the damage is concentrated there rather than at the buy: a University of Chicago study showed randomly selected exits outperformed professional portfolio managers by up to 150 basis points annually, suggesting the urge to sell is structurally more destructive than the urge to buy.
What pushes investors to sell
Loss aversion and myopic monitoring work together, and the combination is potent. Prospect theory holds that people dislike losses roughly twice as much as they like equivalent gains, and because ETFs price continuously, you can check them constantly. Frequent checking plus doubled emotional weight on losses produces a strong urge to sell into a fall to “stop the bleeding,” which locks in the loss and triggers a CGT event in one move.
Then there is action bias, a preference for doing something over doing nothing. On a low-cost platform with instant execution, inactivity starts to feel like negligence, so trades get made not because the investment case changed but because sitting still feels wrong.
The market context tells you this is happening at scale. That $196 billion traded on the ASX in 2025 reflects ETFs being used as trading instruments, not purely as long-term holdings. Australia’s broader equity turnover ratio sat at 49% in 2024, well above the global average of roughly 34% across 67 countries, per World Bank data.
What this means for you is that stronger willpower is not the answer. The urge feels justified because it is powered by genuine feeling and genuine data, so separating it from a real investment decision requires a structured process, not a promise to try harder next time.
What overtrading actually looks like in an ETF portfolio
So what actually counts as overtrading? The trap is assuming it means “trading a lot,” because plenty of legitimate activity involves trades. Periodic rebalancing, adjusting for a life-stage change, and switching to a demonstrably cheaper product are all normal portfolio management, not overtrading.
Overtrading is defined by the trigger, not the frequency. Here are the patterns that qualify, written the way they actually happen:
- You read that battery materials are the next big thing, sell part of your broad-market ETF, and buy a thematic fund that has already run hard. Three months later it has fallen and your diversified holding has recovered.
- Markets drop 6% over a fortnight, you sell your core Australian equity ETF to “stop the bleeding,” and you buy back in weeks later at a higher price, having crystallised a loss and a tax event for nothing.
- A cryptocurrency or technology ETF posts a huge quarter, so you pile in near the peak because the recent returns look irresistible, then ride the drawdown down.
- A social media post or a news alert prompts a trade you had no prior plan to make, and the rationale gets written after the market moved, not before.
Australian commentary from Firstlinks has flagged exactly these episodes, where investors concentrated into narrow thematic ETFs covering technology, battery materials, and cryptocurrencies near their price peaks and then suffered large drawdowns while diversified funds recovered faster. The scale is real too: roughly 47,700 ETF transactions per day confirms these instruments are being traded at volume, and total ETF assets across the ASX and Cboe reached $246.3 billion at the end of 2024, a 38.8% rise in market cap over the year.
Why ETFs make overtrading easier than it looks
ETFs are structurally primed for this. They trade intraday like ordinary shares, so the option to act is always available. They are heavily marketed by theme, which turns every macro headline into a matching product you can buy. And low headline brokerage removes the friction that once slowed impulsive decisions.
There is also a distortion in the content you consume. Accounts of successful tactical ETF trades circulate far more widely than accounts of the costly ones, a survivorship bias that makes activity look more rewarding than the aggregate data supports.
The diagnostic is simple, and you can run it now. Look at your last three ETF trades and ask, for each one, whether it was in your plan before the market moved, or whether the market moved first and the plan arrived second. If the market led and the plan followed, that was a behavioural trade.
A practical filter for separating genuine trades from behavioural impulses
Knowing the difference is not enough. You need a filter you can run on the next trade you feel the urge to make, and the good news is that the filter is concrete, not a vague appeal to discipline.
The foundation is an investment policy statement, which Vanguard’s guidance on disciplined investing treats as the base of everything. It is simply a written plan setting out your goals, your target allocation, your rebalancing bands, and the specific conditions that justify a change. If a proposed trade is not in that plan, it needs justification before you proceed, not after.
An investment policy statement codifies four structural advantages that superannuation funds apply automatically: automatic contributions, defined rebalancing bands, scheduled review intervals, and prohibited-action clauses that remove discretionary judgement from the moments when emotional pressure is highest.
Rebalancing rules make “legitimate” trading concrete. You rebalance when an asset class drifts beyond a set threshold, for example plus or minus 5 percentage points from its target, or on a fixed annual schedule. Anything outside those rules gets extra scrutiny by default.
To classify a trade quickly, use a traffic-light filter drawn from practitioner frameworks.
| Signal | Trigger Type | Required Action |
|---|---|---|
| Red | News, social media, fear or greed | Prohibited. Do not execute. |
| Amber | Cost or structural switch (lower fee, better product) | Requires documented analysis first. |
| Green | Rebalancing, cash deployment, life-stage change | Implements the plan. Proceed. |
Before any amber or green trade, run a cost-and-tax checklist so the numbers are on the table:
- Calculate the brokerage on both the sell and the buy.
- Estimate the bid-ask spread, wider for thematic ETFs than broad-market ones.
- Work out the CGT impact, including whether you have held the position for at least 12 months.
- Total those costs and state the expected benefit of the trade.
- Confirm the benefit clearly exceeds the total cost and aligns with your plan.
For the trades that clear the checklist but still feel emotionally charged, add a cooling-off rule.
Write down the rationale for the trade. Wait 24 to 48 hours. Execute only if the rationale still holds and still fits the long-term plan. If you cannot explain it in writing using only information available before the market moved, it is a behavioural trade.
If complete inactivity is psychologically difficult, some advisers suggest ring-fencing a small speculative sleeve, for example 5% to 10% of the portfolio, for tactical or thematic trading, while the core stays in a disciplined, low-turnover allocation. That acknowledges the urge to act while capping the damage it can do.
These frameworks are not there to stop you trading. They are the infrastructure that separates investors who compound wealth over time from those who erode it through accumulated, invisible costs.
This article is for informational purposes only and should not be considered financial advice. Investors should conduct their own research and consult with financial professionals before making investment decisions. Past performance does not guarantee future results.
Before your next trade, ask these three questions
Everything above collapses into three questions you can keep as a standing pre-trade checklist. Run them the next time your finger hovers over the buy or sell button, which for most investors will be within the next few weeks.
- Is this trade already in my investment plan? If it implements a rebalancing rule, a life-stage change, or a documented product upgrade, it is legitimate. If the plan is being written to justify the trade, it is not.
- Have I quantified the full cost, including tax? Brokerage, spread, and the CGT hit of selling before 12 months are elapsed all count, and the expected benefit has to clear that total.
- Have I waited long enough to know this is not a reaction to a headline? The cooling-off period exists so the rationale can survive a day or two away from the noise.
None of this means disengaging from your portfolio. Rules-based rebalancing, genuine life changes, and real product upgrades are all valid reasons to trade, and the framework is built to let those through while filtering out the rest.
The closing insight from the research is the one worth keeping. The investors who build the most wealth from ETFs are not the ones who pick the best funds; they are the ones who stay in good funds long enough for compounding to work. Barber and Odean measured the cost of failing that test at up to 9.6% per year, entirely from costs rather than selection errors.
That $196 billion traded on the ASX in 2025 is a collective number. Which side of it you finish on depends on how high you set the bar for what counts as a reason to trade, and the data suggests most investors are setting it too low.
For investors wanting to build the structural foundation that makes disciplined, low-turnover investing sustainable across decades, our comprehensive walkthrough of long-term wealth accumulation covers the compounding mechanics, ETF selection criteria, and tax-efficient structures that amplify every percentage point of return you preserve by not overtrading.