
In August 2026, the US Treasury spent nothing close to a market-moving sum buying back its own bonds, and knocked the 30-year yield down by nearly 10 basis points overnight. Within days, the yield had fully recovered. By conventional logic, the intervention failed.
By another reading, it did exactly what it was designed to do. That ambiguity sits at the centre of how modern government bond market interventions actually work, and getting it wrong will lead you to misprice sovereign risk.
The backdrop matters. By mid-2026, the 30-year Treasury yield had touched a 19-year high near 5.33% and USD/JPY had reached its weakest level in roughly 40 years. Policymakers in Washington and Tokyo responded with instruments that looked like routine market operations but behaved more like a threat.
Here is the distinction that changes everything. Whether an intervention moved prices is a different question from whether it shifted the cost of betting against the government. These are not the same thing, and confusing them produces the wrong read every time.
Why governments step in without flipping the switch on price controls
You probably assume government intervention means a hard line: a peg the central bank must defend, a floor under a currency, a ceiling on yields. That is one kind of intervention, and it is the rarer kind.
The far more common tool commits to nothing at all. A hard price control obligates the government to defend a specific level with unlimited resources, and its credibility lives or dies on follow-through. A signaling operation does the opposite. It names no level, intervenes at the authorities’ discretion, and draws its power precisely from the fact that the market cannot be sure what comes next.
Here is the contrast in plain terms.
- Hard price controls: an explicit level is defended, the obligation to intervene is effectively unlimited, and credibility depends on visible follow-through.
- Signaling operations: no explicit level is committed, intervention happens at discretion, and credibility depends on ambiguity rather than promises.
That ambiguity is the point. A sovereign government can move markets with modest flows because participants believe it has unlimited capacity to escalate, even when it has no intention of doing so.
IMF episode limits on intervention introduce an institutional constraint that the market-impact data alone does not capture: Japan’s free-floating classification caps the number of intervention episodes per six-month window, meaning the credibility of repeated signaling is bounded not only by market belief but by an international institutional ceiling.
The goal is not to anchor a price forever. It is to shift the risk calculus for speculators, raising the implied cost of holding a bet against the state. When a finance ministry issues a coordinated statement, treat it as a risk-repricing event, not a promise. That single reframe changes how you interpret every official announcement about “orderly markets.”
The two channels governments use to move markets without moving prices
The first is the signaling channel. Here, an operation changes what the market expects the government to do next, without changing anything about current fundamentals. A sterilised operation, meaning one that does not alter the money supply or interest rates, works entirely by adjusting expectations of future policy responses.
The second is the portfolio-balance channel. This one works by changing the actual supply and distribution of assets in the market. When an official buyer removes a chunk of long-dated bonds, private holders are nudged to rebalance toward other instruments, which shifts prices through supply and demand rather than through expectations alone.
When big ASX news breaks, our subscribers know first
Two case studies from 2026: what the Treasury and Japan actually did
On 19 August 2026, Treasury Secretary Scott Bessent announced mid-quarter that the Treasury would double its long-bond liquidity-support buybacks. Buybacks for 10-to-30-year securities rose from $2 billion to at least $4 billion per operation, running from 9 September through 4 November 2026, at a frequency of four times per quarter.
The aggregate mattered less than the message. The expansion added at least $14 billion in incremental support, taking the maximum potential quarterly buybacks to roughly $83 billion, up from a planned $69 billion.
Bessent was explicit about what this was, and was not.
The action was framed as “liquidity support” and a market-functioning measure, not a restart of quantitative easing. The stated point was to signal that yields did not reflect underlying fundamentals, and that policymakers would not let market dynamics dictate government decisions.
The 30-year yield, which had touched 5.33% on 18 August, dropped roughly 9 to 10 basis points to the 5.18-5.21% range. Then it climbed back. Within days it had retraced most of the move.
Now shift to Tokyo. Over 30-31 July 2026, the US and Japan executed their first coordinated yen intervention in about 15 years, acting under the September 2025 US-Japan Finance Ministers’ Joint Statement on excessive volatility. Japan acted unilaterally on 30 July, then jointly with the US on 31 July, spending an estimated ¥14 trillion (roughly $85 billion) across the two days.
The coordinated yen intervention revealed a structural design detail that the headline numbers obscure: the US participated by selling euro reserves rather than dollars or Treasuries, a deliberate choice to avoid flooding the Treasury market with supply at precisely the moment Washington was managing long-end yield pressure.
USD/JPY fell from intraday highs around 162.80-163.74 into the 155.23-157.80 range. Then, like the bond yield, it clawed most of it back, retracing 40% to 50% of the drop within two weeks.
Notice what the two operations share. In each, an official actor with perceived unlimited capacity stepped into the market at a moment of speculative extremity and made the cost of holding the position visible.
| Operation | Date | Instrument | Scale | Immediate Price Impact |
|---|---|---|---|---|
| US Treasury buyback expansion | 19 August 2026 | 10-to-30-year Treasuries | Up to ~$83B potential quarterly | 30-year yield fell ~9-10 bps to 5.18-5.21% |
| US-Japan yen intervention | 30-31 July 2026 | Yen buying (FX) | ~¥14 trillion (~$85B) | USD/JPY fell to 155.23-157.80 range |
Both retraced within days to weeks. That is not proof the operations failed. Each was calibrated to deter, not to reverse, which means you should judge success by what speculative positioning did, not by where prices settled. Recognise the structure once, and you will spot it the next time it appears, whether in bonds, currencies, or somewhere new.
How signaling shifts the cost of the trade, not just the price
Picture what a speculative trader saw on their screen in late August 2026. A large short position against Treasury futures, built over weeks, suddenly facing a new participant: an official buyer with an announced intent to keep buying, at a moment when yields were near a 19-year peak.
That is not a rhetorical gesture. It is a genuine pricing event, and here is why.
At the time of the buyback, systematic funds and trend-followers held historically large short exposure to US Treasury futures, estimated by Goldman Sachs at approximately $155 million DV01 (a measure of how much money moves for each basis point change in yield). Adding an official buyer to the long end skewed the distribution of risks against those shorts, raising the probability of a short squeeze, a forced buying rush as losing positions rush to exit.
The scale of the flow was almost beside the point. Empirical work on signaling finds that even sterilised operations can shift spot expectations by roughly 180 basis points and lift required risk premia by about 80 basis points, despite the actual flow being modest relative to market size.
The yen case follows the same logic. Knowing that a coordinated $85 billion intervention can be launched at any moment, with no warning, limits how much leverage a speculative short can safely carry. The potential loss from a second intervention is unquantifiable in advance, and that alone caps the size of the bet.
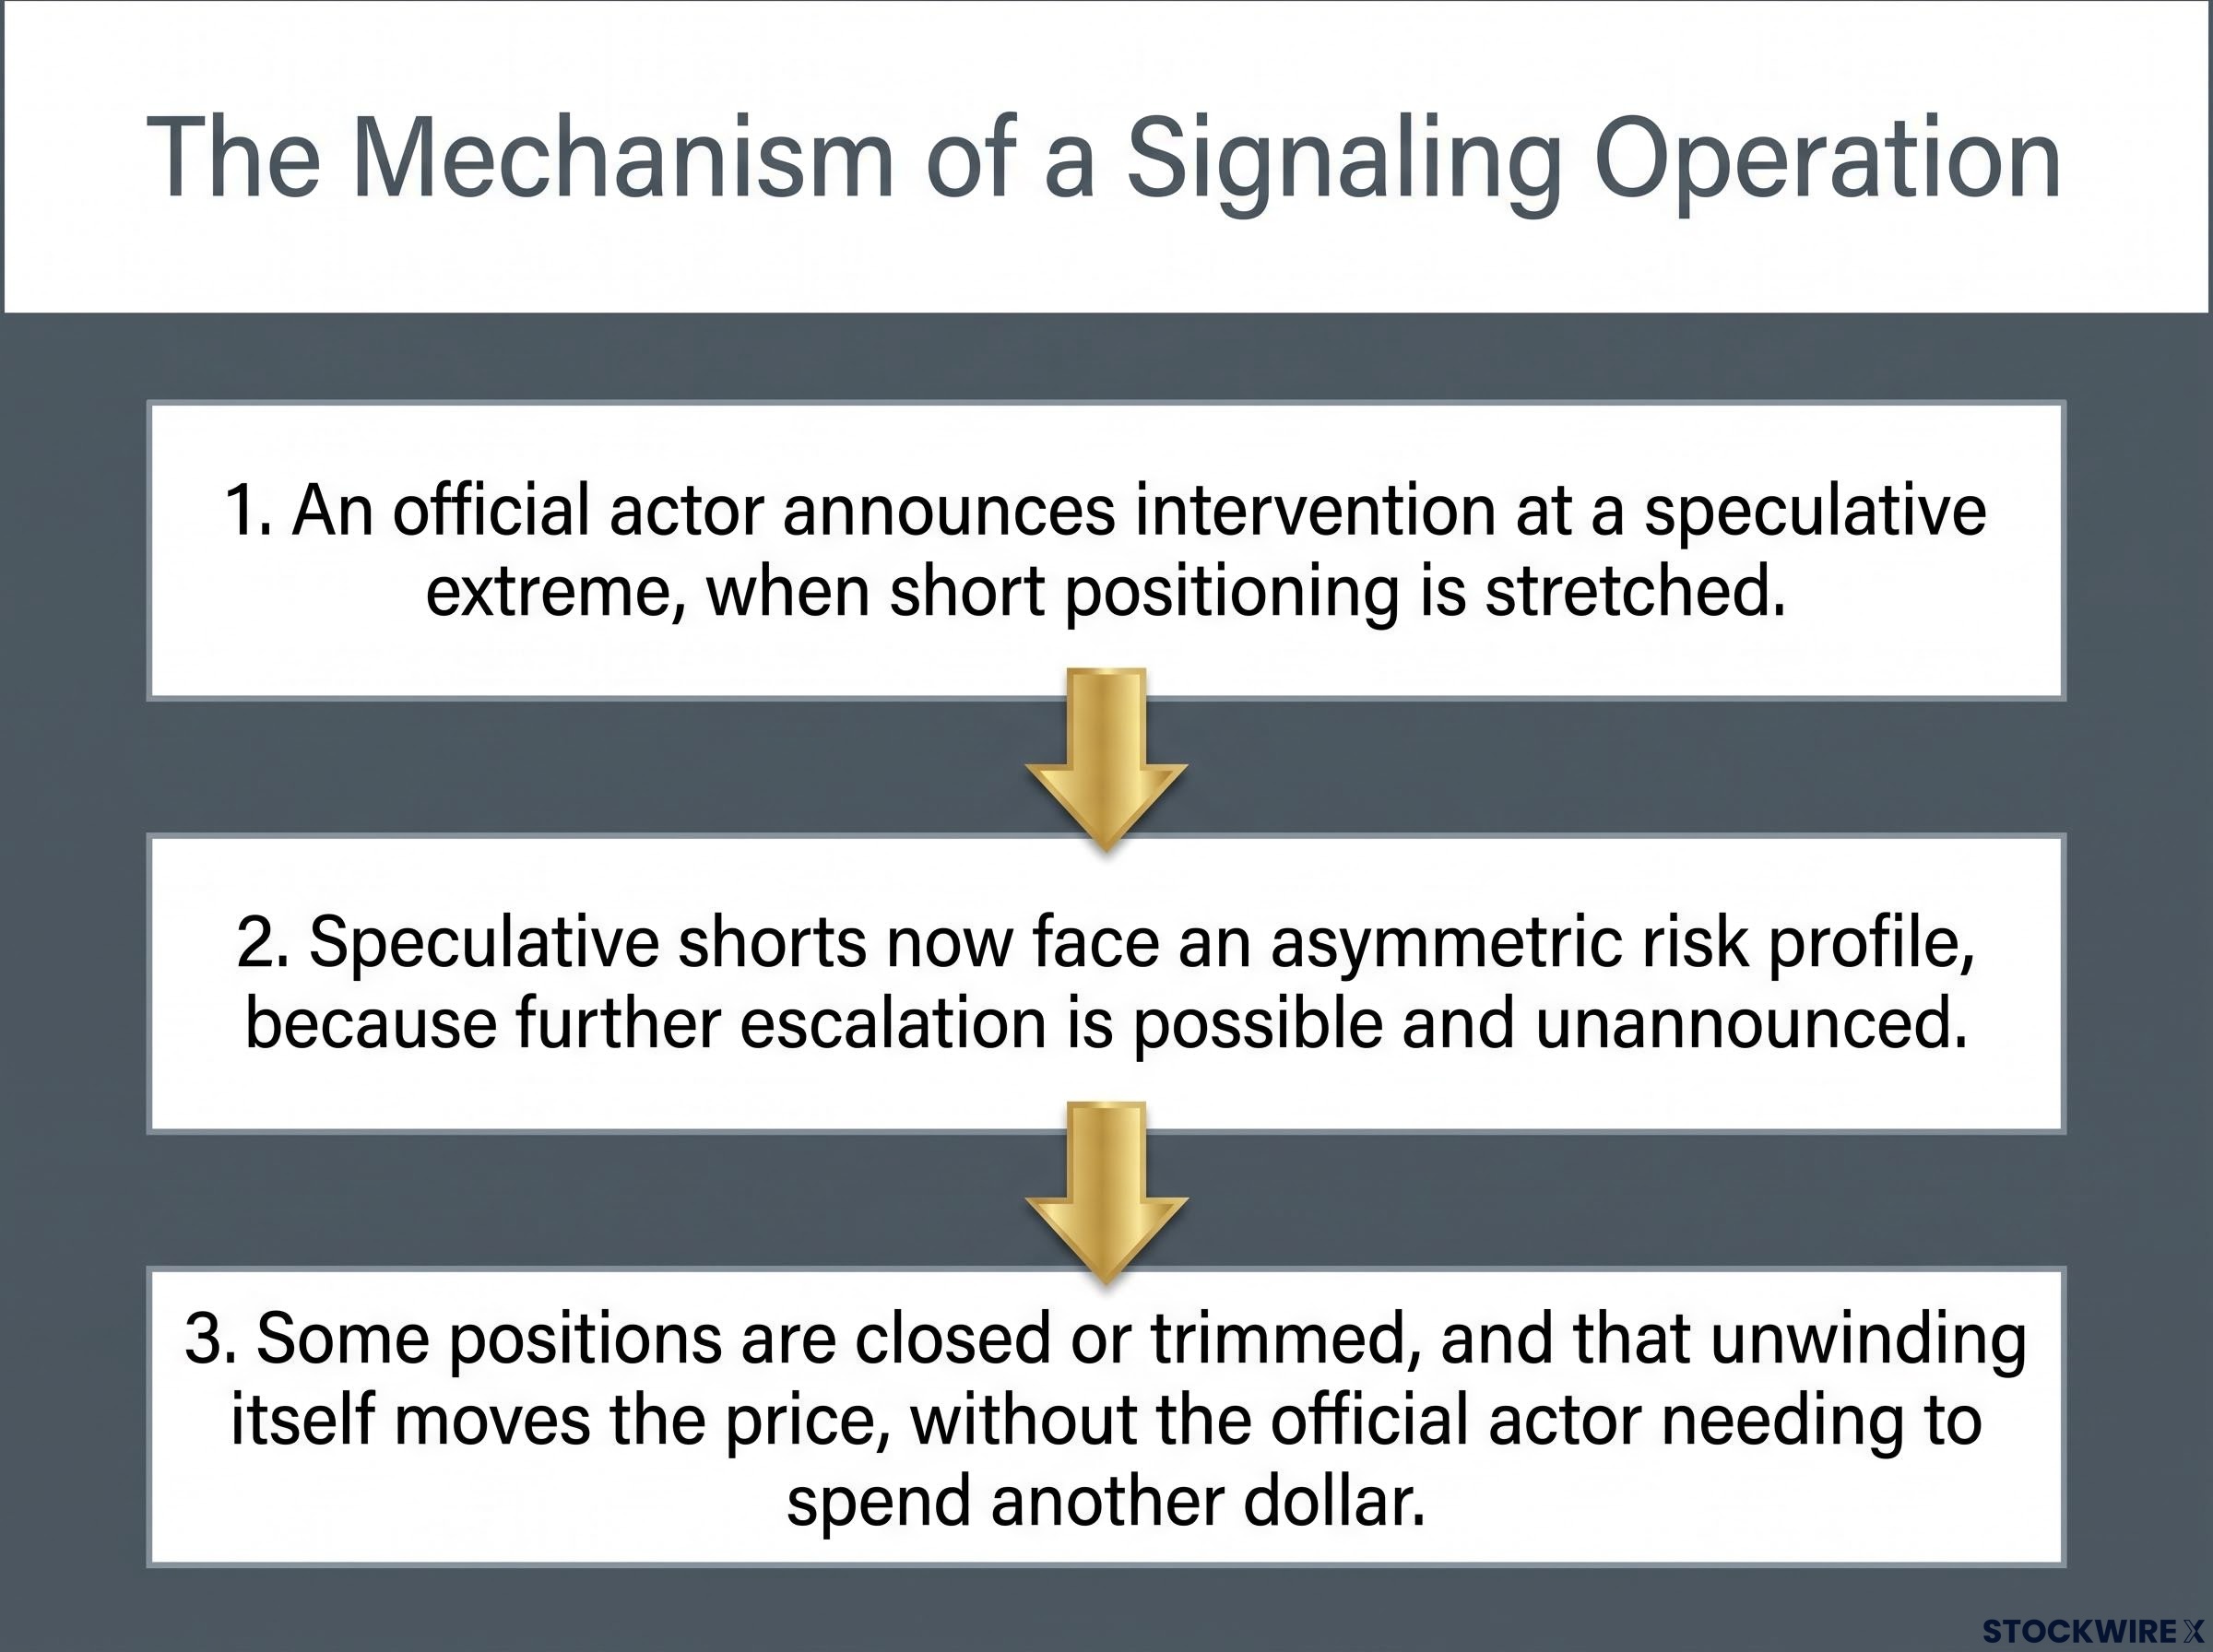
Here is the mechanism, step by step.
- An official actor announces intervention at a speculative extreme, when short positioning is stretched.
- Speculative shorts now face an asymmetric risk profile, because further escalation is possible and unannounced.
- Some positions are closed or trimmed, and that unwinding itself moves the price, without the official actor needing to spend another dollar.
The primary audience for these announcements is not the broad market. It is the concentrated speculative positions most sensitive to a forced unwind, and that targeting is deliberate. For anyone managing exposure to sovereign bonds or major currency pairs, that reframes both the announcement and the price action that follows.
What the Plaza Accord and yield curve control tell us about this playbook
The 1985 Plaza Accord is the usual benchmark for coordinated currency action. Comprehensive analyses conclude the sustained multi-year decline in the US dollar was driven mainly by underlying US monetary shifts, not the sterilised interventions alone. The coordination signal still mattered, though: it accelerated market positioning in the intended direction.
The Bank of Japan’s yield curve control offers the second lesson. Its experience showed that announcements moved the curve more heavily than the actual bond purchases did. It also showed the limit: signaling without fundamental alignment eventually creates compounding side effects that grow harder to manage over time.
Where this tool breaks down: the limits of governing by implication
The same mechanism that makes signaling powerful is what makes it fragile. Hold both ideas at once, because neither cancels the other.
The first vulnerability is credibility erosion. The signaling channel only works if markets believe a signal points to future policy escalation. Signal repeatedly without delivering sustained policy alignment, and the tool loses effectiveness precisely when conditions demand it most.
The second is moral hazard. Persistent liquidity support and FX intervention can reduce private trading volume, breed dependence on official backstops, and impair market development over time.
Then there is the empirical divide, which the 2026 cases put on full display. IMF work finds interventions can carry an impact half-life of 12 to 23 months when backed by cohesive policy. Sterilised operations without fundamental alignment tend to produce effects that evaporate within hours or weeks.
The 2026 numbers land squarely in the second camp. By 1 September 2026, the 30-year yield had risen to about 5.28%, close to pre-announcement levels. USD/JPY had retraced 40% to 50% of its intervention-driven drop within two weeks and consolidated back around the 160 level by late August.
Operation Twist’s historical ceiling offers the most instructive comparison point: the 2011-2012 Maturity Extension Programme, operating under favourable conditions and capped at $667 billion, delivered only around 15 basis points of long-end yield reduction, setting the benchmark against which the 2026 programme’s modest retracement should be measured.
Set that against the IMF benchmark.
IMF research finds interventions backed by cohesive policy can carry an impact half-life of 12 to 23 months. The 2026 operations retraced in days and weeks.
The gap between those timelines is the whole story. Consider the conditions under which signaling fails.
- Credibility erosion from repeated signaling without follow-through.
- Moral hazard as participants come to rely on official backstops.
- Volatility amplification when interventions conflict with domestic monetary policy.
- Fundamental misalignment, where global drivers such as inflation expectations, deficit levels, and energy prices continue to dominate price.
The retracement data does not tell you these tools are useless. It tells you they are situational. The conditions that make them work, credibility, surprise, fundamental alignment, and coordination, are not always present, so distinguishing a credible intervention from a deterrent-only operation has direct bearing on how you position around these events.
That is the trap to avoid at both extremes: dismissing every intervention as noise, and treating every announcement as a hard ceiling. The durable shifts live in a narrow set of conditions, and most operations do not meet them.
Reading the next intervention before it moves the market
The next time you see an official statement about “orderly markets” or “liquidity support,” you do not need to guess. You can assess it against the distinction this article has built: a signaling operation is a risk-repricing event aimed at speculative positioning, not a price guarantee.
To read one in real time, ask three questions.
- Credibility: does the policymaker have a track record of following through on signals, or of signaling and stopping?
- Coordination: is this unilateral, or a joint operation with binding international commitment?
- Fundamental alignment: does the intervention direction match the underlying macro trajectory in inflation, fiscal balance, and monetary policy stance?
The historical set gives you the comparison points. The Plaza Accord shows coordination accelerates trends already supported by fundamentals. Bank of Japan yield curve control shows announcements can outweigh flows but strain under misalignment. Fed and ECB verbal interventions show statements stop working once markets learn they are not tied to real policy.
This is not a financial advice piece, and it is worth saying plainly here.
This article is for informational purposes only and should not be considered financial advice. Investors should conduct their own research and consult with financial professionals before making investment decisions. Past performance does not guarantee future results, and forward-looking assessments are subject to market conditions and various risk factors.
The macro conditions that make this playbook likely to recur
As of September 2026, neither of the pressures that triggered these interventions has been resolved. The fiscal dynamics pushing long-end Treasury yields toward 5.25-5.28% remain in place, and the interest rate differential driving yen weakness near 160 has been managed, not cured.
The fiscal dynamics driving long-end yields create a structural asymmetry that matters for how the next intervention is read: with gross federal debt above $40 trillion and annual interest payments exceeding the defence budget, the incentive to reach for the signaling toolkit is persistent, but the fundamental pressures working against any given operation are also larger than in any prior cycle.
That leaves a standing incentive for policymakers to reach for the signaling toolkit again. When they do, the three-variable checklist turns you from a passive observer into an active interpreter. Each recurrence becomes a case you can read, rather than a fresh shock you can only react to.