You have stared at a forex chart layered with coloured lines, arrows, and oscillators, and had no idea which signal to act on first. That moment of paralysis is not a knowledge gap. It is a process gap, and it is exactly what a structured approach to technical analysis fixes.
Forex technical analysis is not about predicting where price will go. It is about reading what price and indicators are showing you right now and building conditional scenarios from that information. Throughout this guide, USD/MXN serves as the live case study, not because the pair is unique, but because it produces clean, observable patterns across three core tools: simple moving averages, trend lines, and RSI. The same five-step framework applies to EUR/USD, GBP/JPY, or any other pair on your screen.
By the time you finish, you will have a repeatable five-step process you can apply to any currency pair on any platform, turning a cluttered chart into a structured decision map you can act on with confidence.
This article is for educational purposes only and does not constitute financial or investment advice. Forex trading involves significant risk of loss. Consider your objectives, experience, and risk tolerance, and consult a licensed financial professional before trading.
What USD/MXN tells you before you place a single indicator
In USD/MXN, USD is the base currency and MXN is the quote currency. A price of 17.30 means one US dollar buys 17.30 Mexican pesos. When that number rises, the dollar is strengthening against the peso. When it falls, the peso is gaining ground. Misreading which direction is bullish or bearish for your position is one of the most common errors new forex traders make, and it starts right here with the quote itself.
The CFTC forex trading guidance outlines the risks retail participants face in leveraged currency markets, including the importance of understanding quote conventions and directional exposure before placing any trade.
USD/MXN works well as a teaching vehicle because it is actively traded, liquid enough to produce clean technical patterns, and sits at the intersection of macro themes (Fed versus Banxico monetary policy, broader risk sentiment) that traders later combine with technical views. But the pair is just the classroom. The framework is the skill.
Before you plot a single indicator, ground yourself in these core principles:
- Technical analysis reads current price action and indicator readings. It does not predict the future.
- Your job is to build conditional scenarios (“if price does X, then I do Y”), not to pick a single forecast.
- Technical analysis complements fundamental and macroeconomic analysis. It does not replace either.
Candlestick formats, timeframe selection, and volume interpretation are the building blocks of reading stock charts across any asset class, and grounding yourself in those basics before adding oscillators and moving averages significantly reduces the noise you have to filter on a live chart.
Understanding what the number on your screen mechanically means determines whether a rising price is bullish or bearish for your position. Get that right, and every step that follows sits on solid ground.
When big ASX news breaks, our subscribers know first
Step 1: How simple moving averages reveal trend direction and resistance ceilings
A Simple Moving Average (SMA) is the average closing price over a fixed number of periods. A 20-day SMA on a daily chart, for example, adds up the last 20 closing prices and divides by 20. That single line serves two purposes: it shows you trend direction, and it marks a dynamic level where price often pauses, bounces, or reverses.
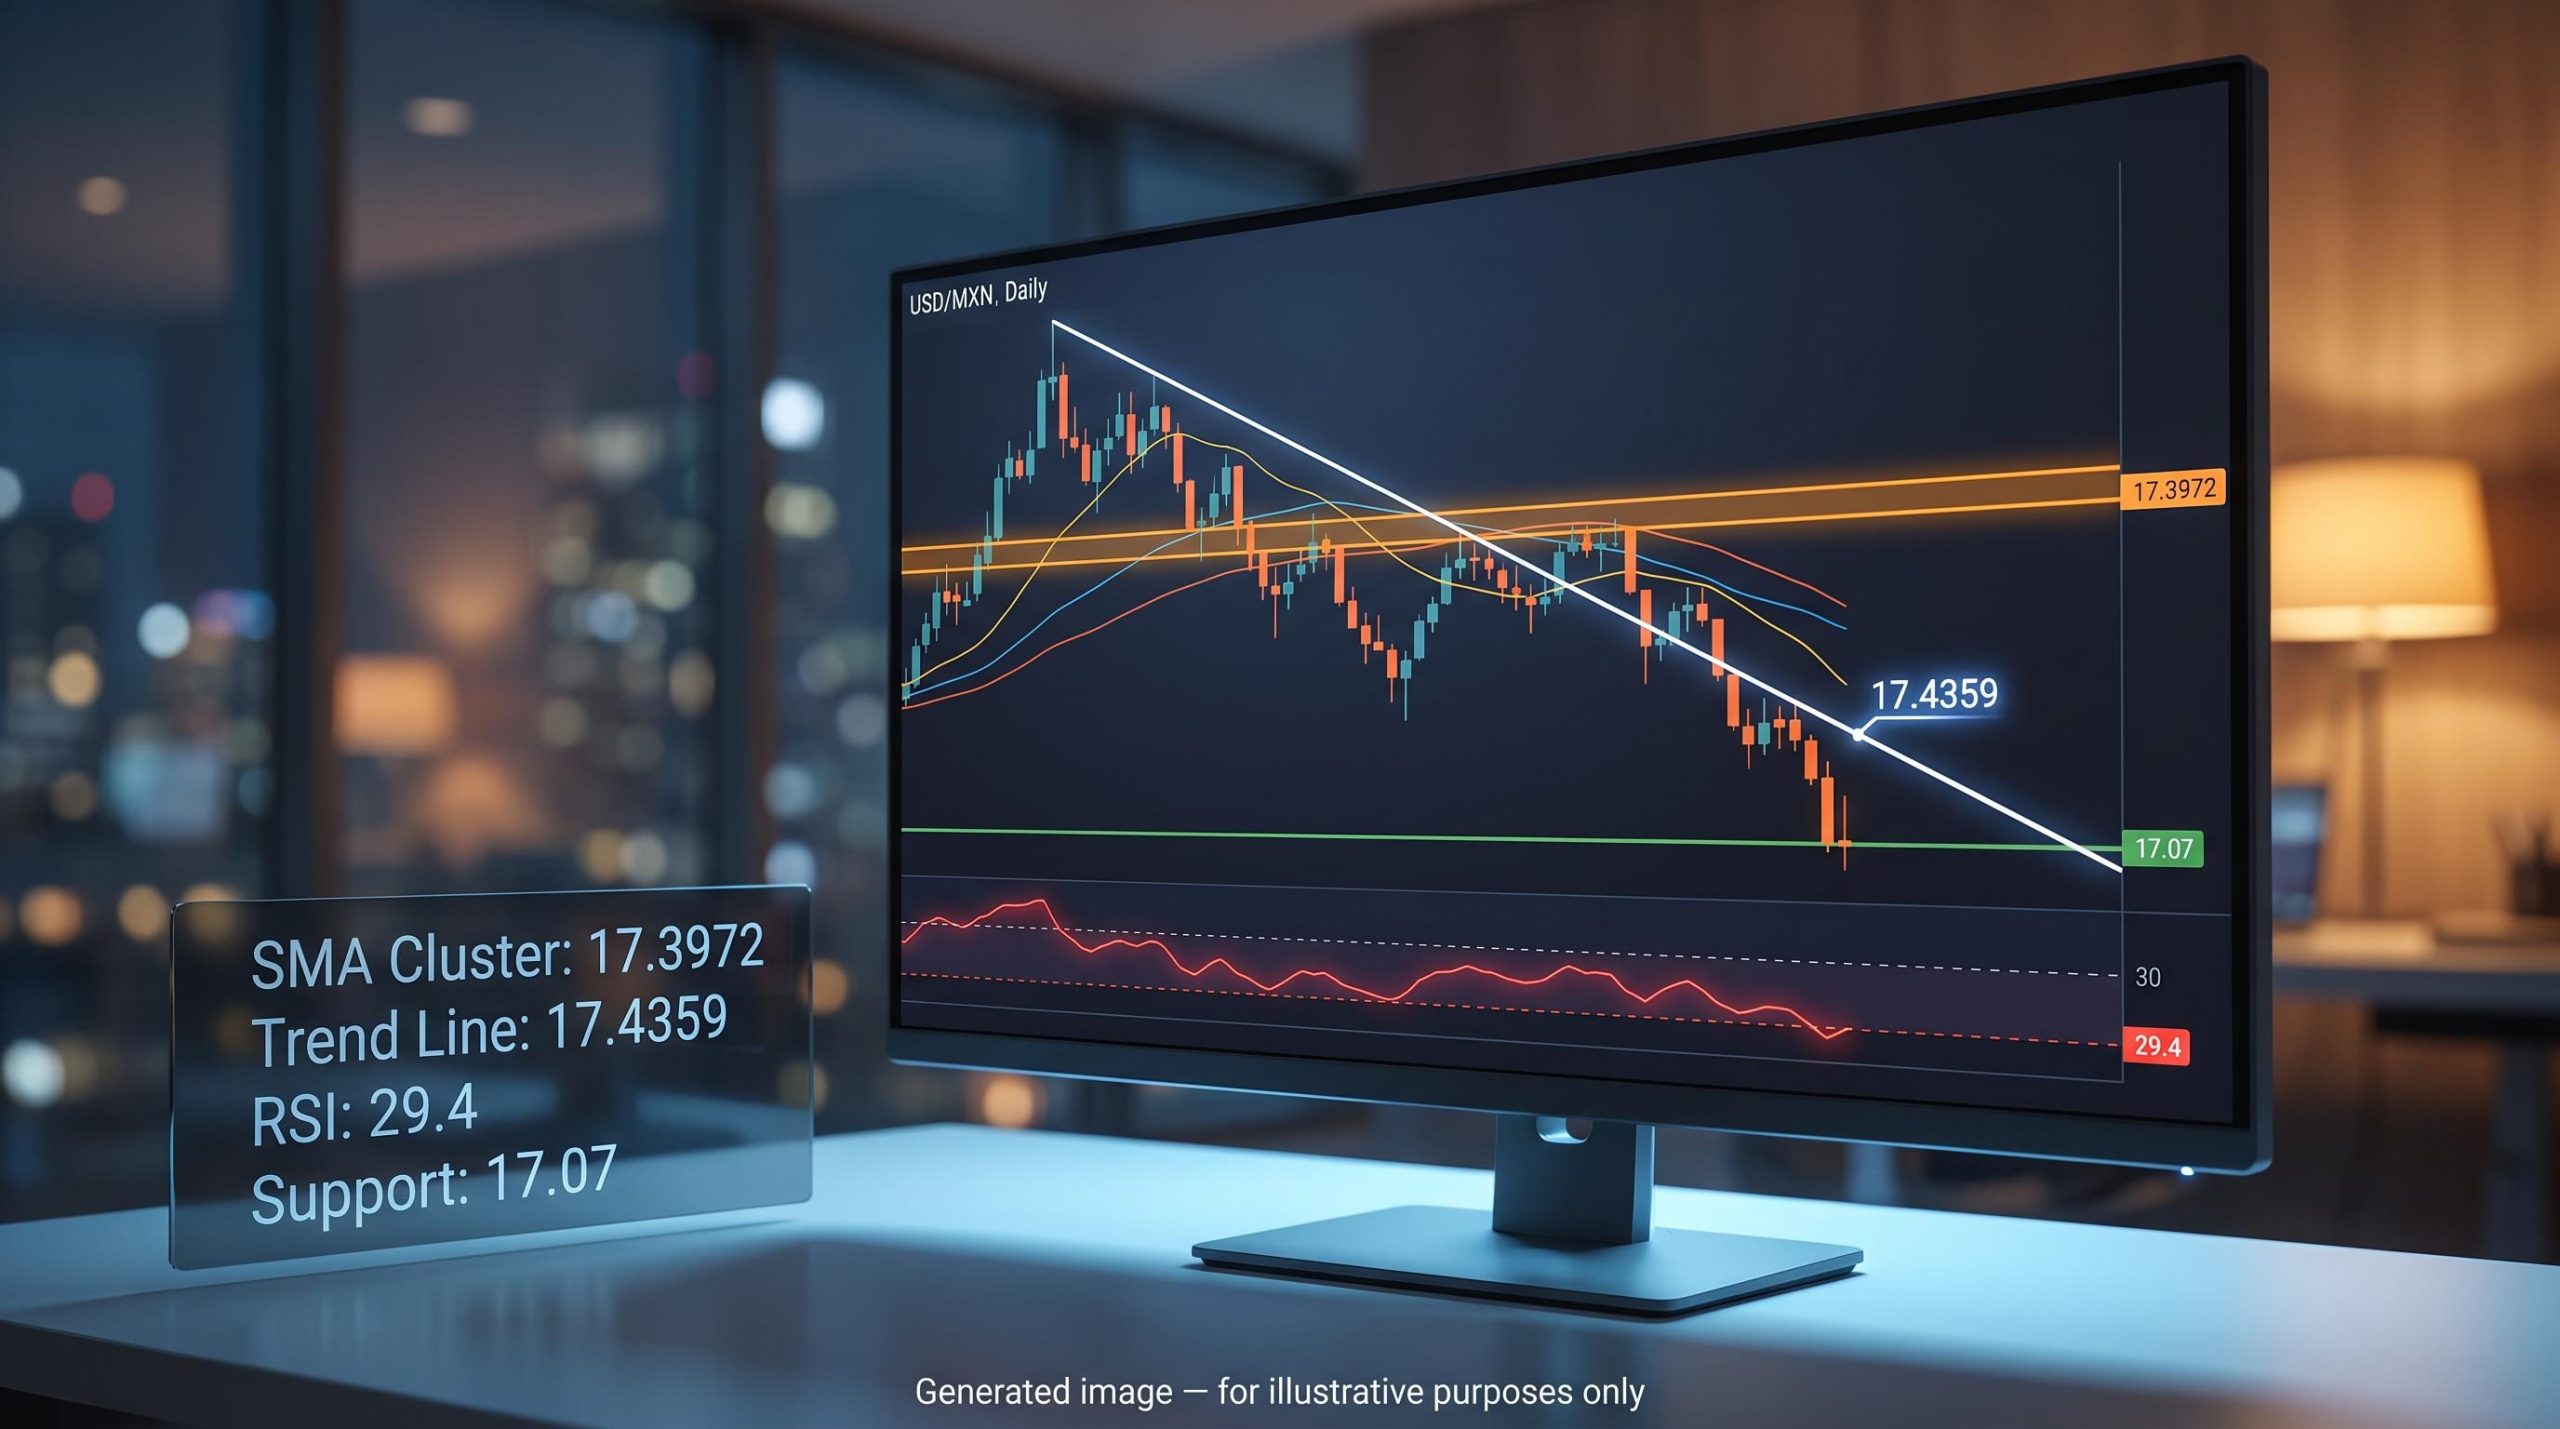
The real power shows up when you layer several SMAs together. When the 20, 50, and 100 SMAs converge in a tight price area, they create what is called a cluster: a reinforced resistance or support zone that is harder for price to break through than any single moving average on its own. According to FXStreet’s AI-assisted technical reading of the USD/MXN daily chart, the three moving averages had converged near 17.3972, forming a reinforced overhead barrier with price sitting beneath all three and each average angled lower, pointing to a bearish structural bias.
Earlier research snapshots showed shorter SMAs (5-20) sitting around 17.14-17.19 and longer SMAs (100-200) around 17.22-17.30, painting the same bearish structural picture across different timeframes. The conclusion is consistent: price below a falling SMA cluster means sellers are in control.
“Price below a falling SMA cluster signals bearish bias. Any bullish attempt must break and sustain closes above that cluster to weaken it.”
Here is what to do on any pair you analyse:
- Plot the 20, 50, 100, and 200 SMAs on your daily chart.
- Ask whether price is above or below the cluster, and whether the SMAs are fanning out (strong trend) or converging (possible transition).
- Mark the SMA cluster as your first major resistance or support zone.
The SMA cluster near 17.3972 carries real analytical weight. For USD/MXN’s bearish bias to genuinely weaken, bulls would need to push price through that convergence zone and hold above it across multiple closing sessions. That same logic transfers directly to any pair on your watchlist.
Step 2: Drawing a descending trend line and what it adds to the picture
A descending trend line is a straight line drawn across a sequence of lower swing highs in a downtrend. Each lower high confirms that rallies keep failing at progressively lower levels, giving you a visual ceiling that slopes downward over time.
For a trend line to carry analytical weight, it needs to meet specific validity criteria:
- At least 2-3 clean touch points where price reaches the line and reverses.
- Minimal candle bodies closing beyond the line (wicks touching the line are acceptable; sustained closes beyond it are not).
- A stable angle that does not require constant redrawing every few sessions.
Applying the trend line to USD/MXN
On the USD/MXN daily chart, FXStreet’s reading placed a falling trend-line barrier at approximately 17.4359, a level that clears the SMA cluster at 17.3972 and together with it forms a two-barrier overhead structure.
That layered picture is where the real value emerges. Your scenario map now has two distinct rejection points:
- A rally that stalls at the SMA cluster (17.3972) and reverses reinforces the bearish bias without even reaching the trend line.
- A rally that pushes through the SMA cluster but fails at the trend line (17.4359) tells you the structure is bending but not breaking.
- A decisive close above both layers, sustained over several sessions, is the signal that momentum may genuinely be shifting.
The gap between the SMA cluster and the trend line (approximately 40 pips in this reading) is not noise. It represents a defined zone of overhead supply, and understanding that gap tells you exactly how much work a bullish recovery scenario needs to do. When you draw trend lines on your own charts, layering them on top of SMA analysis gives you a structural map rather than a single line to watch.
Step 3: Reading RSI correctly: momentum confirmation, not a buy signal
The Relative Strength Index (RSI) is a 14-period momentum oscillator that ranges between 0 and 100. It measures how aggressively price has moved in one direction relative to recent history. The standard zones are:
- Above 70: overbought, meaning bullish momentum is stretched.
- Below 30: oversold, meaning bearish momentum is stretched.
- Around 50: neutral.
Here is the mistake that costs traders money: treating an oversold reading as an automatic buy signal. In a strong downtrend, RSI can remain below 30 for extended periods while price continues falling. Oversold tells you that selling has been unusually aggressive relative to recent sessions. It does not tell you the selling is about to stop.
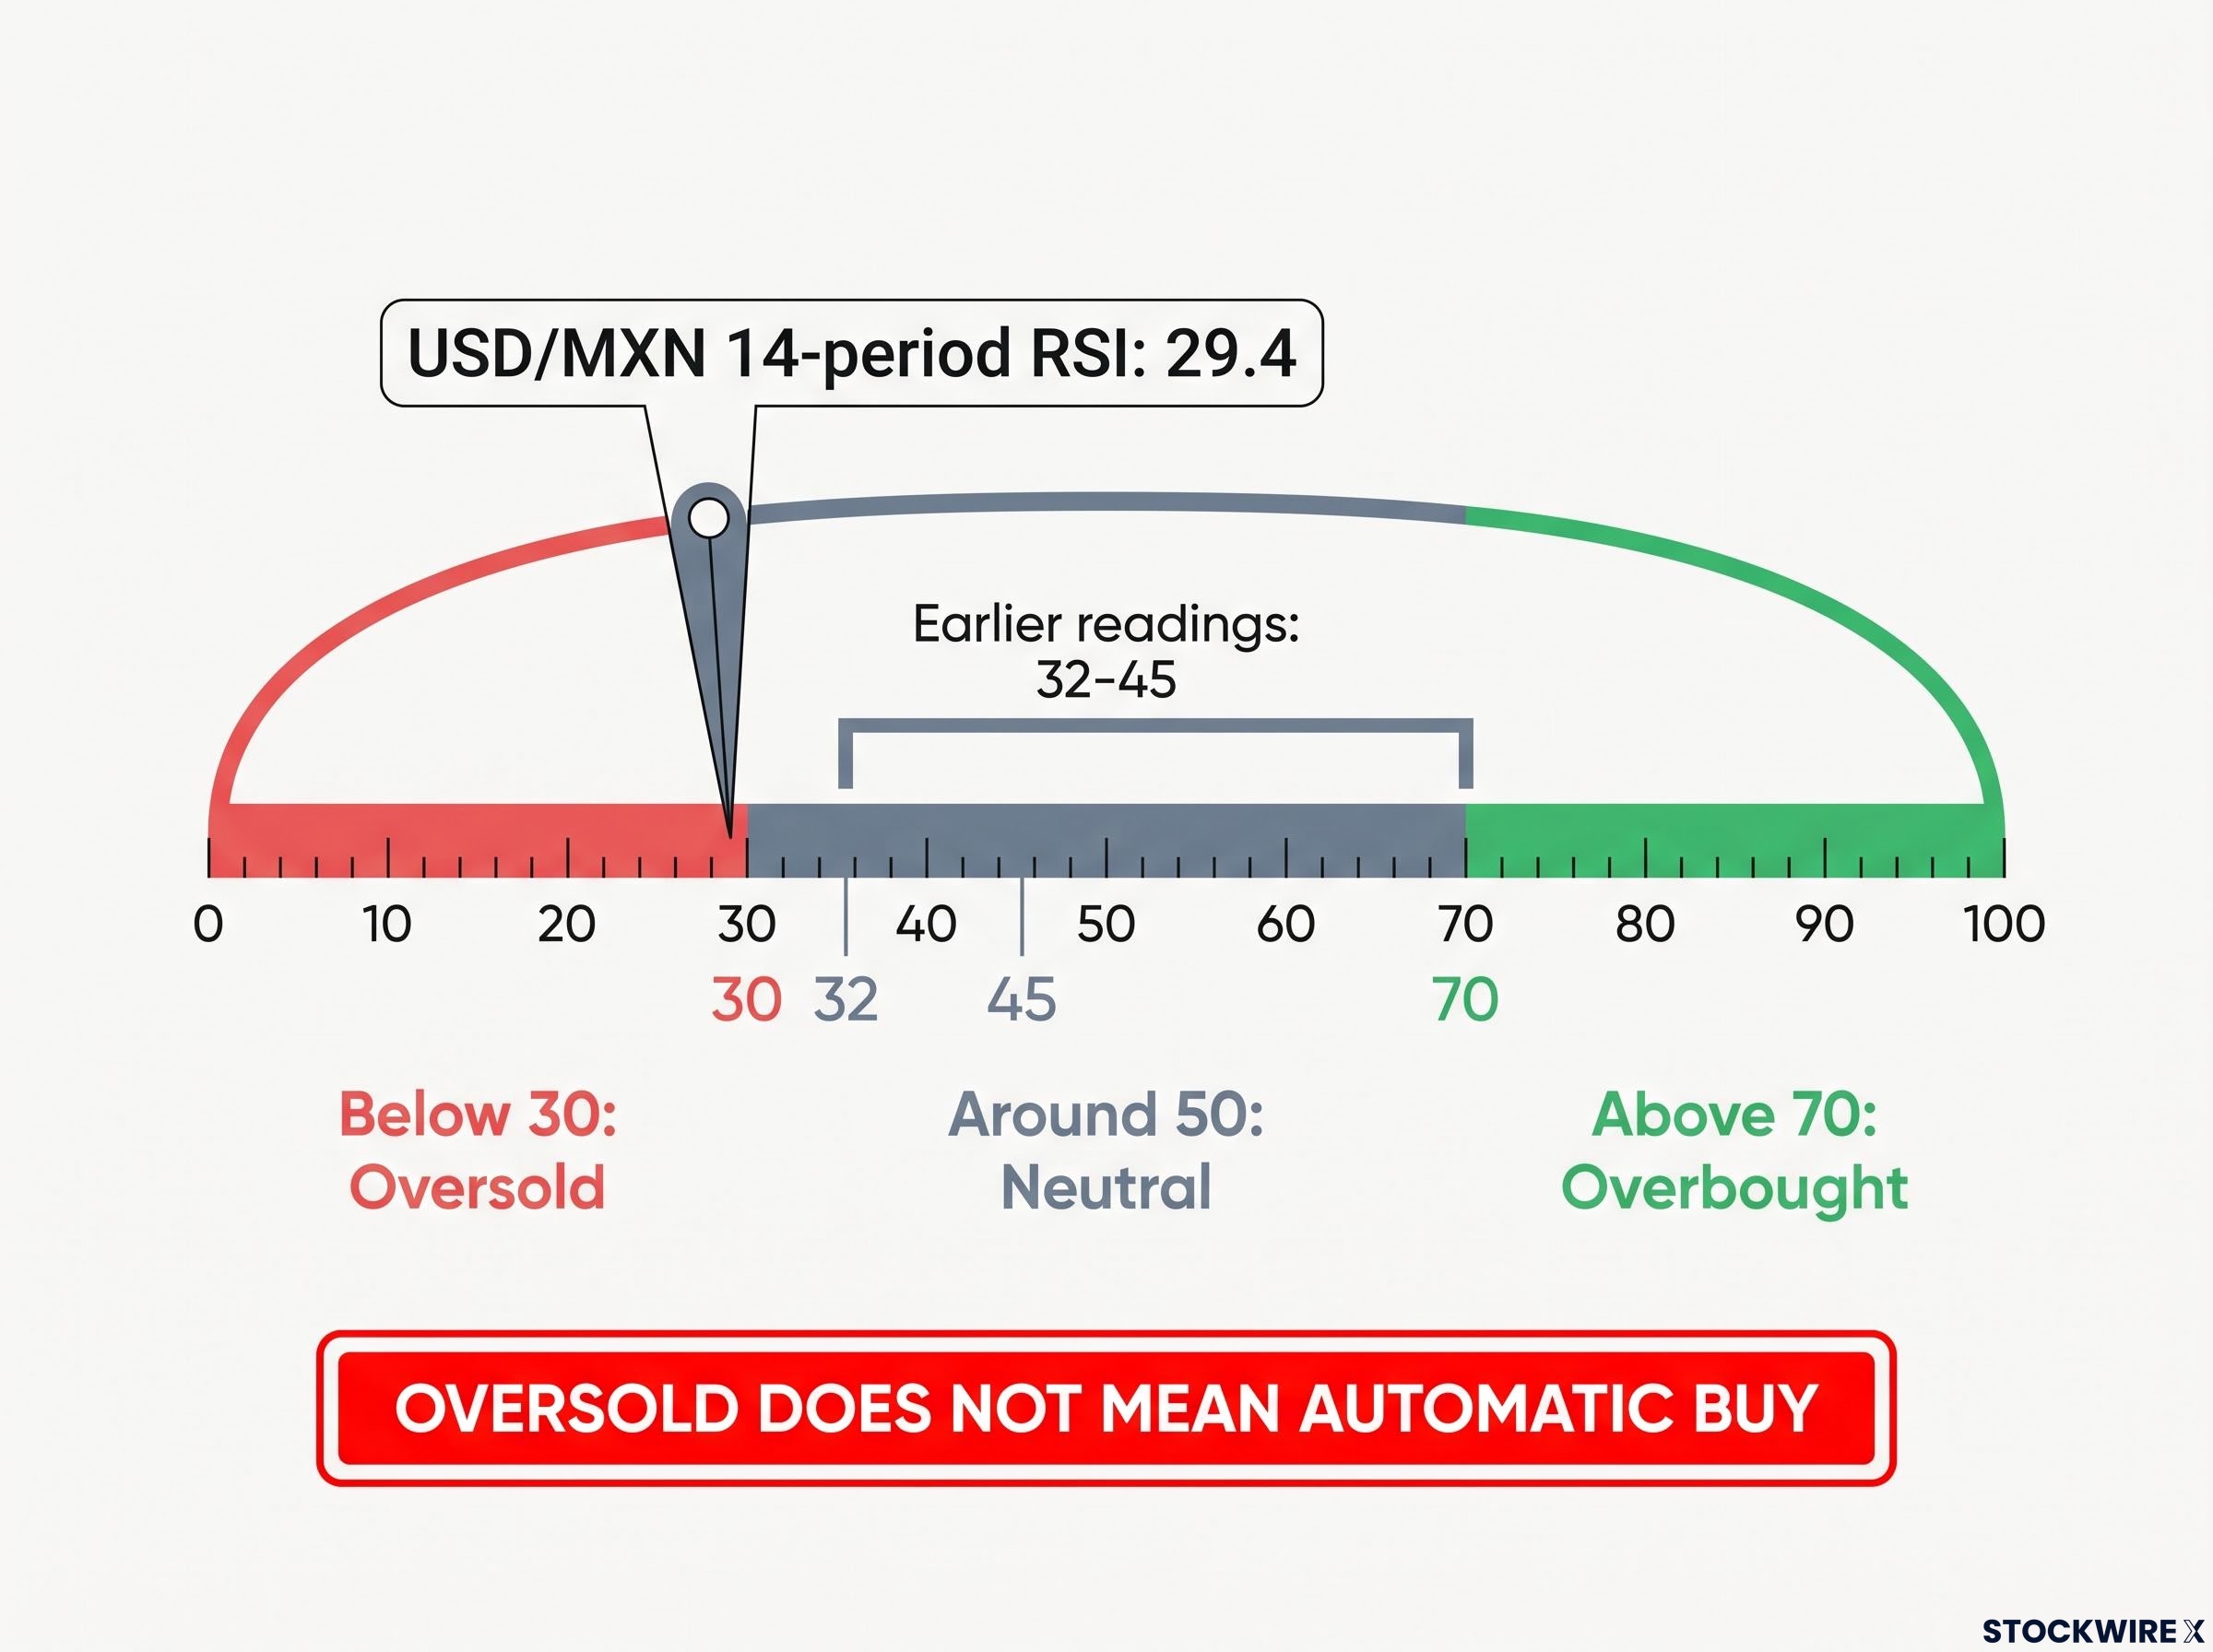
“Oversold does not mean automatic buy. In a strong downtrend, RSI can stay below 30 for extended periods while price continues falling.”
FXStreet’s AI-assisted reading of the USD/MXN daily chart showed the 14-period RSI had dropped to 29.4, pushing the pair into oversold territory while the broader bearish trend remained intact. Earlier research snapshots showed RSI values around 32-45 (neutral to mildly weak), consistent directionally but less extreme. The more recent reading suggests selling momentum had extended further.
From this oversold position, two signals are worth watching:
- RSI staying at or below 30 while price continues making new lows: bearish acceleration. The trend is intensifying, not exhausting itself.
- RSI climbing from low levels while price holds a higher low: a potential divergence signal suggesting corrective recovery pressure is building.
A 14-period RSI of 29.4 is not an invitation to buy USD/MXN. It tells you the selling has been aggressive and extended, which is meaningful context for your scenario map. But the trend structure you built in Steps 1 and 2 (SMA cluster, trend line) determines what you actually do with that information. RSI confirms; it does not command.
RSI at index level behaves differently from RSI on individual currency pairs or stocks: when the S&P 500’s daily RSI reached 78 in May 2026, a reading so rare that only six comparable instances had been identified since 2023, five of those preceded drawdowns of at least 7%, illustrating how the same oscillator principle carries different interpretive weight depending on the asset and timeframe.
Step 4: Mapping support and resistance so you know where price may pause
Your support and resistance map is built from three sources:
- Prior swing highs and lows: horizontal levels where price previously reversed or paused.
- Role-reversal levels: a former resistance ceiling that, once broken, becomes a support floor (or vice versa).
- Round numbers (e.g., 17.00, 18.00): these attract orders and act as psychological barriers.
Treat every level as a zone rather than a single exact price. Markets do not respect decimal points with surgical precision.
Price discovery mechanics explain why support and resistance zones attract clusters of orders at specific levels: buyers and sellers who have previously transacted at those prices retain a reference point, and when price returns, competing bids and offers concentrate in the same area, giving horizontal levels their analytical significance.
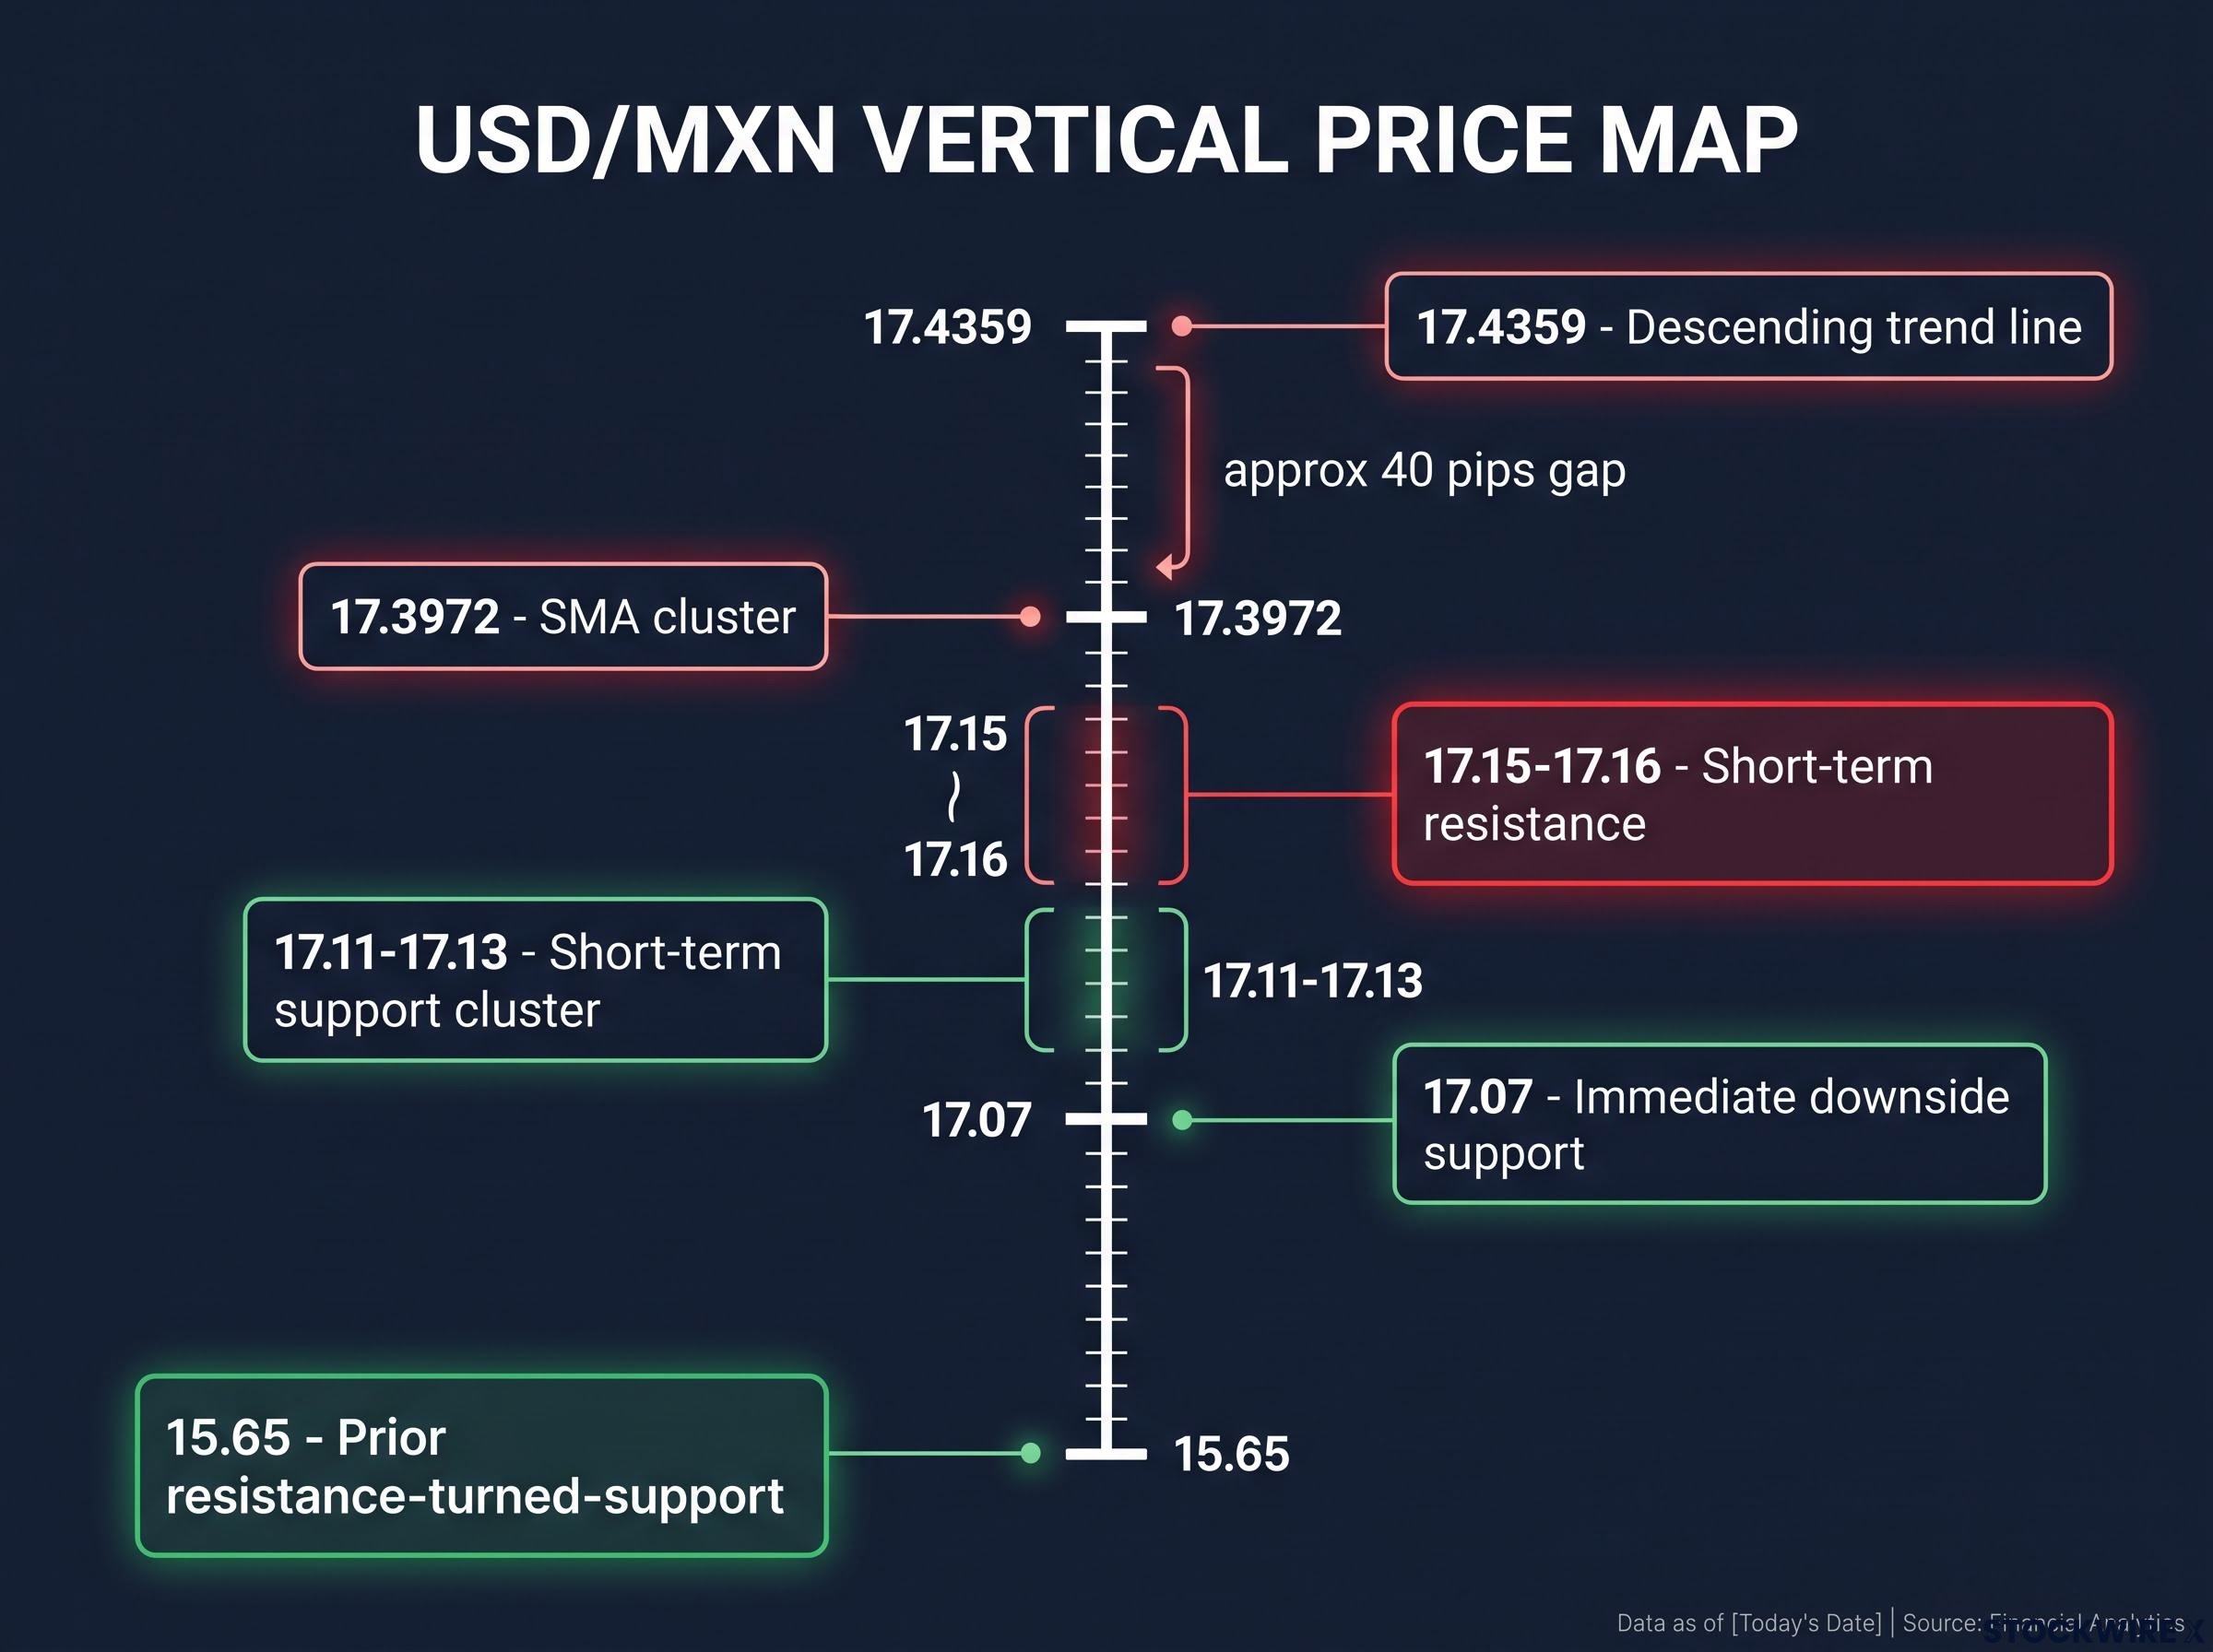
For USD/MXN, the research provides a layered map spanning immediate levels to deeper structural references. FXStreet’s daily chart reading identifies immediate downside support near 17.07, while earlier snapshots showed a short-term support cluster around 17.11-17.13. Short-term resistance above price sat near 17.15-17.16 in earlier readings, with the SMA cluster (17.3972) and descending trend line (17.4359) forming the primary overhead barriers you already know from Steps 1 and 2.
Further down the chart, FXStreet’s analysis points to 15.65 as a longer-term downside reference where a former ceiling flipped into a floor once price broke above it, providing a concrete illustration of how role-reversal levels work in practice.
| Level | Price Area | Type | Significance |
|---|---|---|---|
| Immediate downside support | 17.07 | Support | Nearest floor below current price (FXStreet daily reading) |
| Short-term support cluster | 17.11-17.13 | Support | Intraday/short-term support from earlier snapshots |
| Short-term resistance | 17.15-17.16 | Resistance | Nearest overhead barrier from earlier snapshots |
| SMA cluster | 17.3972 | Resistance | Triple SMA convergence; primary overhead ceiling |
| Descending trend line | 17.4359 | Resistance | Second barrier above SMA cluster; layered overhead supply |
| Prior resistance-turned-support | 15.65 | Support | Longer-term downside reference; role-reversal level |
The distance between immediate support (17.07) and the primary overhead resistance (17.3972) defines the current trading range you should be aware of. Moves within that range are noise. Moves that break either boundary cleanly are the signals worth incorporating into your scenario map.
Step 5: Building your scenario map: three conditional branches, not one prediction
Everything you have built across Steps 1-4 now feeds into a single output: a scenario map. Instead of predicting one outcome, you predefine three branches and specify the trigger conditions, key levels, and logical targets for each before price moves. This is where technical analysis becomes a decision framework.
- Bearish base case (trend continuation): Price remains below the SMA cluster. The descending trend line holds on any tests. RSI stays weak, at or below the 30-40 range. Support zones at 17.07-17.13 are gradually tested. If those break, the deeper reference at 15.65 (the prior resistance-turned-support) becomes the longer-term downside target.
- Corrective recovery scenario: Price closes above the SMA cluster (17.3972) with follow-through. The descending trend line is broken and retested from above. RSI climbs through 40-50, confirming a momentum shift. At that point, you reassess your medium-term trend bias entirely.
- Acceleration (breakdown) scenario: Price breaks below 17.07 (or the 17.11-17.13 cluster) on strong momentum. RSI stays weak or makes new lows with no divergence present. The next lower structural support on your map becomes the logical target.
“When one scenario is invalidated, switch calmly to the next branch. The map does not fail because one branch does not play out; that is what the other branches are for.”
Having three pre-defined branches means you are never surprised by price. Whether the move goes up, down, or accelerates lower, you have already decided what it means and what you will do. That is the practical difference between disciplined analysis and reactive guessing. The same three-branch logic applies to EUR/USD, GBP/JPY, or any pair you follow.
Five mistakes that undermine a solid technical read
- The RSI misuse error. Treating RSI below 30 as a guaranteed buy signal without checking whether the broader trend supports a reversal. The corrective principle: RSI tells you momentum is stretched, not that it is about to reverse. Always check trend structure first.
- The premature validation error. Declaring a trend line valid with only two touch points and ignoring false breaks where price briefly pierces the line before reversing. The corrective principle: wait for at least 2-3 clean touches and watch how price behaves at the line, not just whether it reaches it.
- The timeframe hierarchy error. Trading a 15-minute chart support level against a strong daily downtrend. The corrective principle: the higher timeframe trend sets the directional bias. Lower timeframe levels only matter when they align with that bias.
- The precision illusion error. Treating support and resistance as single exact prices rather than flexible zones. The corrective principle: markets do not reverse at the fourth decimal place. Work with zones, and give your levels room to breathe.
- The emotional override error. Abandoning your scenario map when one branch is invalidated and improvising a new plan on the spot. The corrective principle: if your first scenario fails, that is not a system failure. It is the system working. Move to the next branch calmly. Most trading losses originate from the moment a trader overrides their own process.
Applying the five-step framework to any currency pair you follow
USD/MXN was the teaching vehicle. The five-step process is the asset you take with you. Here is the checklist you can run on any pair, on any platform, every time you sit down to analyse:
- Plot the 20, 50, 100, and 200 SMAs on your daily chart and ask: is price above or below the cluster, and are the SMAs fanning out or converging?
- Draw the main trend line connecting at least two to three swing highs (downtrend) or swing lows (uptrend). Note where it sits relative to the SMA cluster.
- Check the 14-period RSI and note whether it is overbought, oversold, or neutral. Look for divergence between RSI direction and price direction.
- Mark support and resistance zones from prior swing highs and lows, role-reversal levels, and round numbers. Build your price map.
- Build a three-branch scenario map with trigger conditions, invalidation levels, and targets for each branch: continuation, corrective recovery, and acceleration.
Running this checklist before forming any view means you start from structure rather than instinct. That is the practical difference between a disciplined analytical process and a gut-feel trade dressed up with chart lines.
For readers wanting to understand how positions on currency pairs like USD/MXN are sized and funded in practice, our dedicated guide to CFD leverage and margin explains how a 5% adverse move on a leveraged position produces a loss far larger than 5% on the capital deployed, with jurisdiction-specific regulatory caps covered in detail.
“Technical analysis is not prediction. It is structured preparation: you define what each scenario requires to become valid before price moves, so you are responding to evidence rather than reacting to emotion.”
This article is for informational purposes only and should not be considered financial advice. Investors should conduct their own research and consult with financial professionals before making investment decisions. Past performance does not guarantee future results. These scenarios are illustrative and subject to change based on market developments.