
AI, Railways, and the Case for Surviving the Bubble First
10 hrs ago

Australian technology stocks have recovered meaningful ground since the 2022 growth-stock de-rating, but the gains have been uneven, and the macro backdrop has made timing the next move feel treacherous. Capital is rotating, sector leadership is shifting, and the question of whether this is a durable turn or another false start has real money attached to it for investors holding names like Pro Medicus, Xero, Wisetech Global, and Technology One. A possible topping signal on the Nasdaq, an uncertain rate trajectory, and choppy sector rotation across the ASX 200 have combined to make the timing question more consequential than it has been in months.
This analysis applies a specific technical framework to assess whether ASX tech stocks are approaching a genuine entry point, and breaks down the five signals that underpin that assessment so investors can evaluate setups themselves rather than relying on someone else’s read of the chart.
Most investors already know which technology stocks they want to own. The harder and more expensive problem is buying the right stock at the wrong point in the trend, sitting through months of drawdown, and getting shaken out before the thesis plays out.
Fundamental analysis identifies what to buy. Technical analysis addresses when. That distinction is especially costly in a high-valuation sector like technology, where price is acutely sensitive to shifts in global risk appetite and interest rate expectations.
“Fundamental analysis tells you what to buy. Technical analysis helps you decide when.”
The current macro environment sharpens this point. The MarketIndex ChartWatch series, authored by Carl Capolingua, has flagged a possible significant topping signal forming on the Nasdaq, a direct concern for globally exposed ASX tech names. Rate expectations remain uncertain. In this environment, charts often move before broker models and earnings estimates catch up. For investors considering a sector entry, the technical picture is the most useful tool available right now.
The framework below builds progressively. Each signal extends the logic of the one before it, so that by the fifth, investors hold a coherent diagnostic model rather than a disconnected checklist.
For investors wanting to apply the volume confirmation layer with precision, our dedicated guide to reading trading volume walks through the four core price-volume pairings with real 2026 examples, including the specific threshold of 1.5 to 2 times the 20-day average that separates valid breakouts from false starts.
The same five signals produce genuinely different readings across these four stocks, because each has its own technical personality.
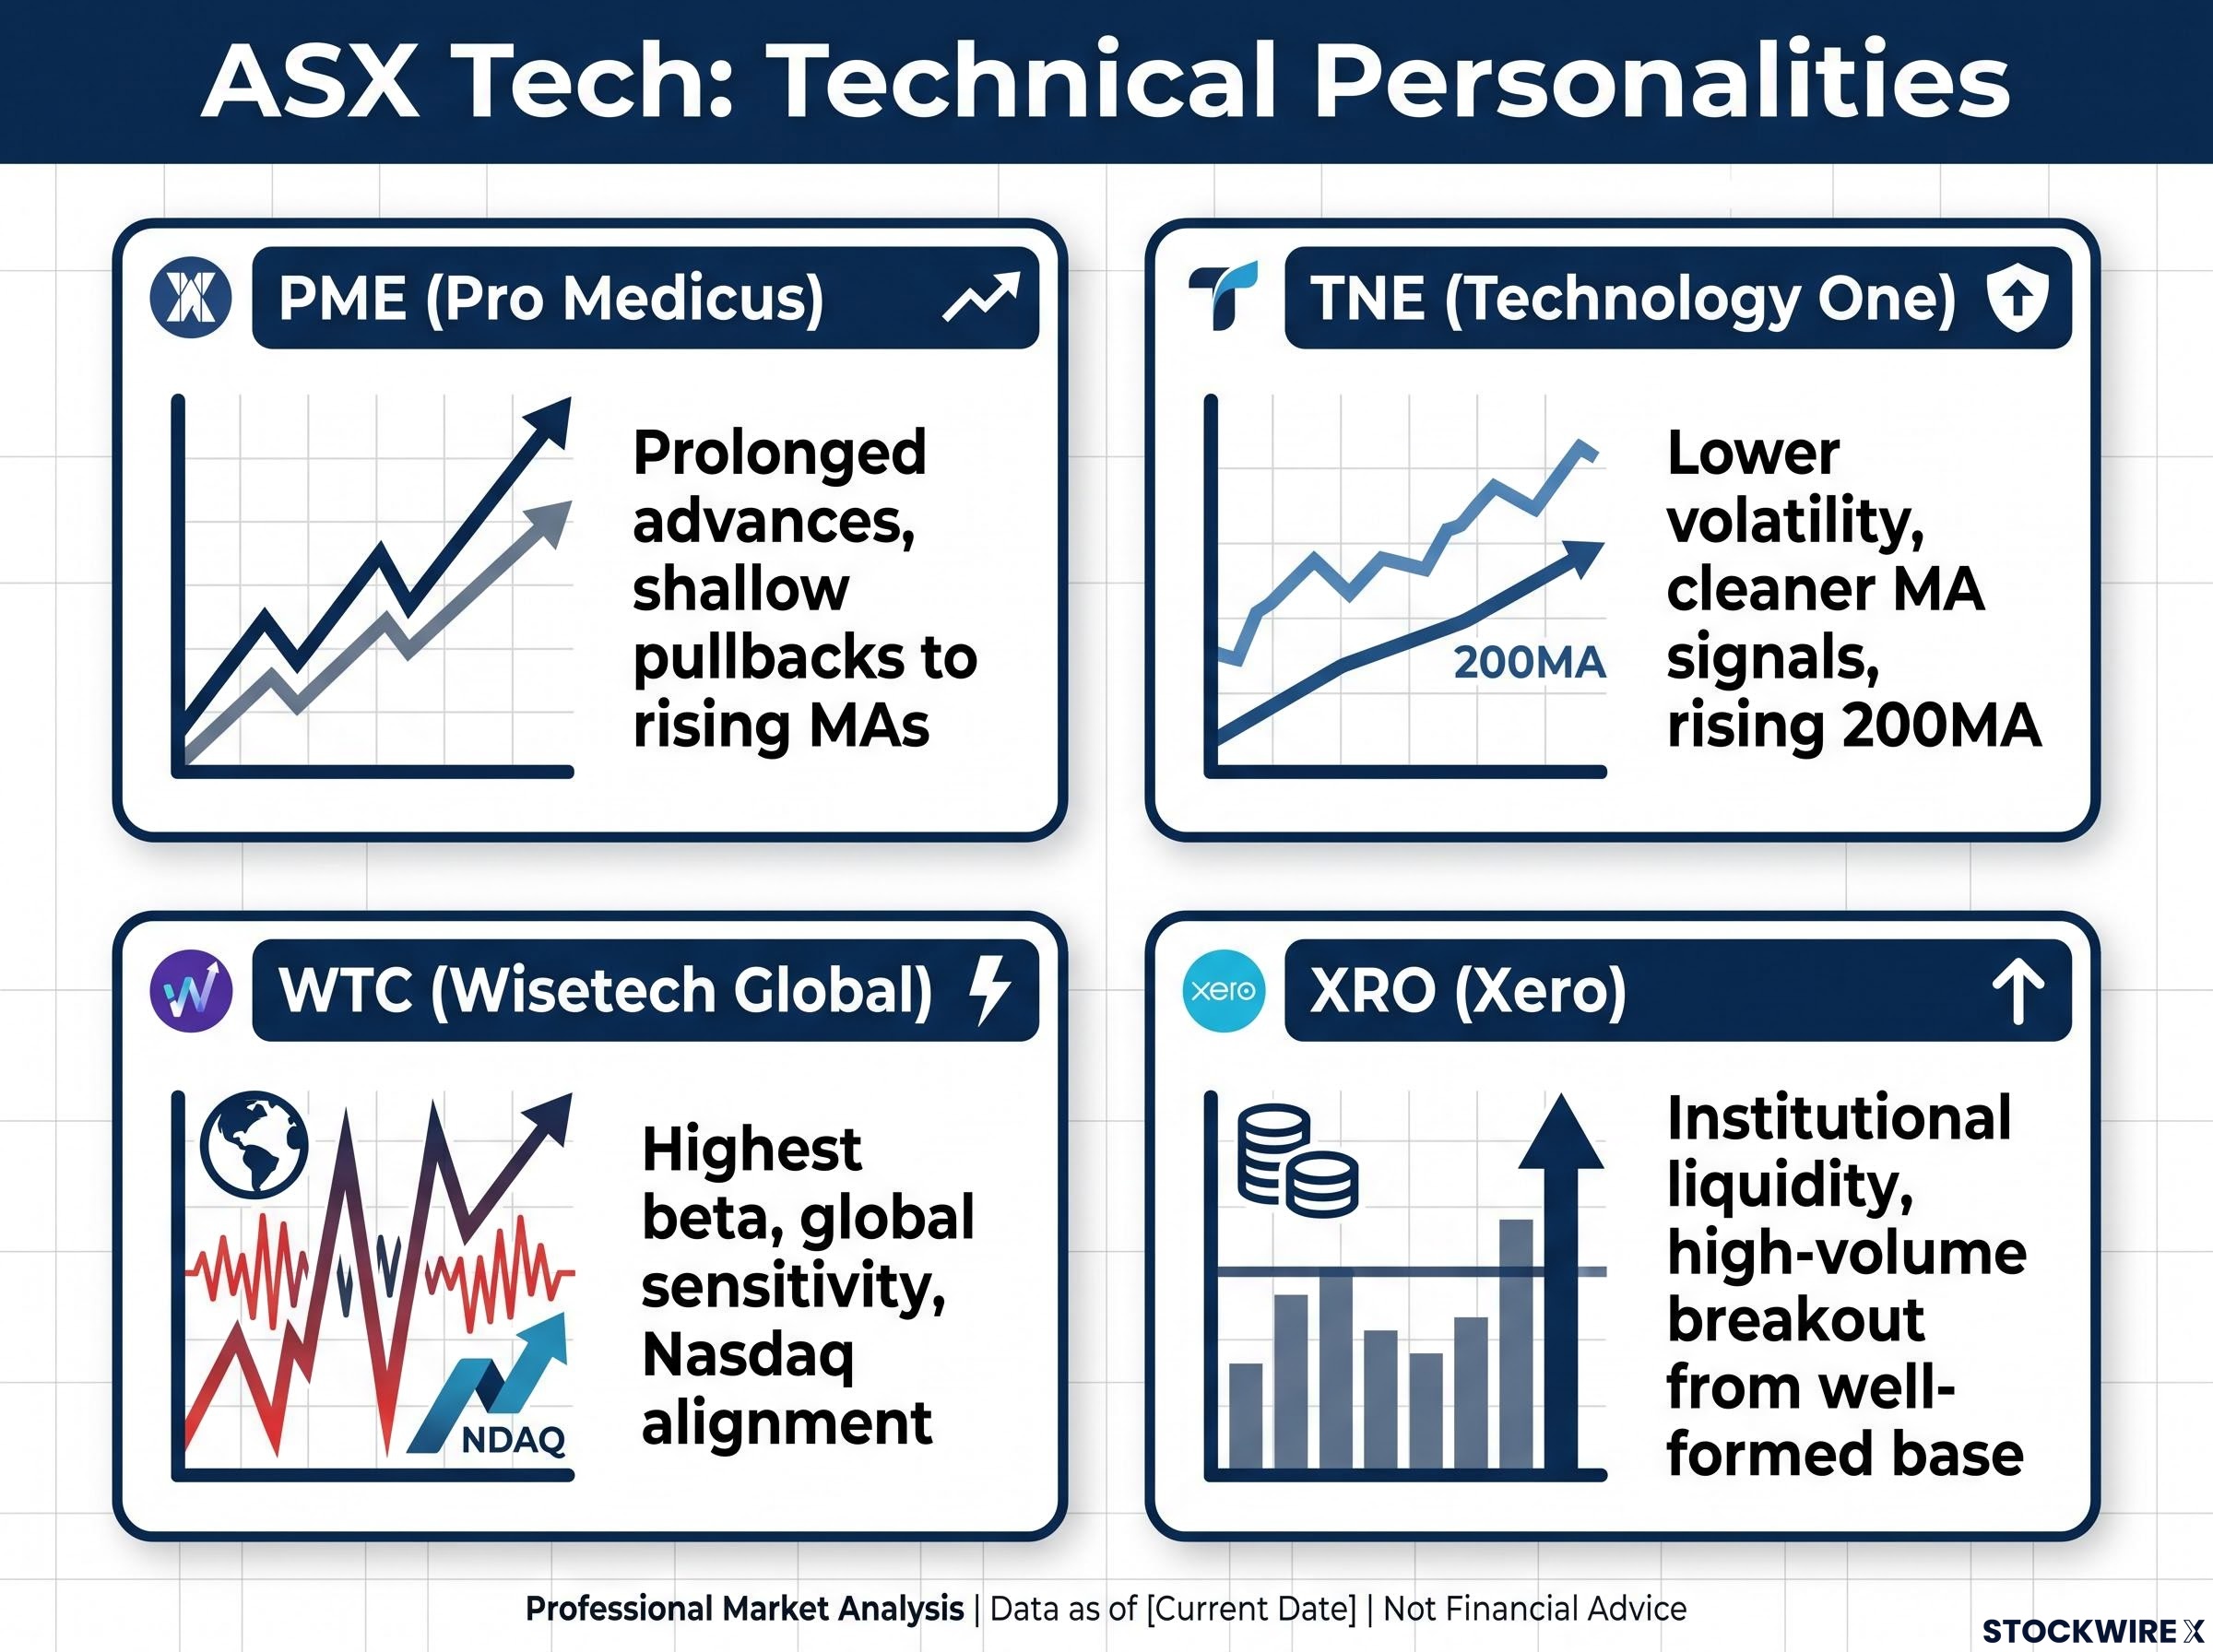
Pro Medicus (PME) has historically shown prolonged advances interrupted by shallow pullbacks that find support at rising moving averages. Volume tends to expand on breakouts. The question for investors now is whether recent weakness has maintained that constructive character, with pullbacks remaining shallow and on lighter volume, or whether it has broken the pattern with deeper declines on heavy selling.
Technology One (TNE) is the lower-volatility name in this group. Its relatively smoother price action makes moving average signals cleaner and less prone to whipsaws. For technically disciplined investors, the 200MA is the key structural line: as long as TNE trades above a rising 200MA, pullbacks toward that area can be viewed as potential opportunities rather than automatic red flags.
Wisetech Global (WTC) carries the highest beta. Its share price reflects both domestic sentiment and global risk appetite toward high-growth technology. That dual sensitivity makes it the fastest mover when risk appetite returns, but also the most exposed if global tech indices form tops or break down. Stock-level signals here must be read alongside index-level context, particularly given the Nasdaq topping signal concern flagged in the ChartWatch series.
Nasdaq tech positioning remained dangerously stretched even after the 4.18% single-session selloff on 5 June 2026, according to Citi’s analysis, because the majority of long positions were still profitable and could unwind rapidly on the next negative catalyst, a structural risk that sits directly behind the Nasdaq topping concern most relevant to WTC and XRO.
Xero (XRO) is best understood through the lens of base formation. As one of the most institutionally held names in Australian technology, its size and liquidity mean its chart tends to be technically clean, with fewer random price spikes and more respect for well-watched levels. A high-volume breakout from a well-formed base in a name with this institutional profile is among the more reliable technical entry signals available on the ASX.
| Stock | Technical personality | Primary signal to watch | Key risk factor |
|---|---|---|---|
| PME | Prolonged advances, shallow pullbacks to rising MAs | Volume and depth of current pullback | Deep decline on heavy volume would break pattern |
| TNE | Lower volatility, cleaner MA signals | Price relationship to rising 200MA | Decisive break below falling 200MA |
| WTC | Highest beta, global sensitivity | Stock-level setup aligned with Nasdaq direction | Global tech sentiment deterioration |
| XRO | Institutional liquidity, clean technical levels | High-volume breakout from well-formed base | Failed breakout or weak volume on rally |
Isolated breakouts in one or two names can be interesting. A coordinated shift across the sector is far more powerful.
The concept of confluence asks whether multiple stocks are confirming the same technical message at the same time. When several names form higher lows, reclaim moving averages, and show improving volume behaviour in the same window, the signal quality rises materially above any single-stock reading.
Institutional rotation into ASX tech accelerated sharply on 2 June 2026, when the ASX 200 Information Technology sub-index gained 4.71% in a single session and Pro Medicus, WiseTech Global, and Xero all recorded substantial single-day advances, providing a live example of the kind of coordinated sector-wide signal the confluence framework is designed to identify.
Investors assessing whether sector-wide signals are aligning should ask:
“One or two isolated breakouts can be interesting. A cluster of aligned bullish signals across the sector is far more powerful.”
The Nasdaq overlay remains the most important macro variable. Even a technically compelling ASX tech setup can stall if global growth-stock sentiment deteriorates, and this risk is especially acute for WTC and XRO given their offshore revenue profiles and institutional ownership. The broader ASX tech universe, including names like Life360, Megaport, Audinate, and Computershare, along with ETF options such as the Global X Semiconductor ETF, Global X AI Infrastructure ETF, and BetaShares Cybersecurity ETF, offers alternative ways to express a sector-level view without single-stock concentration risk.
Identifying a potential turning point is only half the job. Translating it into a disciplined entry and risk plan is what separates analysis from action.
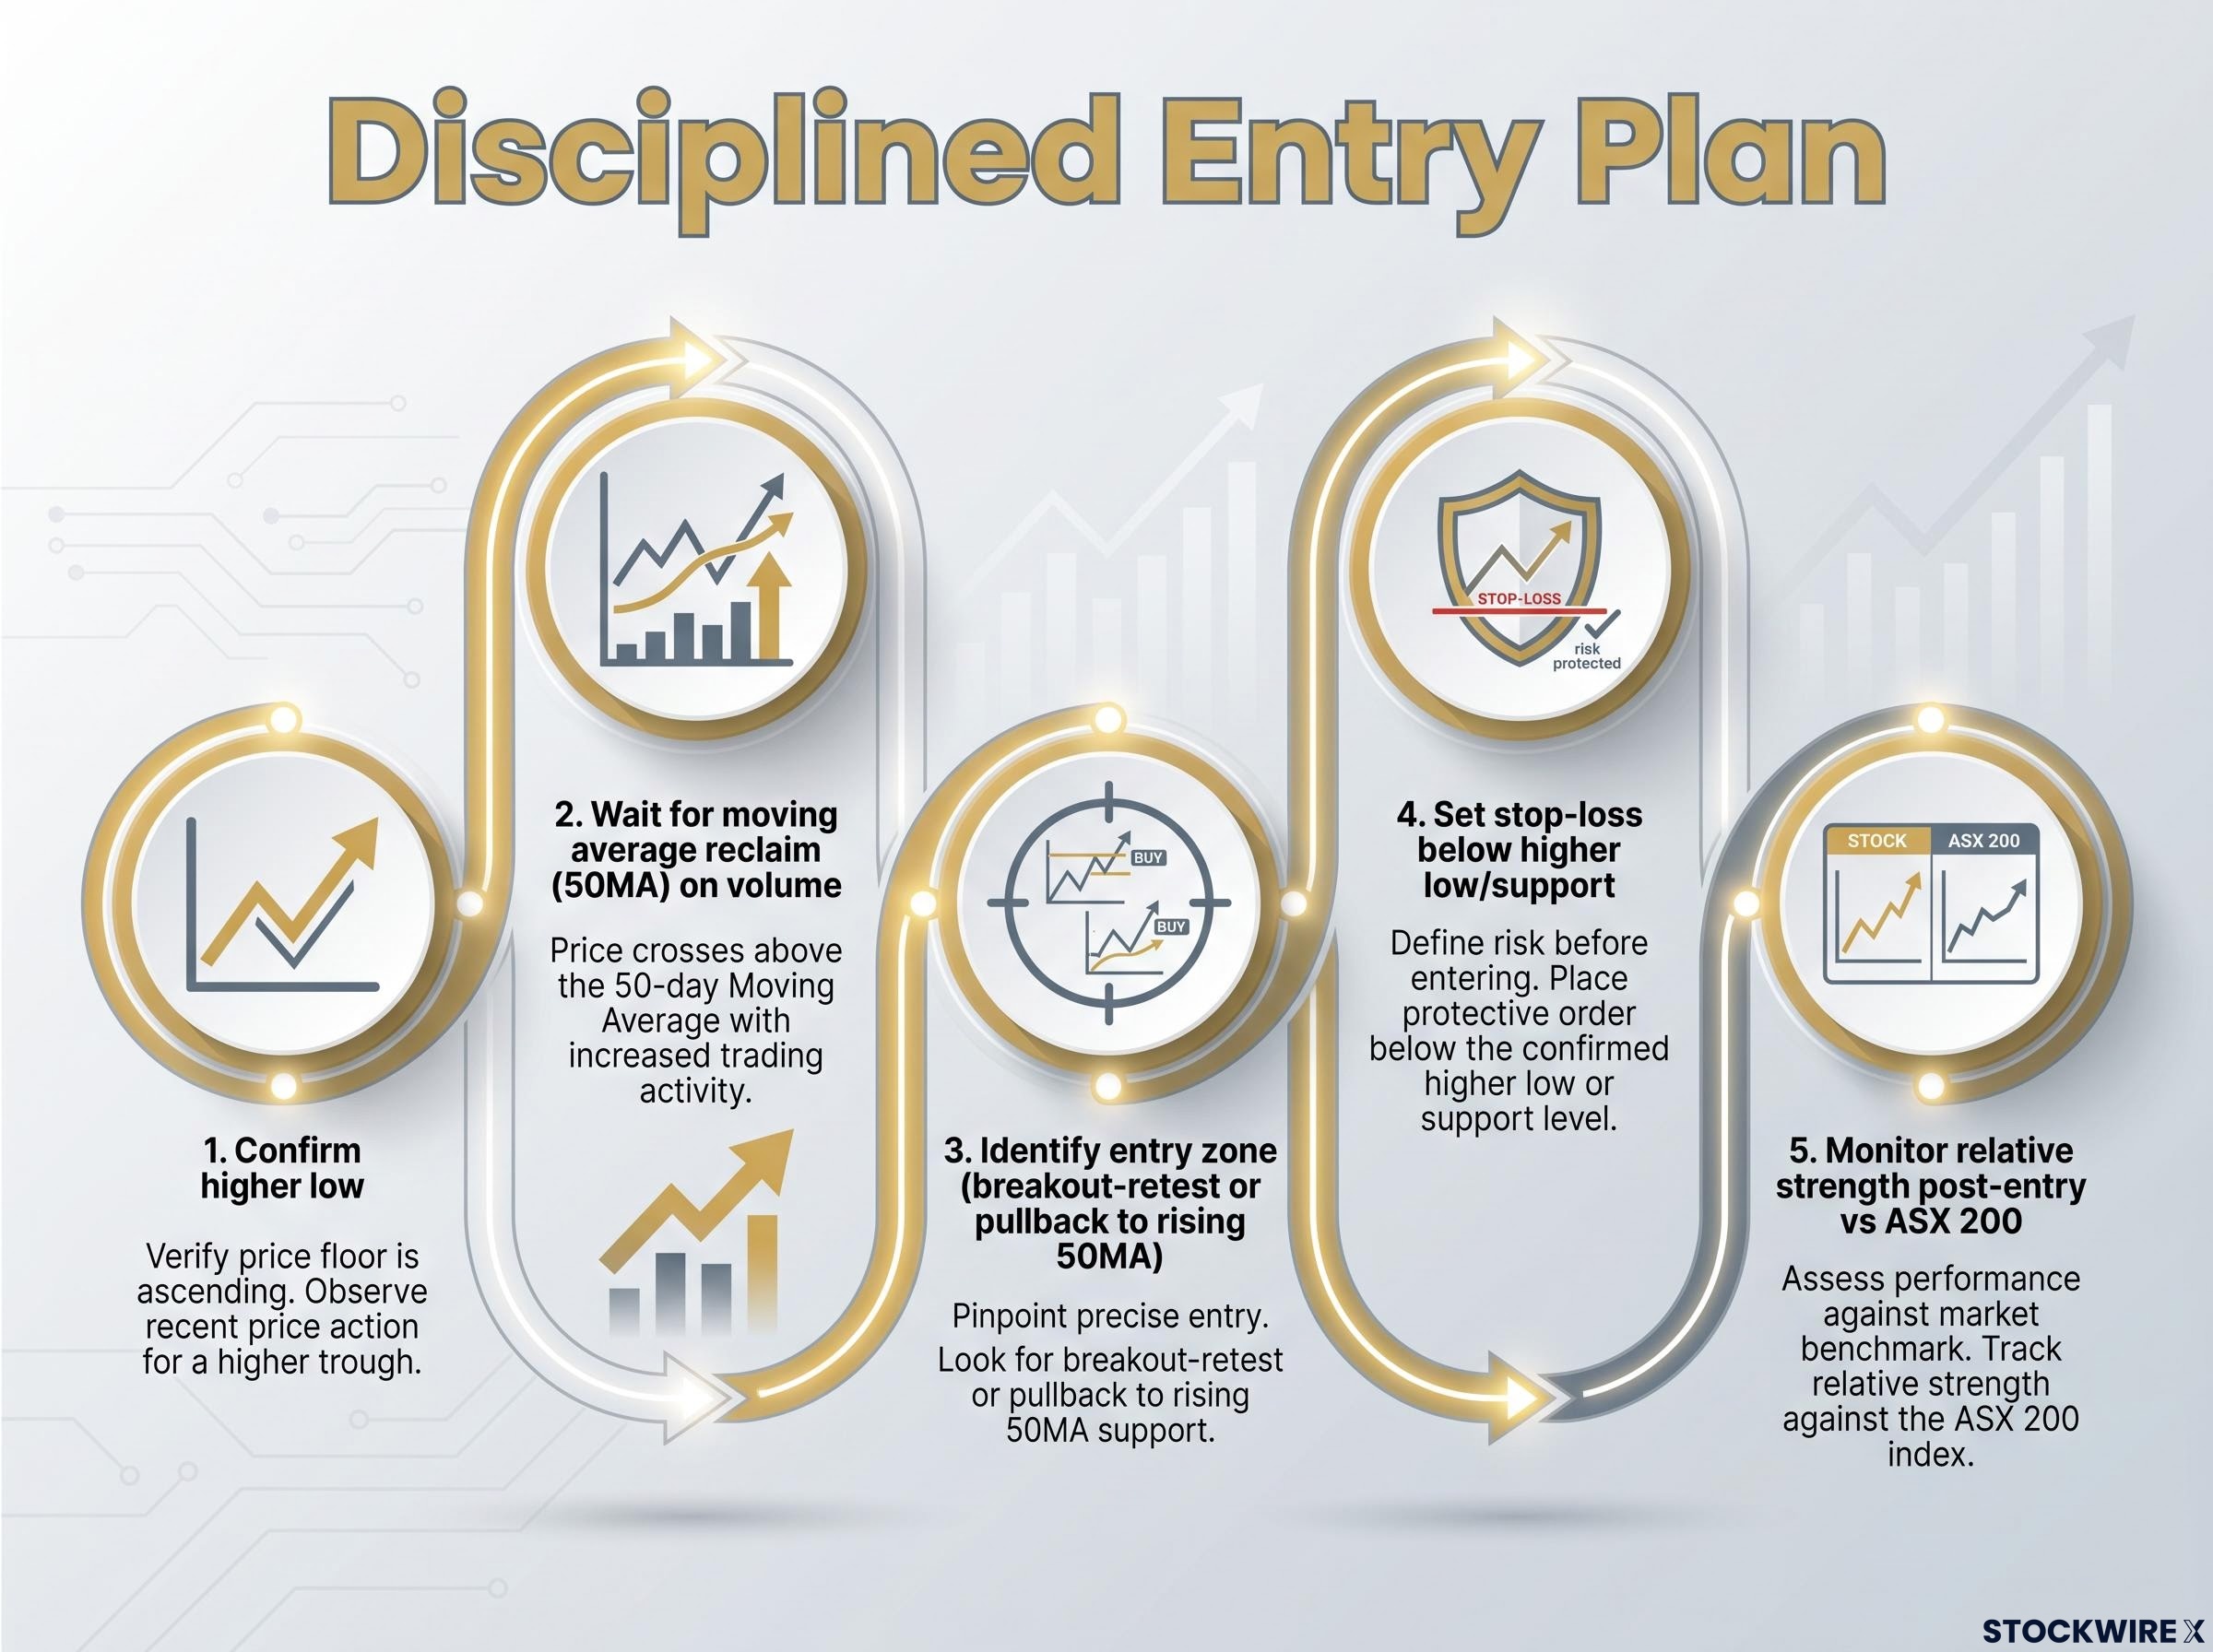
A technically sound setup does not guarantee a profitable outcome. What it provides is a defined, reproducible decision process that removes emotion from the entry and exit.
ASX tech names are showing technical characteristics that warrant close attention. Higher lows are forming, moving averages are flattening or curling, and volume patterns across several names carry the hallmarks of accumulation rather than distribution.
Whether those signals translate into sustained advances depends on the macro environment. The two conditions to keep watching are the Nasdaq’s trajectory, particularly in light of the possible topping signal flagged in the ChartWatch series authored by Carl Capolingua on MarketIndex, and the domestic rate expectations outlook. A deterioration in either could stall technically promising setups regardless of stock-level strength.
CTA unwind mechanics introduce a complication for technically constructed entries in globally exposed names: the mechanical deleveraging that follows systematic trigger levels can produce sharp, headline-disproportionate moves that are unrelated to company fundamentals, meaning a technically valid setup in WTC or XRO can be overwhelmed by index-level selling pressure in the hours after a Nasdaq threshold breach.
The framework described in this article is not a one-time check. The signals need to be monitored as conditions evolve, not locked in as a static view formed on a single reading. Investors who treat technical analysis as an ongoing discipline, rather than a once-off tip, are better positioned to act when confluence genuinely arrives.
“The signals are there. Whether the macro lets them run is the open question every ASX tech investor should be tracking.”
This article is for informational purposes only and should not be considered financial advice. Past performance does not guarantee future results. Investors should conduct their own research and consult with a licensed financial adviser before making investment decisions.
A Golden Cross occurs when the 50-day moving average crosses above the 200-day moving average, signalling that medium-term momentum has overtaken long-term weakness. For ASX tech stocks, this pattern reflects a meaningful shift in trend character and is one of the five key signals used to assess potential sector entry points.
The pattern to look for is expanding volume on price rallies and contracting volume on pullbacks. Heavy buying on advances combined with light selling on retreats indicates genuine accumulation rather than a fragile short-covering bounce, with a volume threshold of 1.5 to 2 times the 20-day average used to separate valid breakouts from false starts.
The breakout-retest pattern occurs when price breaks above a well-defined resistance level and then pulls back to test that level as new support. This creates a disciplined entry zone, with a logical stop-loss placed just below the former resistance, making it one of the most reliable technical entry setups available on the ASX.
Wisetech Global and Xero are sensitive to global risk appetite because of their offshore revenue profiles and institutional ownership, meaning a deterioration in Nasdaq sentiment can stall technically promising ASX setups regardless of stock-level strength. A possible topping signal on the Nasdaq is identified in the article as the single most important macro variable to monitor for these names.
Confluence refers to multiple ASX tech stocks confirming the same technical message at the same time, such as several names simultaneously forming higher lows, reclaiming moving averages, and showing improving volume behaviour. When this coordination occurs across the sector, the signal quality rises materially above any single-stock reading.