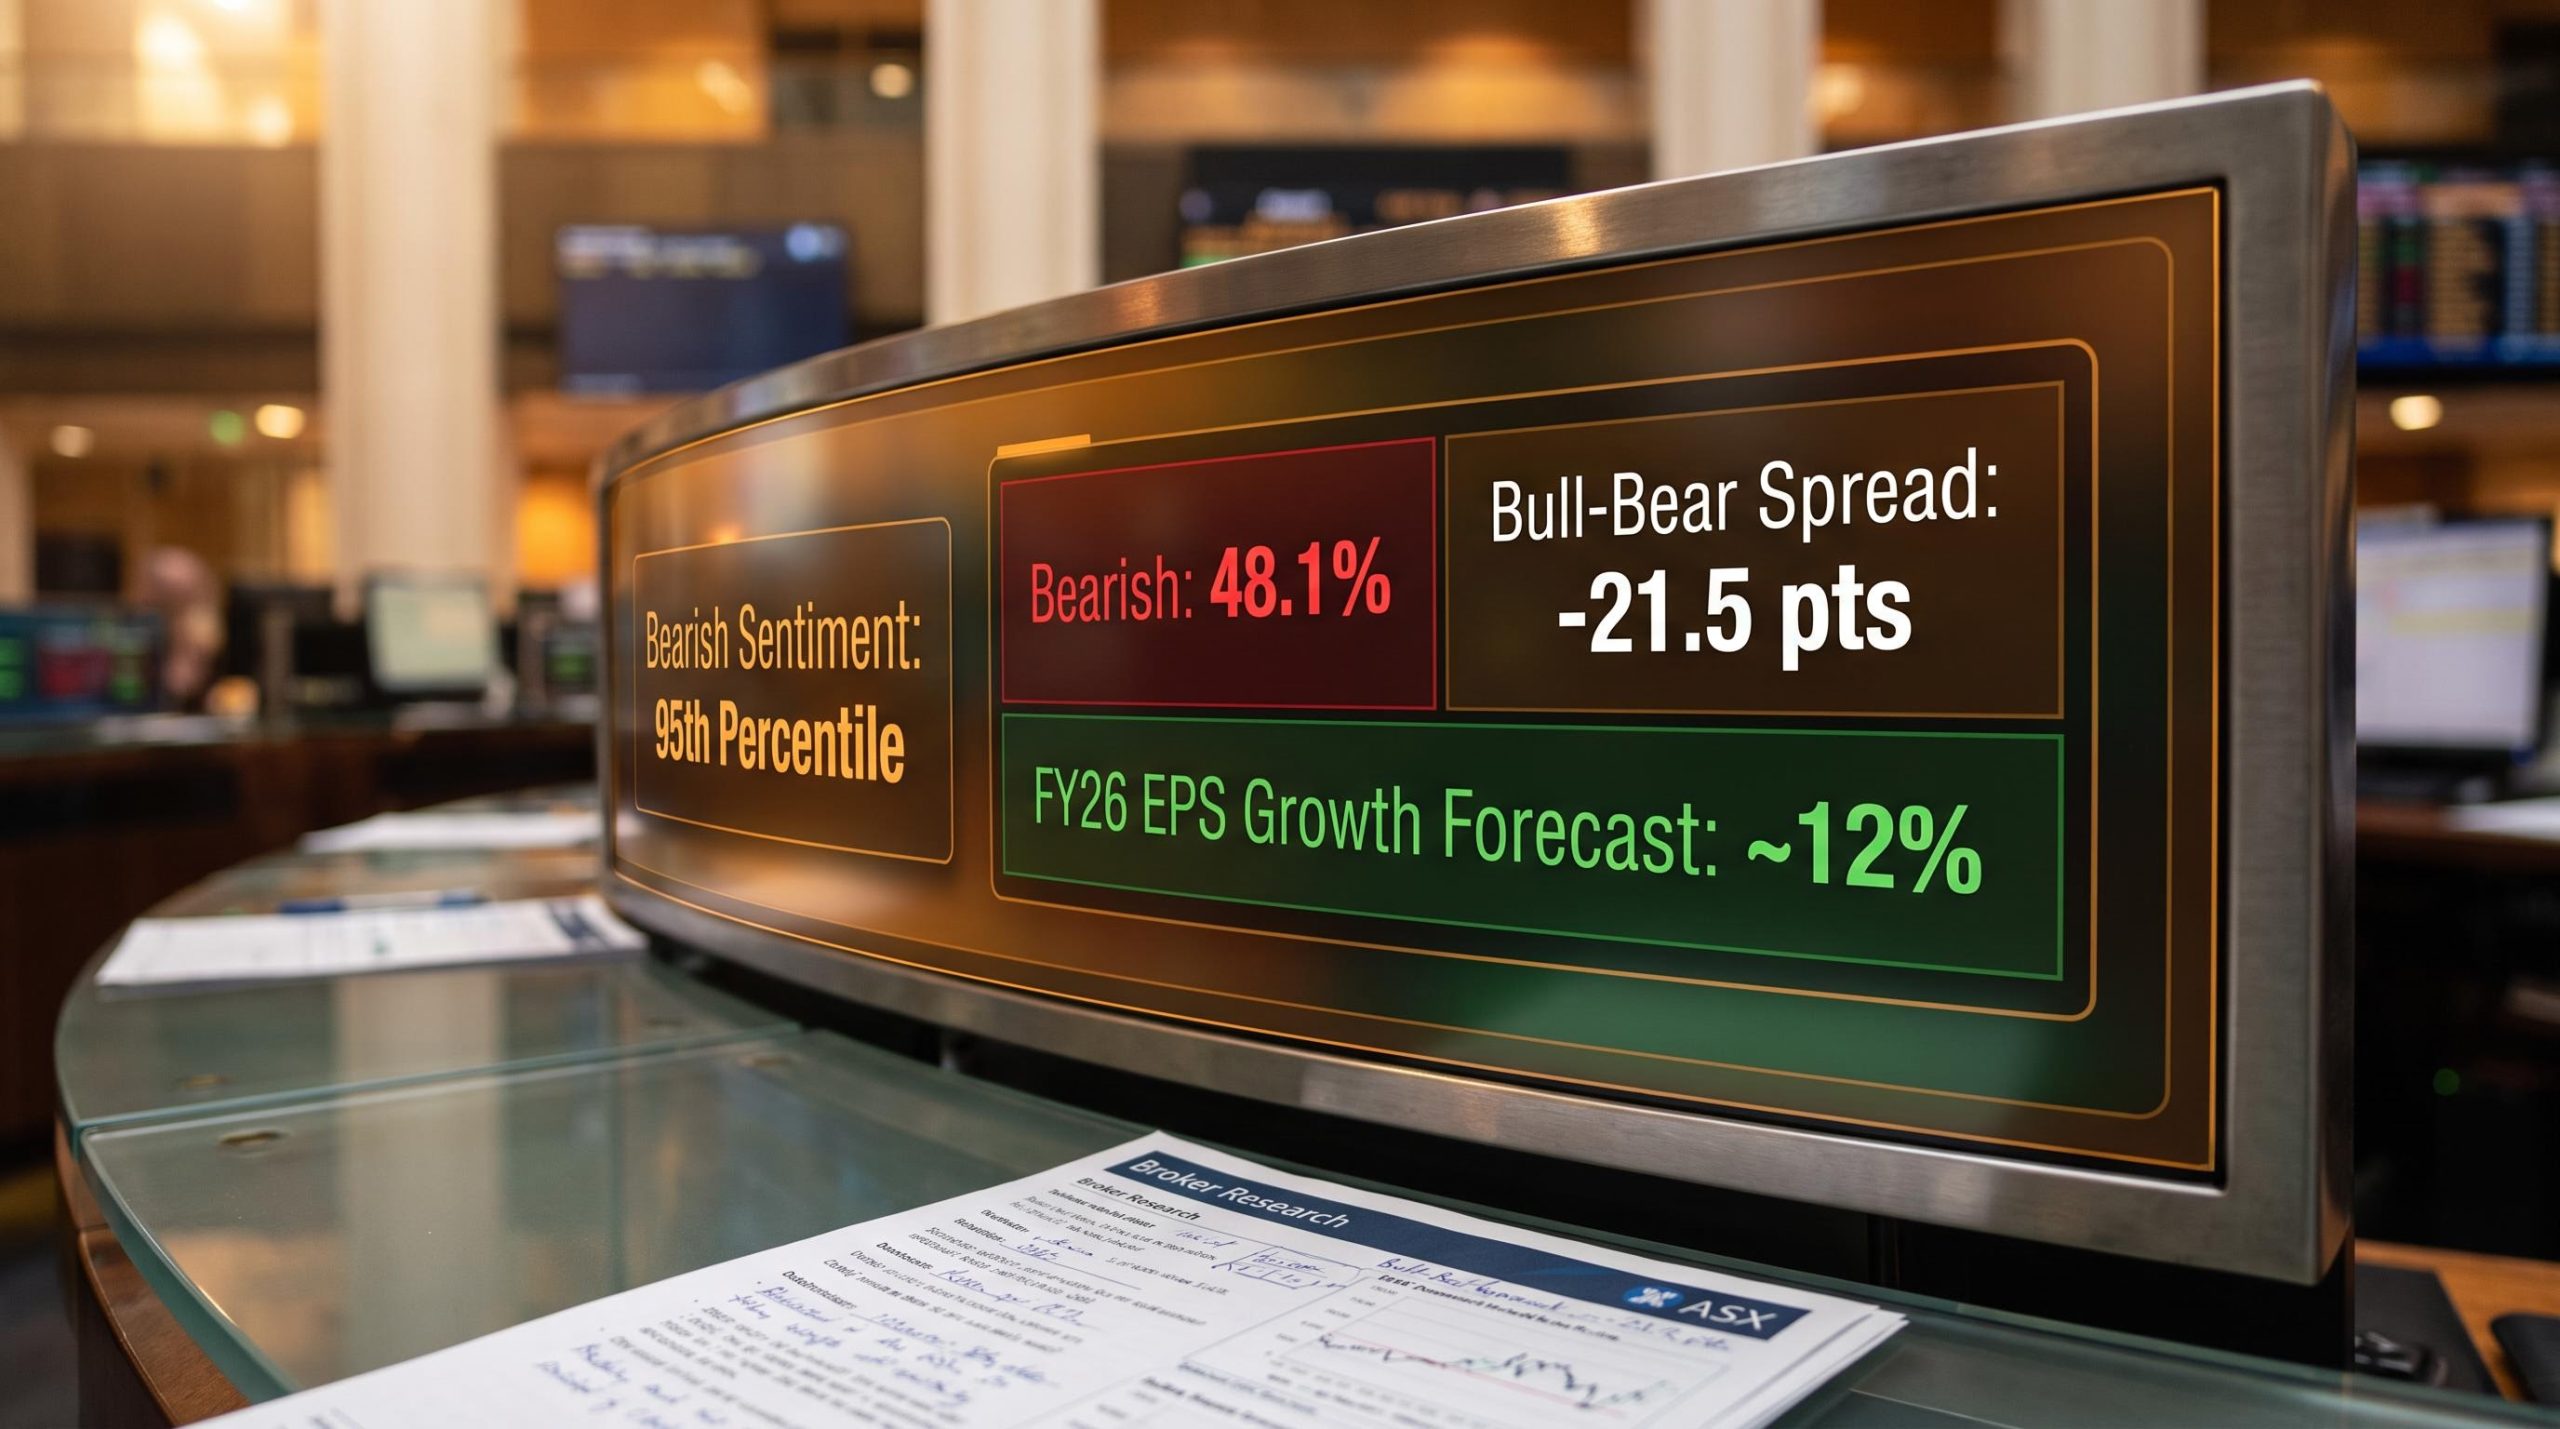
Analysts are forecasting the strongest aggregate earnings growth on the S&P/ASX 200 in roughly four years. At the same time, investor sentiment has collapsed to its most bearish reading in over a year, sitting at the 95th percentile of all survey observations since inception. Those two facts should not coexist, yet here they are, weeks before the bulk of August 2026 results hit the market.
The reporting window runs from 10 to 28 August, covering large caps across resources, banks, retail, healthcare and technology. This is also when the majority of final dividend declarations land, making it the single most information-rich stretch of the calendar for Australian equity investors. It is not a season to watch passively.
The ASX reporting calendar for August 2026 covers more than 250 companies releasing FY26 results, with broker consensus NPAT, EPS and DPS figures available for 78 major names, including CBA on 12 August and BHP alongside CSL in the same 24-hour window on 18 August.
Here is the framework for reading what actually matters: what the sentiment extreme historically signals, which metrics drive the biggest post-result price moves, where the sector-level risk is concentrated, and five decisions that separate prepared investors from reactive ones.
The gap between what analysts expect and what investors fear
The headline number looks constructive. Full-year S&P/ASX 200 earnings are projected to grow by around 12% year-on-year in FY26, which would represent the best collective result the index has produced in close to four years. Strip away the optimism and the starting valuation tells a different story: the index is priced at a forward price-to-earnings multiple of around 19x, a figure that sits above long-run historical norms and provides a narrow buffer against any shortfall.
Now set that against how investors are actually positioned. The Market Index weekly sentiment survey shows:
- The proportion of bearish respondents climbed from 30.0% to 48.1% within a single week
- The bull-bear spread deteriorated from positive 5.8 percentage points to negative 21.5 percentage points
- Neutral respondents contracted to 25.4%, the lowest share recorded since early June
- The bearish reading sits at the 95th percentile of all survey readings since inception
- This marks a third consecutive weekly deterioration, making it a trend, not a spike
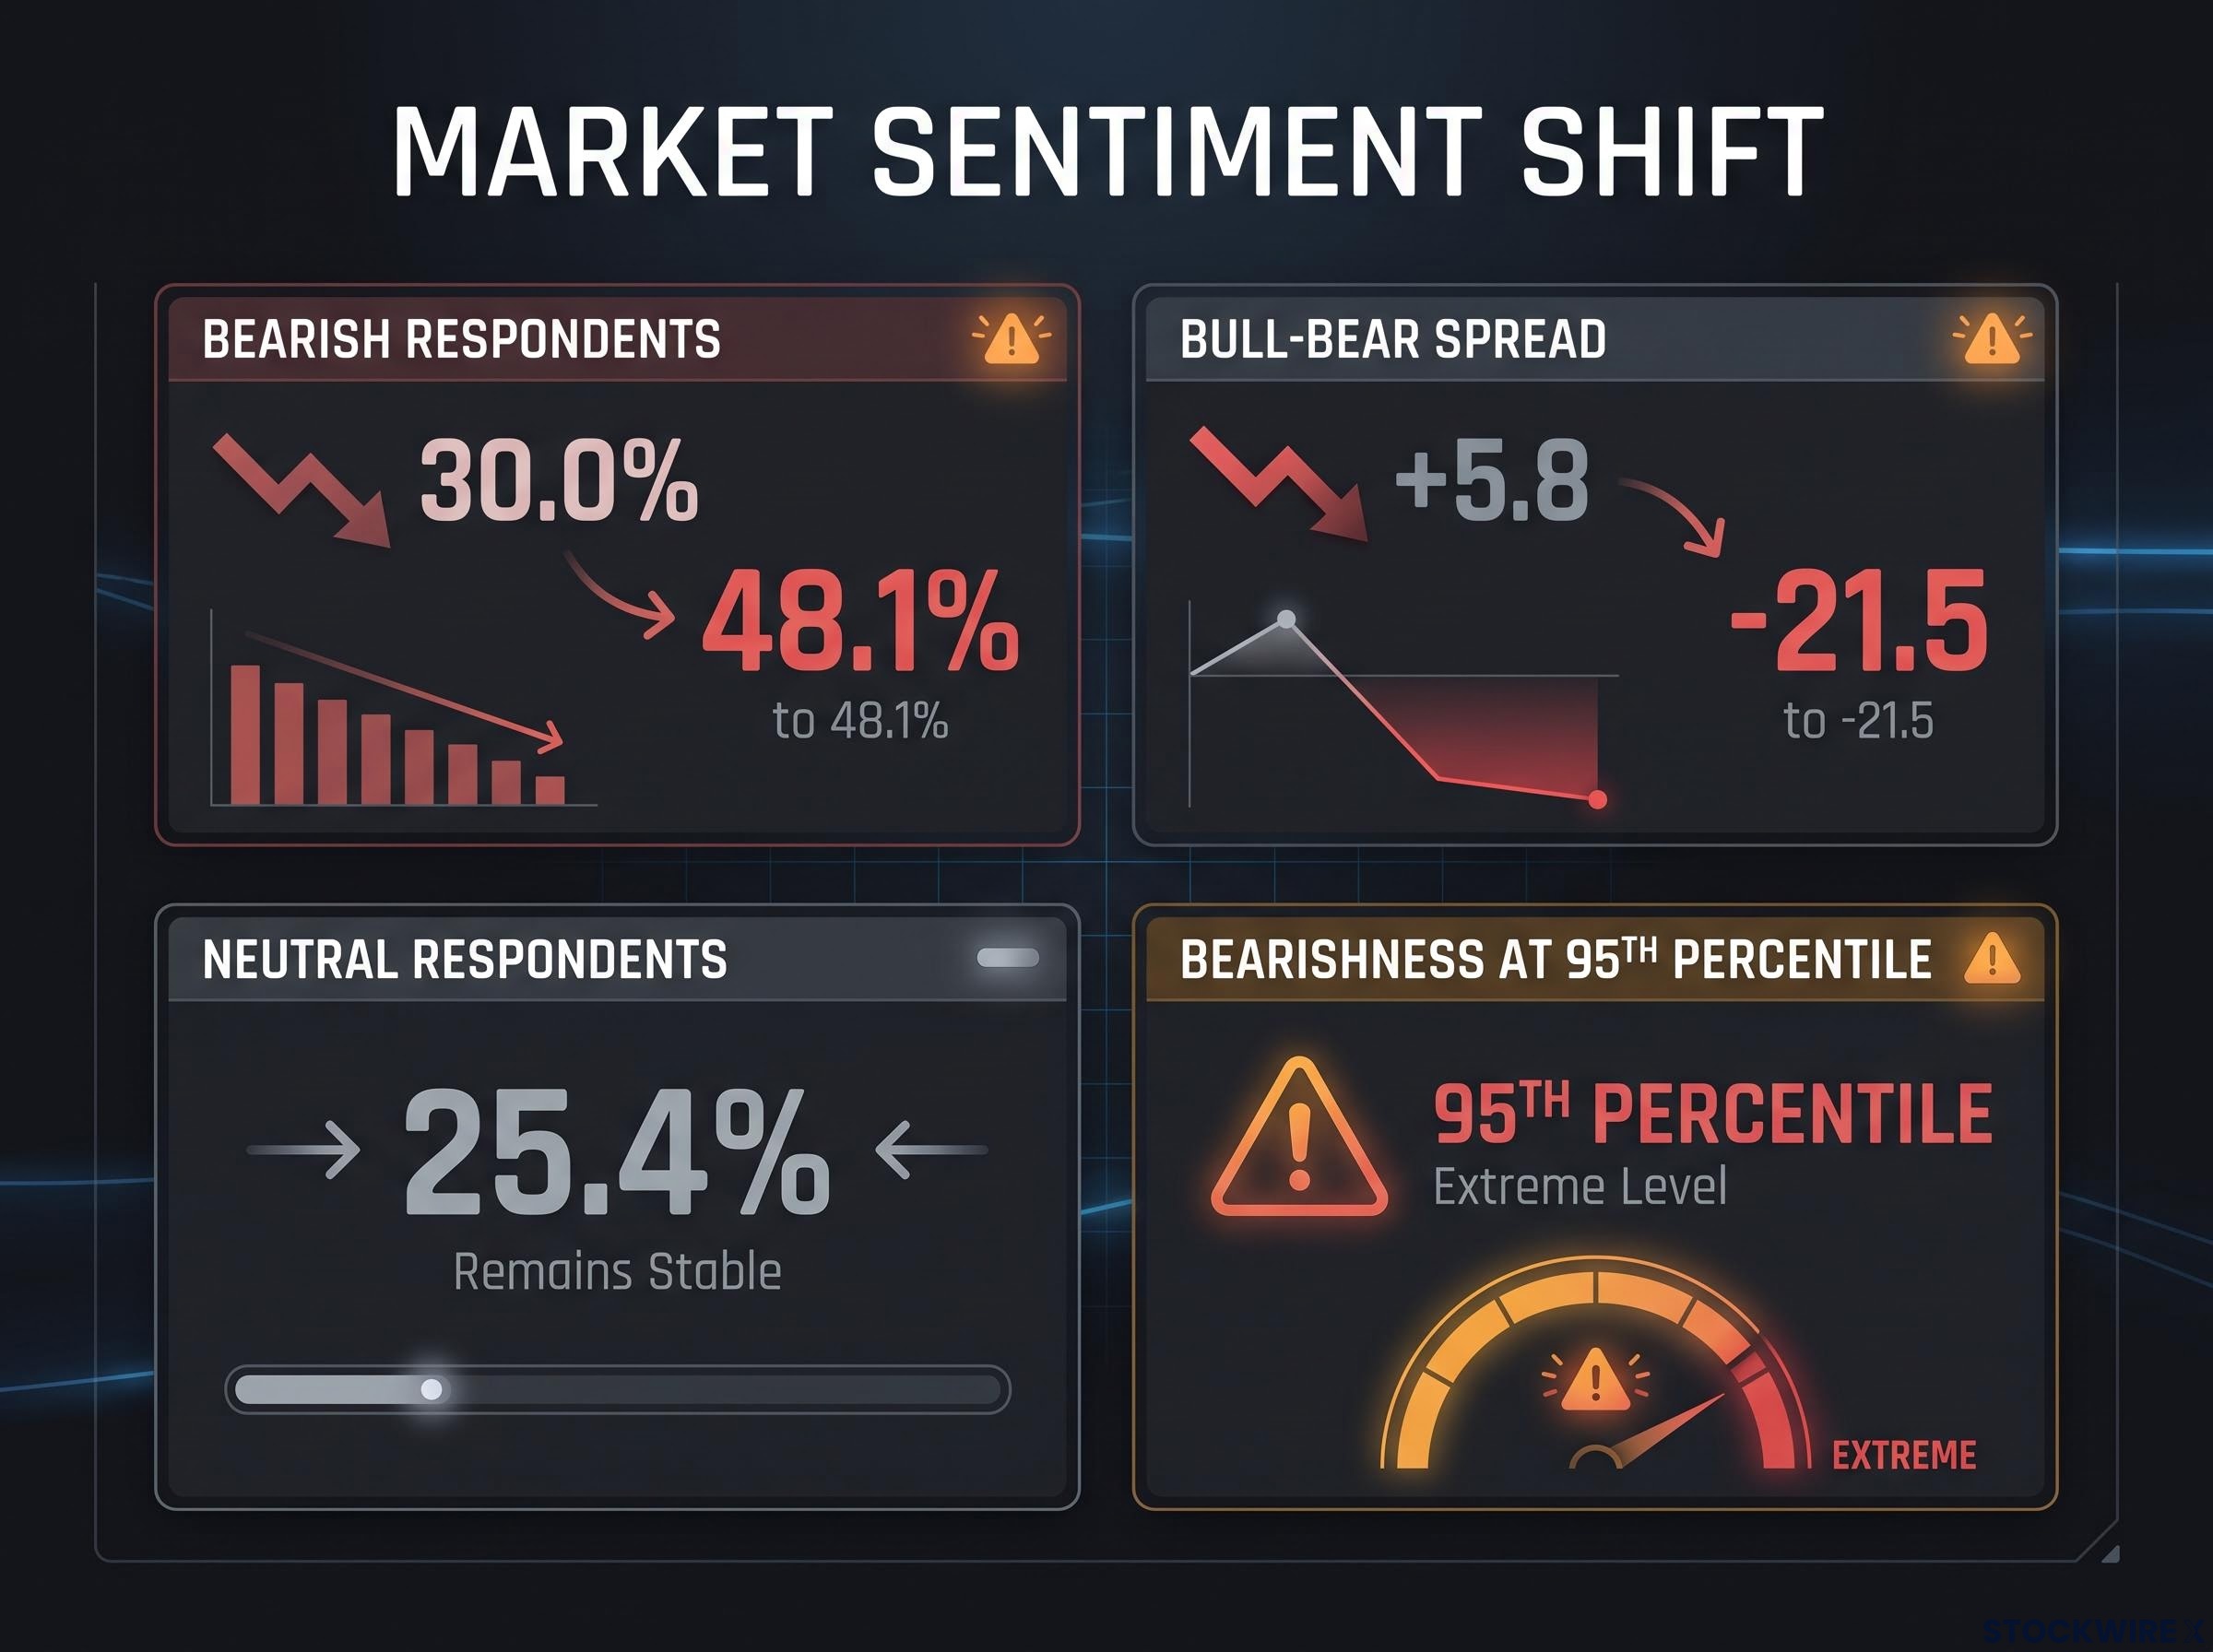
In the space of a single week, the bull-bear spread swung from positive 5.8 percentage points to negative 21.5 percentage points, a shift that places it at the 8th percentile of all historical observations.
When both the bulls and the neutrals are simultaneously contracting and bearishness is at a multi-year extreme heading into a season with the strongest earnings forecast in four years, investors are not simply cautious. They are priced for disappointment in a way that changes the risk-reward calculation on both sides.
When big ASX news breaks, our subscribers know first
Why sentiment collapsed heading into August
The fear is not anchored to a single cause. It is the accumulation of several pressures arriving at the same time, some company-specific and some macro noise, but all feeding into the same defensive positioning.
Three cost headwinds are already embedded in FY26 results. Persistent inflation and minimum wage increases have pushed labour costs higher across most sectors. Elevated energy and oil prices are squeezing margin-sensitive businesses in transport, industrials and consumer-facing categories. And consumer confidence remains subdued, weighing on discretionary spending, hospitality and non-essential services. These pressures will surface across results season in margin compression, slower volume growth and more cautious guidance.
The RBA Statement on Monetary Policy outlook for May 2026 forecast headline inflation peaking at 4.8% in the June quarter, driven by higher fuel and raw material costs alongside persistent wages growth, confirming the operating environment that will be reflected in FY26 corporate margin results across energy-sensitive and labour-intensive sectors.
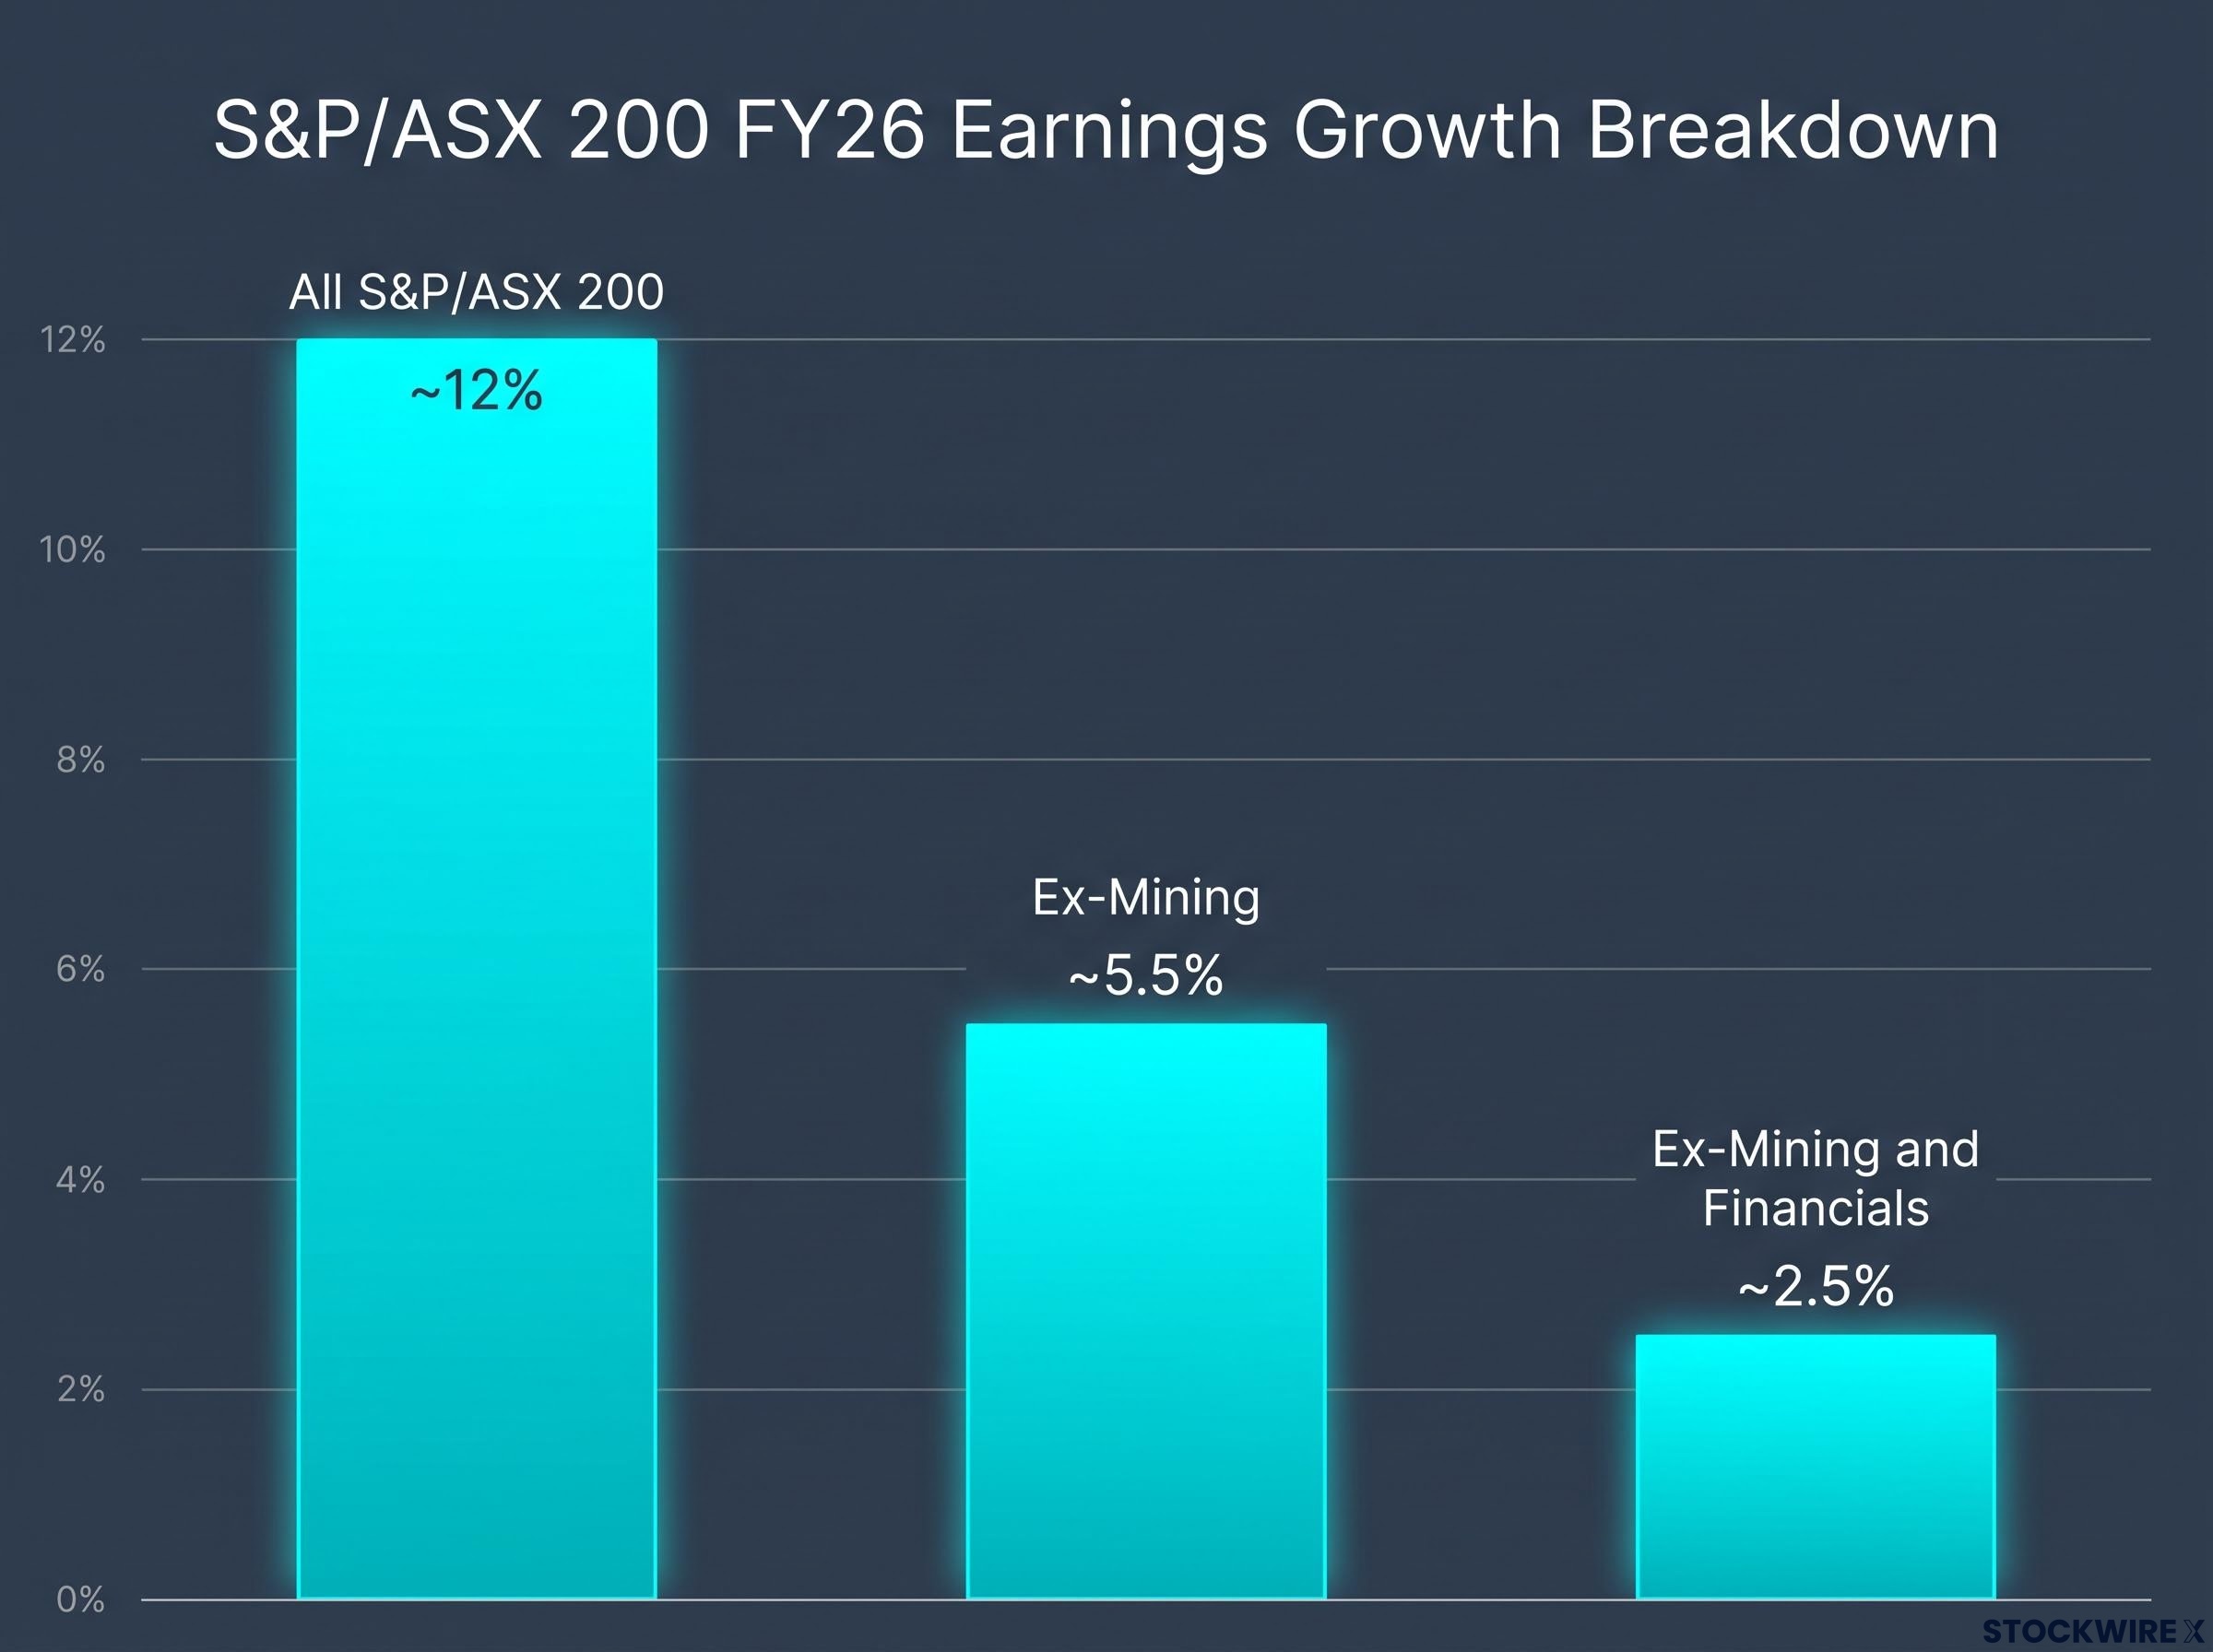
The disaggregation of that 12% headline growth figure is where the picture changes most sharply. UBS estimates that removing Mining from the calculation pulls forecast growth down to around 5.5%. Excluding both Mining and Financials narrows that figure further, to approximately 2.5%.
| Earnings growth scope | Forecast growth rate |
|---|---|
| All S&P/ASX 200 | ~12% |
| Ex-Mining | ~5.5% |
| Ex-Mining and Financials | ~2.5% |
If your portfolio is underweight resources and financials relative to the index, the earnings backdrop you are actually facing is closer to 2.5% growth than 12%. That reframes the valuation question entirely.
Policy uncertainty adding a new layer of risk premia
The proposed Labor capital gains tax adjustments have introduced a distinct source of unease that sits outside normal earnings-season mechanics. The proposal would replace the 50% CGT discount with an inflation-based indexation method and introduce a minimum 30% tax rate on capital gains, effective from 1 July 2027.
Even without confirmed legislation, uncertainty itself tends to increase risk premia and reduce investors’ willingness to look through near-term issues. Some asset allocators are reportedly considering reducing Australian equity exposure until the legislative path becomes clearer.
For investors wanting to model the specific tax scenarios before the 2027 deadline, our full explainer on the CGT changes covers the dual-calculation grandfathering rules, the CPI indexation methodology, and the practical steps for verifying cost bases on existing holdings.
What extreme bearish sentiment historically signals
At the 95th percentile, defensiveness is crowded. Fear is now the consensus, not the contrarian view. That distinction matters for how you calibrate your expectations heading into August.
Within sentiment surveys of this type, pronounced bearish readings at historical extremes have tended to see partial reversals emerge within a fortnight, as the available pool of sellers narrows and any positive surprise compels defensive positioning to unwind. The contrarian logic is real, but it comes with clear limits: sentiment extremes are not timing tools, and some companies will absolutely confirm the bearish fears during this season.
The practical value of the reading lies in calibration, not direction. Three implications follow from the current 95th percentile reading:
- Defensiveness is crowded: the market may be over-pricing downside scenarios, particularly for companies where fears are driven by macro narrative rather than company-specific deterioration
- Positive surprises carry a larger payoff: genuine beats will generate bigger-than-normal price reactions precisely because so few participants are positioned for them
- Consensus fear is not the contrarian view: anchoring too closely to the prevailing bearish mood is now the crowded trade, not the independent one
Fear is now the consensus, not the contrarian view. The upside asymmetry on a clean beat is higher in this environment than it would be when sentiment is neutral or optimistic.
For investors, the implication is specific: the asymmetry favours positive surprises more than usual. That does not mean buying indiscriminately, but it does mean the reward for identifying companies priced for pessimism that can deliver a clean result is meaningfully elevated.
Assessing results: the metrics that move markets
Research consistently shows that two-day post-result price moves across ASX reporting seasons are driven by a small cluster of core metrics. Treating these as active decision variables, rather than a passive checklist, is what distinguishes disciplined analysis from reactive noise.
- Margins: In a cost-pressured environment, gross, operating and net margin trajectory will be scrutinised as closely as revenue growth. A company delivering modest revenue growth but improving margins is often rewarded more generously than one with stronger topline but deteriorating profitability. The question is whether management is demonstrating cost discipline or simply passing on price increases.
- Net profit after tax (NPAT): This is the anchor metric for consensus forecasts and the initial price reaction. The distinction between statutory and underlying NPAT, where underlying strips out one-off items, is worth checking before reacting to a headline beat or miss. Tax and accounting effects can distort the number significantly.
- Dividends: With August being the primary final dividend declaration window and many portfolios rotating toward income, payout decisions carry outsized weight. Dividend cuts or unexpectedly low payout ratios trigger selling even when earnings are in line. Maintaining or modestly raising dividends in a tough environment signals cash generation confidence and can stabilise valuations.
- Forward guidance: For many names, FY27 guidance and outlook commentary will matter more than the FY26 print. The market rewards conservative but clear, quantified guidance with credible explanations of how macro headwinds are being managed. It punishes withdrawn, vague, or wide-range guidance with little detail on underlying assumptions.
Results that score cleanly across all four dimensions simultaneously tend to produce the sharpest two-day moves in either direction. When only a single variable surprises, sustained price momentum is rare. A comprehensive sweep across all four is what tends to generate it.
The Aurizon case study: what a clean beat looks like in practice
The February 2026 reporting season offered a striking illustration when Aurizon produced a result that satisfied all four criteria at once. On 16 February, the stock opened 3.0% higher and extended those gains through the session to close up 6.9%. Over the nine positive sessions that followed out of the next ten, the cumulative price advance reached 10.6%.
Aurizon posted a cumulative return of 10.6% over ten sessions after its February 2026 result, with the strength attributable to simultaneous delivery on margins, NPAT, dividends and guidance.
The case illustrates that clean beats across all four metrics compound into sustained momentum, not just a one-day spike. Investors who waited for the initial reaction and then assessed guidance quality could still have captured a meaningful portion of the follow-through move.
Where the sector risk and opportunity is concentrated
Owning the index does not mean owning the 12% earnings growth story. The growth is narrowly sourced, and positions in consumer, healthcare and technology names are being evaluated against a much tougher fundamental backdrop with a thinner margin for error.
The sector divergence that produced a 22-percentage-point spread between the best and worst ASX 200 sectors in June 2026 already flagged that owning the index and owning the earnings growth story are two distinct propositions, a gap that becomes even more consequential as August results arrive.
| Sector | Key earnings driver or risk | Market focus for August 2026 |
|---|---|---|
| Mining | Commodity prices, China demand sensitivity | BHP, Rio Tinto, Fortescue results as index-level signals |
| Financials | Net interest margin normalisation, credit quality | Dividend sustainability for income portfolios |
| Consumer-facing | Wages, input costs, weak consumer confidence | Pricing power evidence, inventory discipline |
| Healthcare and Technology | Premium multiples with minimal margin for error | Guidance quality; small downgrades trigger sharp multiple compression |
Mining is the index-level earnings engine, but its results are heavily commodity- and China-sensitive and may not reflect broader corporate health. Financials form the second pillar, where the focus sits on net interest margin normalisation, early credit quality signals and dividend sustainability for income-oriented investors.
Consumer-facing businesses, including retail, hospitality and discretionary services, are most exposed to all three macro headwinds simultaneously. The market will specifically watch for evidence of pricing power and inventory discipline.
Healthcare and technology names trade on premium multiples where the asymmetry is sharpest: strong beats can trigger re-ratings while even modest guidance downgrades cause multiple compression. Companies regularly flagged in broker commentary include:
- Pro Medicus
- Cochlear
- CSL
- Wisetech
- NEXTDC
Recent August reporting seasons have produced single-day falls of 10% or more for a range of stocks, including Zip, Data#3, Austal, Lovisa, Megaport, AMP and Nick Scali, where results or guidance came in below expectations.
Five decisions that will define how investors navigate August 2026
The analysis above converts into five specific decisions investors can apply before each result announcement during August.
Reporting season is when the behavioural traps most common among Australian retail investors, including emotional attachment to winning positions and misapplied buy-and-hold logic in cyclical sectors, tend to generate the most costly decision errors precisely because results arrive in rapid sequence.
- Prioritise guidance quality over headline beats. A small EPS miss paired with strong, quantified guidance is often more valuable than a beat paired with vague outlook language. Ask whether management provided credible, quantified assumptions for FY27.
- Track margin trajectory explicitly. Watch for wage, input cost and pricing commentary in each result. Improving margins in a tough environment are rewarded more than topline growth with deteriorating profitability.
- Stress-test balance sheets. Favour companies with strong cash generation, manageable debt loads and solid interest coverage. Be cautious of high leverage without clear deleveraging plans.
- Use the sentiment extreme as calibration, not a timing signal. The 95th percentile bearish reading tells you the crowd is heavily defensive and many downside scenarios are already priced. It does not tell you when the market will turn, but it warns against anchoring expectations to consensus fear.
- Adjust position sizing for reporting risk. Smaller positions in high-expectations, high-multiple names. Willingness to scale into positive surprises rather than going all-in ahead of results. Cash or low-beta exposures to dampen portfolio-level volatility.
In recent seasons, positive surprises have typically delivered 5-8% moves while negative surprises have triggered 10-15% declines, especially in crowded longs. When the downside on a miss is systematically larger than the upside on a beat, smaller positions in high-risk names are mathematically the correct sizing choice, even for investors with a bullish thesis.
What August 2026 will reveal about the year ahead
This season will not resolve whether the 12% growth forecast is justified. What it will reveal is how the cost and macro pressures are actually landing in corporate results, and whether guidance for FY27 is consistent with or in conflict with current consensus estimates.
The CGT policy uncertainty extends beyond August. Even after results season concludes, the legislative path will continue to influence portfolio allocation decisions and risk premia for the remainder of 2026.
The question for each result is not whether the headline number beats. It is whether the combination of margins, dividends and guidance tells a credible story about the twelve months ahead. August will function as a stress test of the gap between analyst optimism and investor fear. It will not end the uncertainty, but it will narrow the range of plausible outcomes for the second half of the year, making this the most information-rich window of 2026 for Australian equity investors.
This article is for informational purposes only and should not be considered financial advice. Investors should conduct their own research and consult with financial professionals before making investment decisions. Past performance does not guarantee future results. Financial projections are subject to market conditions and various risk factors.
—