
August 2026 is here. Today marks the official start of the ASX reporting season, and across the next four weeks, more than 250 listed companies will open their books on FY26 profits, dividend decisions, and operating conditions. For anyone with skin in the game, it is the month that matters most.
For ASX investors, the weeks ahead will deliver a relentless sequence of earnings releases capable of moving share prices substantially in either direction. Tracking which companies report when, and what the market has already priced in, is the starting point for any considered response to those results. Being caught off guard by a major announcement is a choice, not an inevitability.
This calendar sets out the full week-by-week reporting schedule for August 2026, including broker consensus NPAT, EPS, and DPS figures for more than 78 named ASX companies, alongside a practical explanation of how to interpret each metric. Keep it open as your primary reference point through 31 August.
What makes the August 2026 reporting season matter
August is the primary full-year results window on the ASX. It is when the majority of major listed companies close their books on FY26 and disclose annual earnings for the first time. The numbers that appear over the next four weeks are not incremental updates; they are the definitive read on a full year of profitability, cash generation, and capital allocation.
Earnings releases are, by their nature, scheduled volatility events. Share prices regularly lurch in the hours after a company announces, with intraday swings of 5% or beyond common among mid- and large-cap names. What determines the direction of that move is rarely the absolute size of the profit. It is the gap between the reported figure and what the analyst community had forecast ahead of time. That forecast, known as the broker consensus estimate, is the reference point the market prices off. Getting to grips with the benchmark is just as important as reading the headline figure.
The expectations gap is what separates a share price that surges from one that falls on the same strong profit number; a company printing a record NPAT but missing consensus by even a small margin will frequently trade lower on the day, while a modest profit that beats a low bar can produce a sharp rally.
The season runs from 3 August through 31 August 2026, across five consecutive weekly reporting blocks. Here are the three fundamentals:
- Date range: 3-31 August 2026, five weekly blocks
- Scope: More than 250 ASX-listed companies releasing results; the broker consensus universe covers approximately 78 major named companies
- Data source: Broker consensus estimates sourced from Market Index, compiled as of 31 July 2026
If you hold any of the major companies in this calendar, their result date is effectively a known volatility event. Ignoring it is a choice with consequences.
Investors new to navigating a reporting cycle will find our full explainer on how earnings season works covers the mechanics behind consensus formation, earnings call structure, and the forward guidance signals that consistently move prices more than the headline profit figure.
When big ASX news breaks, our subscribers know first
How to read the consensus estimates in this calendar
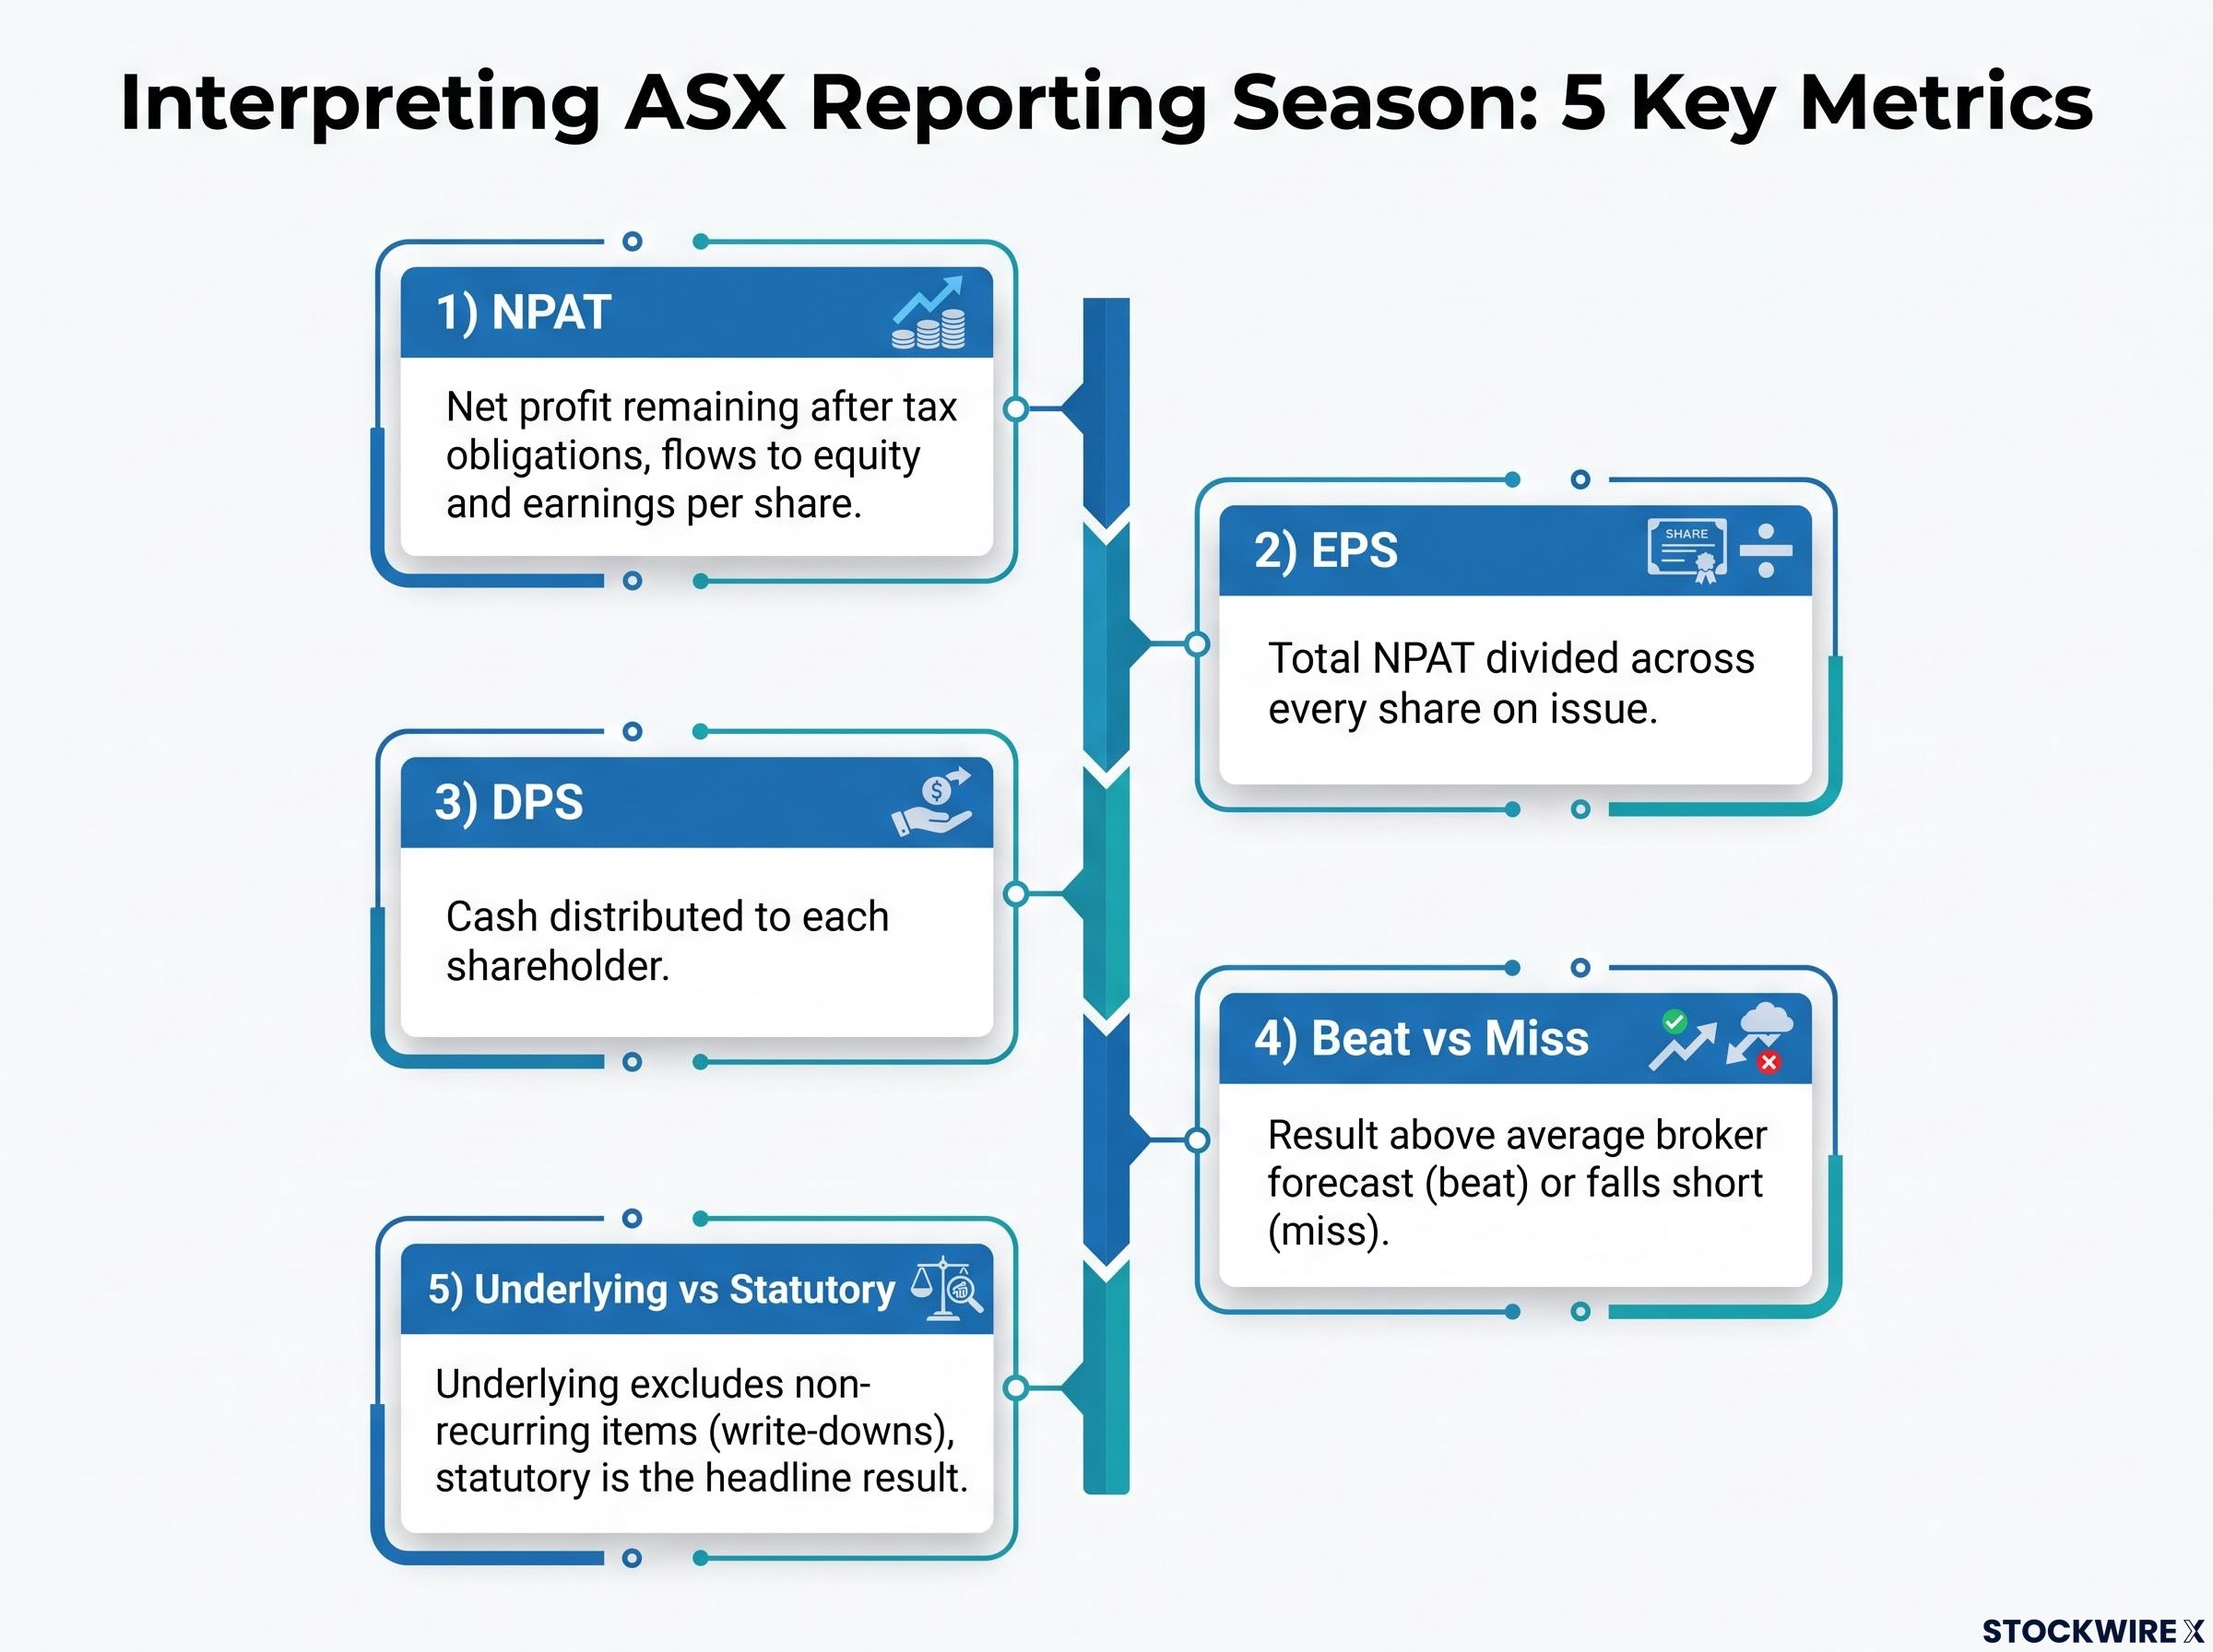
Before you encounter the first table, you need five terms. Each one tells you something specific about a company’s result, and together they form the interpretive framework for the entire season.
- NPAT (Net Profit After Tax): The net profit figure remaining after all tax obligations have been met. It flows directly into the calculation of equity value and earnings per share, and represents the clearest measure of what a business actually took home.
- EPS (Earnings Per Share): The total NPAT divided across every share on issue. It shows how much of that profit is attributable to each share you hold, and sits at the centre of most valuation methods.
- DPS (Dividends Per Share): The cash distributed to each shareholder as a dividend. For investors holding a stock primarily for income, this single figure carries the most direct relevance.
- Beat versus miss: A result is a “beat” when the company reports above the average broker forecast, and a “miss” when it falls short. It is this relative outcome, not the size of the profit in isolation, that typically drives price action on the day results are released.
- Underlying versus statutory earnings: Broker forecasts almost universally work from an “underlying” profit figure, which excludes items management treats as non-recurring, such as asset write-downs or one-time restructuring charges. When a statutory result looks weak against consensus, it may be the one-off items dragging it down rather than genuine operational underperformance. Always confirm which basis you are comparing before drawing conclusions.
For income-focused investors, the DPS figures in this calendar are only part of the picture: franking credits attached to fully franked dividends from companies like CBA and Telstra can lift the effective after-tax yield materially above the headline cash payout, particularly for investors in lower tax brackets or superannuation.
When a company you hold reports, the first question to ask is not “is the profit large?” but “did it come in above or below what analysts were expecting?” That variance, rather than the raw number, is what the market tends to act on.
Note that consensus figures can differ between providers depending on whether the mean or median is used. The estimates in this calendar are one benchmark, not the only one.
What the asterisk and “n/e” notations mean
An asterisk (*) next to a date signals that the reporting date has been estimated by working back from that company’s historical filing pattern, rather than taken from a formal company announcement. These dates can shift with little warning.
The notation “n/e” in the tables indicates that no broker consensus figure currently exists for that stock across any of the financial metrics shown. Michael Hill International (MHJ) in Week 5 is the clearest example. When no consensus exists, there is no external benchmark against which to judge whether a result has beaten or missed expectations.
All reporting dates in this calendar should be checked against ASX company announcements before you act on them.
The season opener: eleven companies across five sectors
Week 1 opens today with 11 companies spanning financials, property, media, energy, and healthcare. This is not the headline week. The heavy-cap names arrive later. But it sets the season’s early tone, and the first results to land will start to signal whether the broader season will trend toward beats or misses.
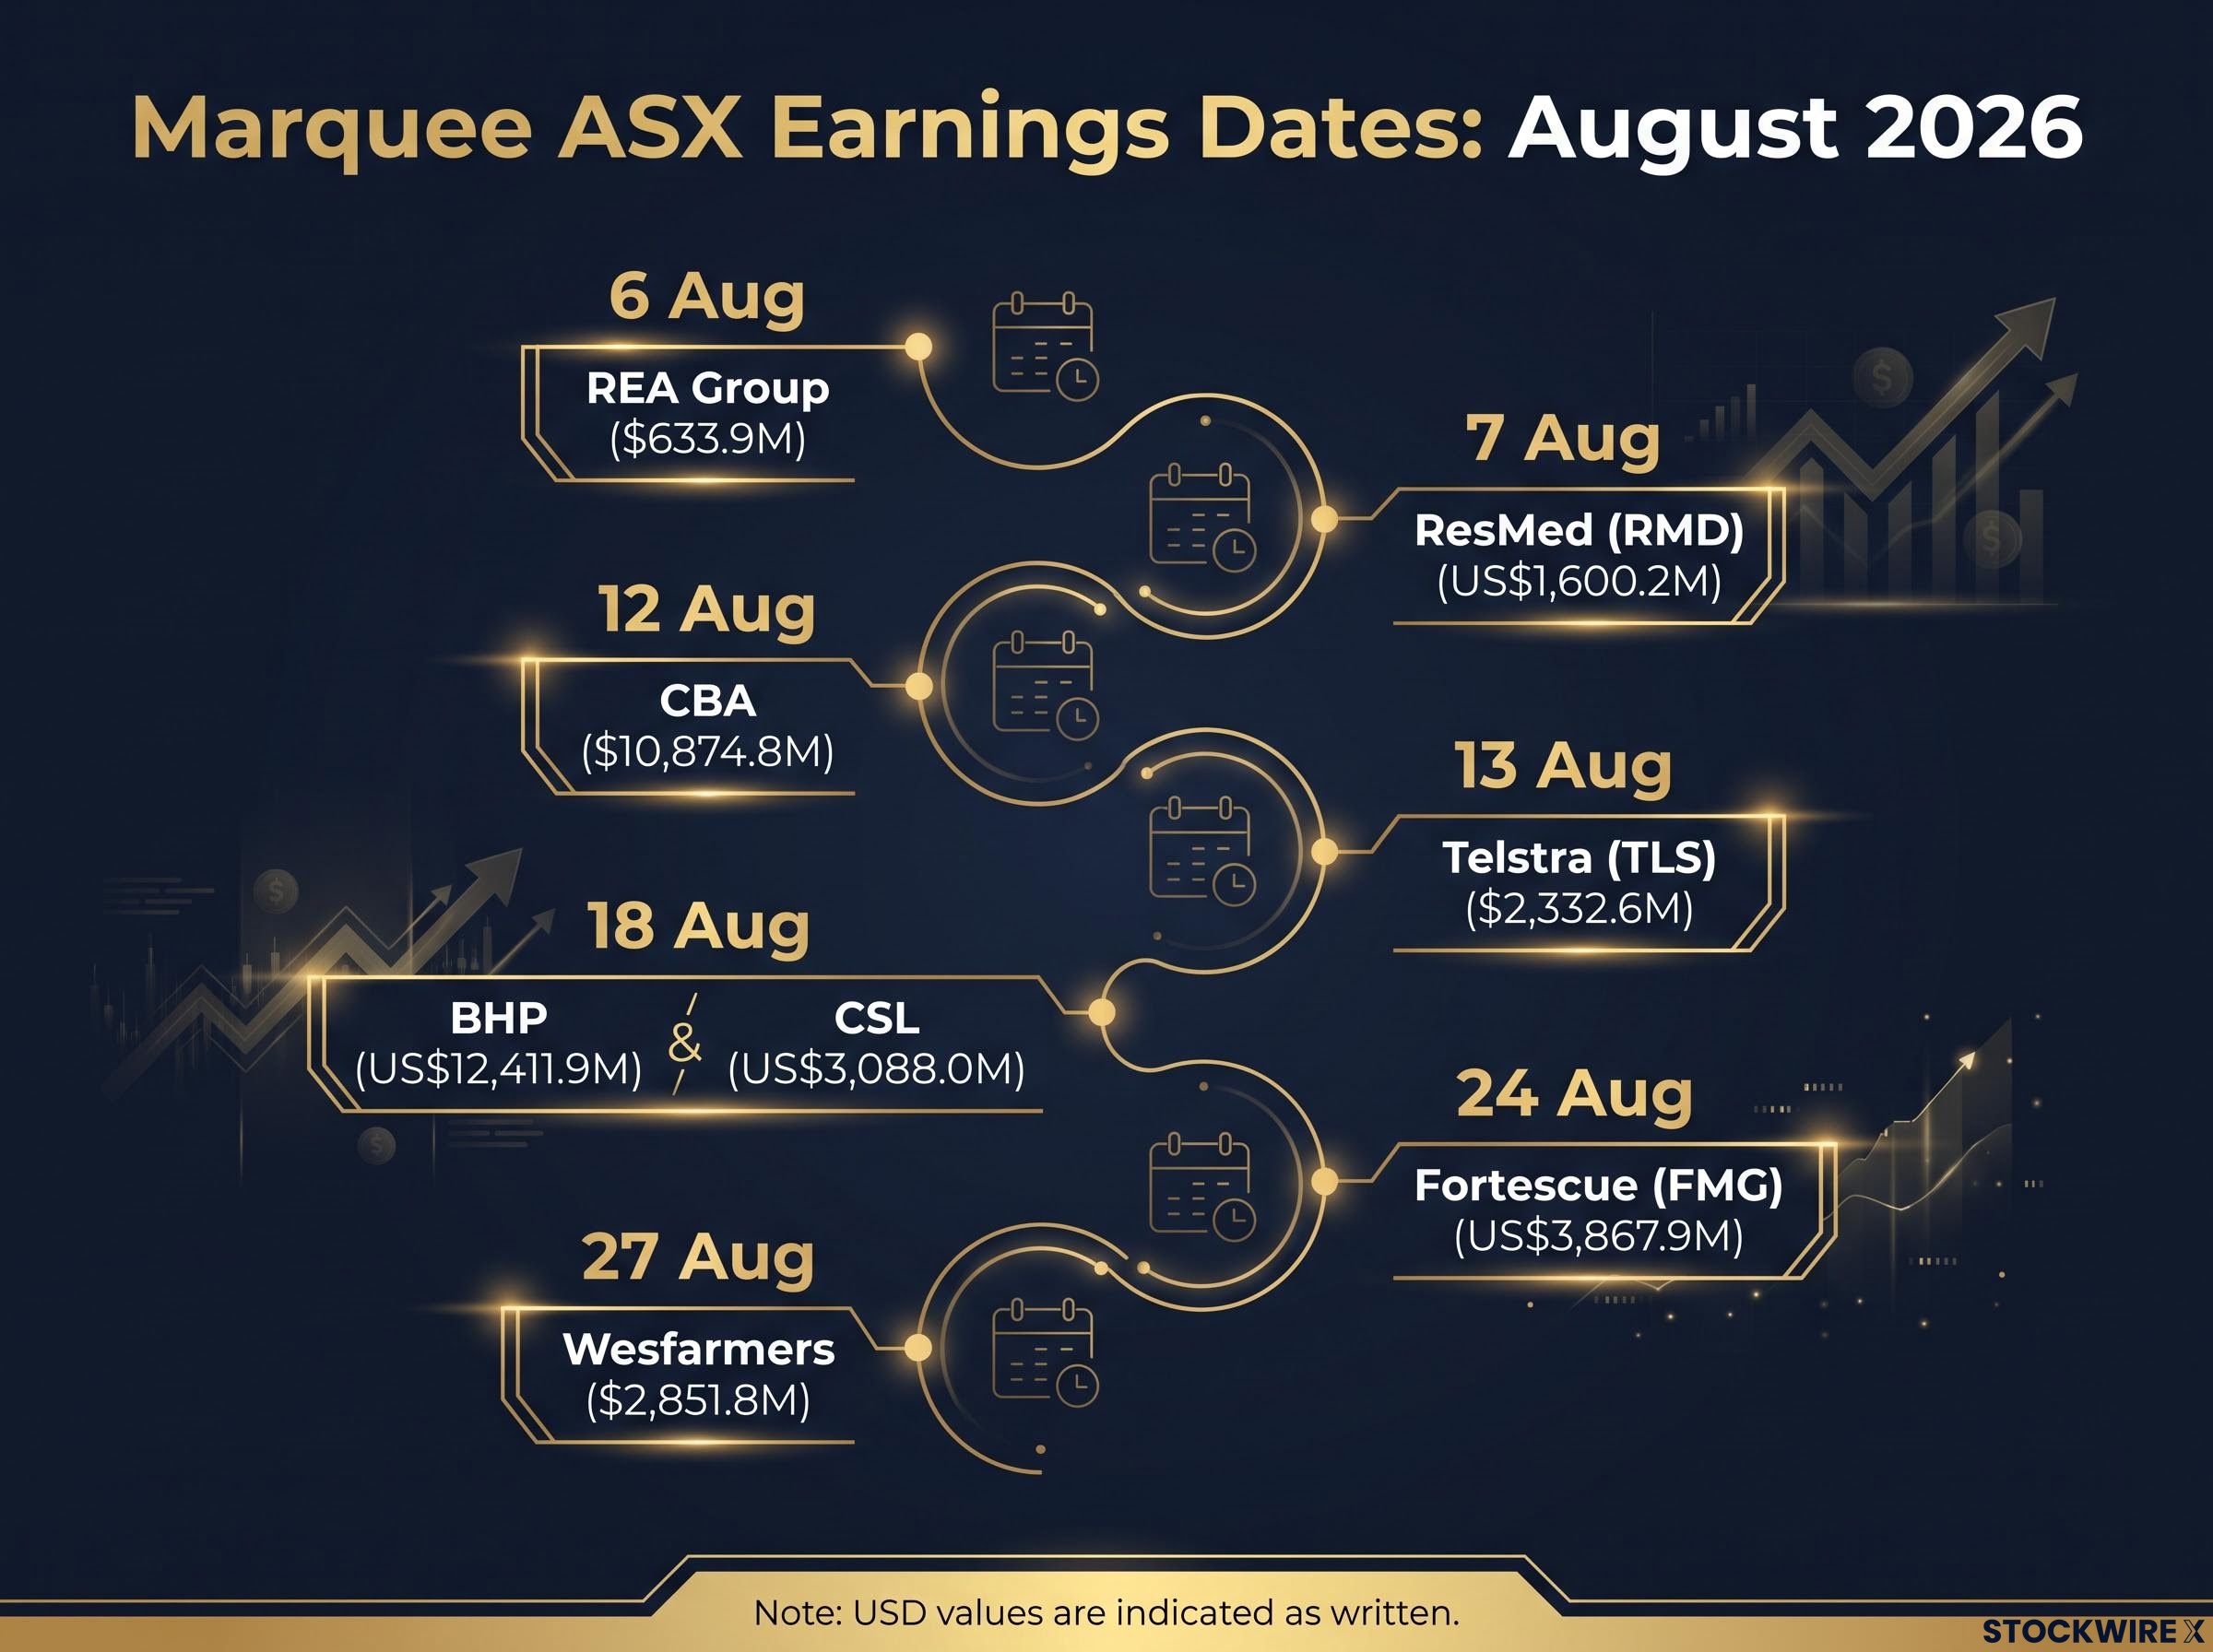
REA Group stands out as the highest-profile name, with a consensus NPAT of $633.9M, 480.3c EPS, and 279.9c DPS. ResMed (RMD) carries the largest profit figure of the week at US$1,600.2M consensus NPAT, reflecting its global scale and USD reporting currency. At the other end, Avita Medical (AVH) is expected to report a loss of US$19.4M at the NPAT level.
Several Week 1 companies report in USD, a reminder that some ASX-listed names derive the bulk of their revenue from international operations.
| Company | Date | Currency | Period | Consensus NPAT | EPS (cents) | DPS (cents) |
|---|---|---|---|---|---|---|
| CCP | 4 Aug 2026 | AUD | FY26 | $103.7M | 152.3 | 75.8 |
| COF | 4 Aug 2026 | AUD | FY26 | $66.8M | 11.2 | 10.1 |
| PNI | 4 Aug 2026 | AUD | FY26 | $152.8M | 67.5 | 60.8 |
| LNW | 5 Aug 2026 | USD | H1 FY26 | US$219.6M | 277.5 | 0.0 |
| BPT | 6 Aug 2026 | AUD | FY26 | $330.8M | 14.6 | 2.8 |
| NWS | 6 Aug 2026 | USD | FY26 | US$558.5M | 103.6 | 20.0 |
| REA | 6 Aug 2026 | AUD | FY26 | $633.9M | 480.3 | 279.9 |
| AVH | 7 Aug 2026 | USD | H1 FY26 | –US$19.4M | –53.0 | 0.0 |
| CQR | 7 Aug 2026 | AUD | FY26 | $153.8M | 26.5 | 25.6 |
| NCK | 7 Aug 2026 | AUD | FY26 | $74.7M | 87.4 | 71.2 |
| RMD | 7 Aug 2026 | USD | FY26 | US$1,600.2M | 859.4 | 246.6 |
Week 1 is a calibration week. Even if you have no direct exposure to these names, the early beat-or-miss pattern is worth tracking. It sets the market’s expectations for what comes next.
CBA and the big-bank results lead a cross-market week
Week 2 is where the season shifts from scene-setting to market-moving territory. Commonwealth Bank of Australia (CBA) reports its FY26 result on 12 August, and with a consensus NPAT of $10,874.8M, it is the largest single earnings figure in the entire August calendar. The 500.0c DPS consensus alone will draw significant attention from income-focused investors.
CBA‘s result functions as a proxy for the broader Australian economy: its revenue trends, credit quality commentary, and dividend signal will shape sentiment across the entire market for the days that follow.
But Week 2 is not just a banking event. Telstra (TLS) reports on 13 August with a consensus NPAT of $2,332.6M. Origin Energy (ORG) delivers a $1,176.3M consensus figure the same day. Suncorp (SUN) adds an insurance read at $948.1M. Energy (AGL), infrastructure (TCL), and employment (SEK) all report in the same five-day stretch.
The breadth here is the point. 13 companies across banking, energy, insurance, telecommunications, and diversified services report inside a single week. By Friday 14 August, the market will have a materially different picture of Australian corporate health than it had on Monday.
| Company | Date | Currency | Period | Consensus NPAT | EPS (cents) | DPS (cents) |
|---|---|---|---|---|---|---|
| CAR | 10 Aug 2026 | AUD | FY26 | $412.8M | 109.0 | 87.6 |
| SGH | 11 Aug 2026 | AUD | FY26 | $936.9M | 233.1 | 64.5 |
| CBA | 12 Aug 2026 | AUD | FY26 | $10,874.8M | 650.3 | 500.0 |
| AGL | 12 Aug 2026 | AUD | FY26 | $622.0M | 92.4 | 48.0 |
| SUN | 12 Aug 2026 | AUD | FY26 | $948.1M | 87.2 | 70.2 |
| SEK | 12 Aug 2026 | AUD | FY26 | $194.9M | 56.3 | 53.9 |
| GQG | 12 Aug 2026 | USD | FY26 | US$432.6M | 14.7 | 13.4 |
| ASX | 13 Aug 2026 | AUD | FY26 | $521.6M | 273.6 | 205.1 |
| ORG | 13 Aug 2026 | AUD | FY26 | $1,176.3M | 69.1 | 61.3 |
| TCL | 13 Aug 2026 | AUD | FY26 | $1,193.3M | 38.3 | 69.0 |
| TLS | 13 Aug 2026 | AUD | FY26 | $2,332.6M | 20.8 | 21.0 |
| TWE | 13 Aug 2026 | AUD | FY26 | $252.6M | 31.2 | 5.0 |
| BBN | 14 Aug 2026 | AUD | FY26 | $16.2M | 11.8 | 0.0 |
BHP, CSL, and the peak analytical density of the season
Week 3 is where the two sectors that define the ASX’s global identity, resources and healthcare, both deliver their marquee results within the same 24 hours. BHP and CSL report on 18 August, the former with a consensus NPAT of US$12,411.9M and the latter at US$3,088.0M. These are the two largest non-bank companies on the ASX, and their results carry weight well beyond their individual share prices.
JB Hi-Fi opens the week on 17 August with a consumer health read ($489.8M NPAT, 446.9c EPS, 339.2c DPS). Goodman Group (GMG) follows on 20 August with a $2,657.4M consensus NPAT that makes it one of the season’s most significant industrial property results.
BHP’s USD-denominated result will tell you as much about global commodity demand and the iron ore cycle as it does about BHP itself. Watch the production guidance and dividend commentary as the forward signal, not just the headline NPAT.
This week includes 21 companies in total. Several dates carry asterisks as estimates rather than confirmed announcements.
| Company | Date | Currency | Period | Consensus NPAT | EPS (cents) | DPS (cents) |
|---|---|---|---|---|---|---|
| JBH | 17 Aug 2026 | AUD | FY26 | $489.8M | 446.9 | 339.2 |
| LLC (loss expected) | 17 Aug 2026 | AUD | FY26 | –$403.4M | –58.5 | 12.4 |
| BSL | 17 Aug 2026 | AUD | FY26 | $898.1M | 195.6 | 130.0 |
| AZJ | 17 Aug 2026 | AUD | FY26 | $430.1M | 25.4 | 22.7 |
| BHP | 18 Aug 2026 | USD | FY26 | US$12,411.9M | 246.8 | 162.2 |
| CSL | 18 Aug 2026 | USD | FY26 | US$3,088.0M | 639.3 | 298.1 |
| COH | 18 Aug 2026 | AUD | FY26 | $298.3M | 456.3 | 323.6 |
| PME | 18 Aug 2026 | AUD | FY26 | $140.8M | 134.7 | 65.0 |
| AMC | 19 Aug 2026 | USD | FY26 | US$1,851.8M | 400.5 | 260.0 |
| SGP | 19 Aug 2026 | AUD | FY26 | $878.8M | 36.3 | 25.2 |
| STO | 19 Aug 2026 | USD | H1 FY26 | US$487.4M | 14.9 | 11.4 |
| ILU (loss expected) | 19 Aug 2026 | AUD | H1 FY26 | –$64.8M | –14.9 | 3.1 |
| GMG | 20 Aug 2026 | AUD | FY26 | $2,657.4M | 129.2 | 30.0 |
| SHL | 20 Aug 2026 | AUD | FY26 | $596.0M | 121.4 | 112.7 |
| BXB | 20 Aug 2026 | USD | FY26 | US$930.9M | 76.5 | 48.9 |
| DXS | 20 Aug 2026 | AUD | FY26 | $676.3M | 62.5 | 37.0 |
| SUL | 20 Aug 2026 | AUD | FY26 | $197.9M | 90.0 | 55.4 |
| VCX | 20 Aug 2026 | AUD | FY26 | $698.6M | 15.2 | 12.4 |
| CHC | 21 Aug 2026 | AUD | FY26 | $488.7M | 103.2 | 50.8 |
| NWH | 21 Aug 2026 | AUD | FY26 | $170.6M | 37.7 | 19.5 |
| TPG | 21 Aug 2026 | AUD | H1 FY26 | $38.6M | 5.7 | 12.5 |
What to watch in the loss reporters
Lendlease (LLC) is expected to post an NPAT loss of $403.4M for FY26, but the statutory headline is likely to reflect significant write-downs rather than ongoing operational performance. The underlying earnings figure and any forward guidance on asset disposals or capital strategy will carry more weight for analysts tracking the stock.
Iluka Resources (ILU) carries an H1 FY26 consensus loss of $64.8M. The fact that brokers still forecast a DPS of 3.1c per share signals that the balance sheet retains capacity to return cash even through a loss period. The underlying versus statutory distinction is particularly relevant for both names.
Retailers, miners, and 29 companies in the calendar’s busiest stretch
Week 4 is the season’s most densely populated stretch. 29 companies across retail, resources, financials, travel, and healthcare all report inside a single week. The volume alone demands preparation, but three distinct angles give this week its structure.
The consumer sector read: Woolworths, Coles, and Wesfarmers
Coles reports on 25 August (estimated), Woolworths on 26 August (estimated), and Wesfarmers on 27 August (estimated). Three consecutive days of consumer-sector data. Their combined consensus NPAT totals over $5.6 billion, and together they represent the best available barometer of Australian household spending through FY26.
Wesfarmers carries the largest AUD-denominated consensus NPAT of the week at $2,851.8M (251.4c EPS, 210.9c DPS). Woolworths follows at $1,569.7M, and Coles at $1,219.8M. If all three miss, the signal for discretionary retail heading into FY27 is hard to ignore.
Resources, travel, and services
Fortescue (FMG) opens the week on 24 August with a consensus NPAT of US$3,867.9M, the major iron ore read sitting alongside South32 (S32) and Mineral Resources (MIN) for a broad resources picture.
Qantas (QAN) has confirmed 27 August for its FY26 result ($1,417.6M consensus NPAT, 38.9c DPS), marking the carrier’s continued dividend normalisation. Flight Centre (FLT) on 26 August adds a travel services read alongside.
Alliance Aviation Services (AQZ) is the week’s sole expected loss reporter at a consensus NPAT loss of $102.5M.
Most Week 4 dates carry an asterisk, meaning they are estimated rather than confirmed. Verify before acting.
Several Week 4 companies flagged in the pre-season confession season warnings have already reset analyst expectations, meaning the consensus figures in this calendar may already reflect downward revisions rather than the original full-year forecasts brokers held entering FY26.
| Company | Date | Currency | Period | Consensus NPAT | EPS (cents) | DPS (cents) |
|---|---|---|---|---|---|---|
| FMG | 24 Aug 2026 | USD | FY26 | US$3,867.9M | 125.4 | 95.1 |
| BEN | 24 Aug 2026 | AUD | FY26 | $478.8M | 77.5 | 64.0 |
| ALD | 24 Aug 2026 | AUD | H1 FY26 | $601.7M | 251.7 | 151.5 |
| SCG | 24 Aug 2026 | AUD | H1 FY26 | $594.9M | 11.4 | 8.9 |
| REH | 24 Aug 2026 | AUD | FY26 | $286.1M | 45.5 | 16.9 |
| PLS | 24 Aug 2026 | AUD | FY26 | $574.7M | 17.7 | 4.0 |