Most Australian investors know they are supposed to “diversify internationally.” Almost nobody stops to define what that phrase actually buys them.
Here is the trap: you can hold two international ETFs and still own what amounts to a single concentrated bet. Global exposure and genuine diversification are not the same thing, and the gap between them is where portfolios quietly go wrong.
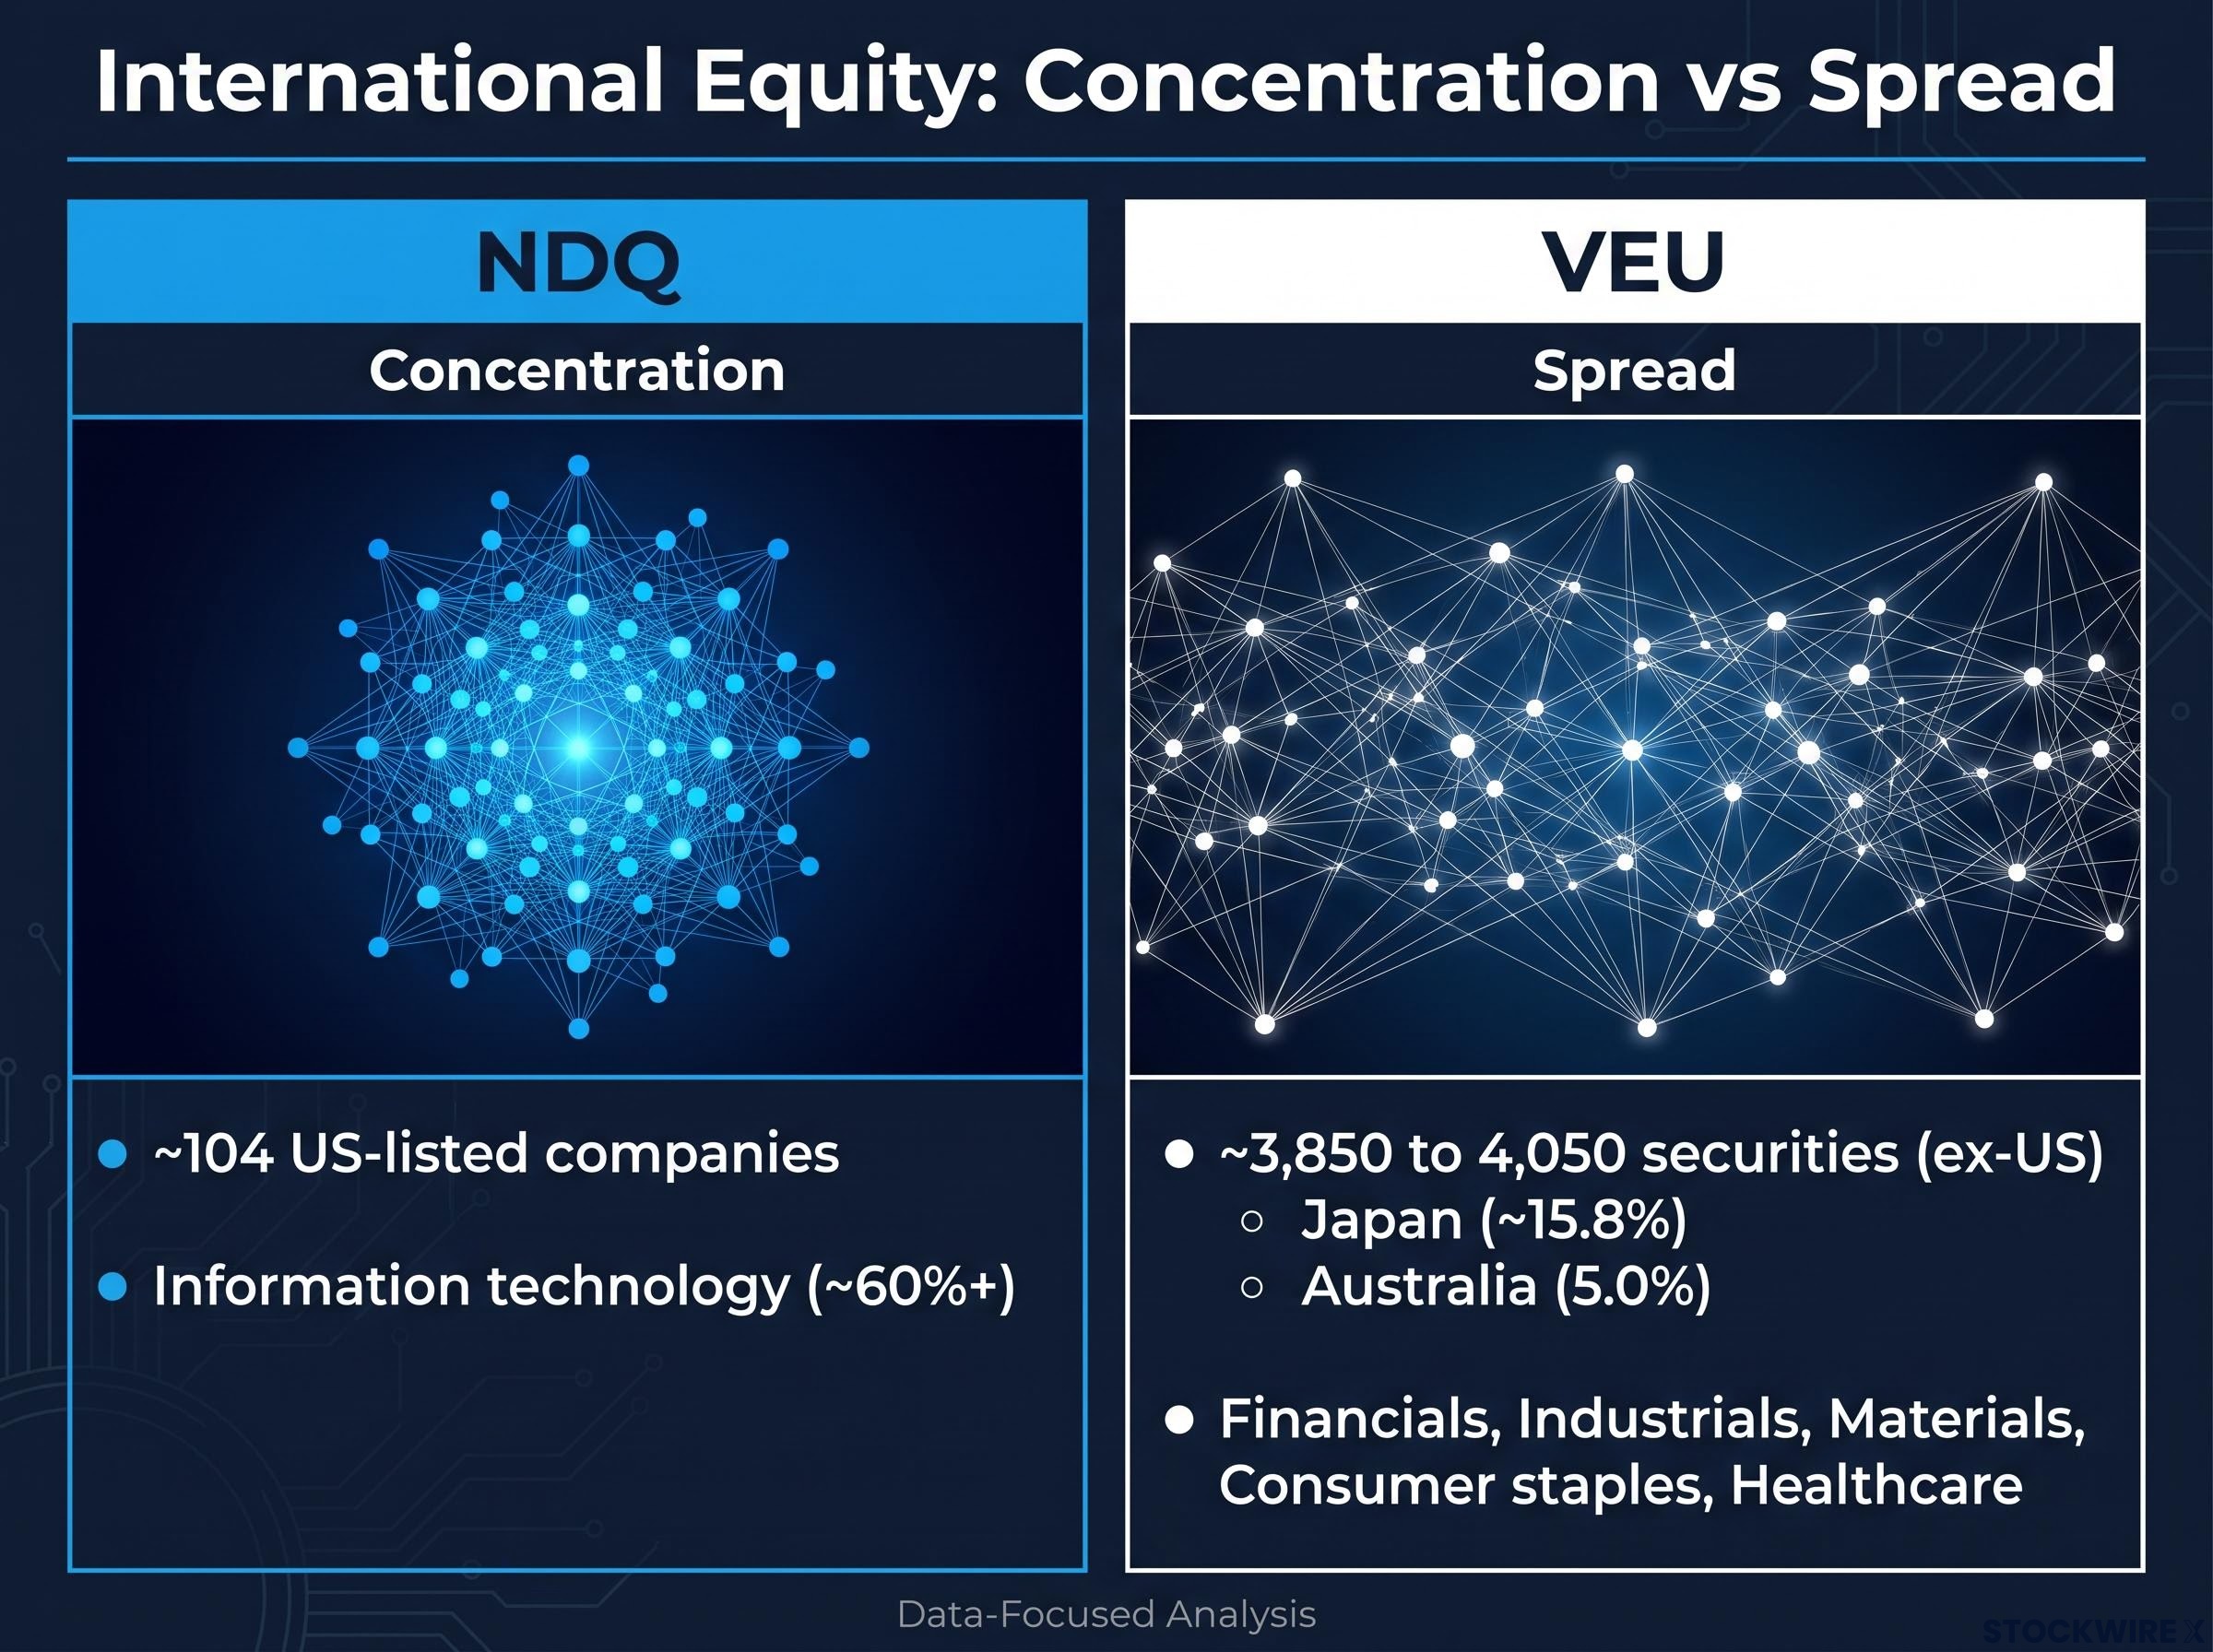
The BetaShares Nasdaq 100 ETF (ASX: NDQ) and the Vanguard All-World ex-US Shares Index ETF (ASX: VEU) sit at opposite ends of the international equity design spectrum. NDQ holds roughly 104 companies, all listed in the US, nearly all in technology and its neighbouring sectors. VEU holds approximately 3,850 to 4,050 securities across Europe, Japan, Asia, and emerging markets, and deliberately excludes the US entirely.
Together, they cover a large share of the world’s listed equity universe. But they do it in structurally opposite ways, and how you combine them determines what your international allocation actually does.
Here is how to think about which role each fund plays, how the trade-off between growth concentration and geographic spread works over a decade, and how to structure your international equity exposure deliberately rather than by default.
Why international exposure is not the same as international diversification
Start with the assumption almost everyone accepts: owning international shares is good. Fair enough. But “international” is doing a lot of hidden work in that sentence, and once you pull it apart, your definition of diversification may be thinner than you think.
There are two separate levers here, and conflating them is the most common structural mistake Australian investors make. Geographic diversification is about which economies you own. Sector diversification is about which industries you own. They are not the same lever, and buying a foreign fund does not automatically pull both.
Moneysmart’s guidance on diversification outlines how spreading capital across asset classes, sectors, and countries reduces the risk that a single poor outcome can significantly damage your overall portfolio, which is precisely the mechanism at work when you pair a concentrated sector fund with a broad geographic spread.
Consider an investor who holds an Australian share fund plus NDQ. On paper, that is meaningful geographic spread: two countries, two markets. In practice, it may be a heavy double-weighting into a narrow band of industries.
That is because NDQ carries roughly 60% or more in information technology, with communication services and consumer discretionary making up the bulk of what remains. VEU’s sector profile leans the other way entirely.
Here is the contrast in plain terms:
NDQ’s sector profile:
- Information technology (approximately 60%+)
- Communication services
- Consumer discretionary
VEU’s sector profile:
- Financials
- Industrials
- Materials
- Consumer staples
- Healthcare
The 104 holdings in NDQ versus 3,850 to 4,050 in VEU makes the concentration difference tangible. One fund is a focused wager on a single industry cluster. The other spreads capital across the defensive and cyclical sectors that dominate the rest of the world’s markets.
If your “international diversification” is mostly NDQ, be honest about what you actually own: a concentrated US technology bet wearing an international wrapper. That is a legitimate position to hold. It is just not the same thing as genuine geographic and sector spread, and treating it as such leaves you exposed to risks you think you have already diversified away.
Sectors respond differently depending on which economy is driving growth
The reason this matters goes beyond labels on a pie chart. European industrials, Japanese manufacturers, and Asian financial companies respond to different interest rate cycles, policy environments, and demographic pressures than US technology platforms do.
When US rates rise and long-duration growth stocks compress, a European industrial or a Japanese exporter is running on a different macro engine entirely. That cycle independence is the actual mechanism through which geographic diversification reduces portfolio-level risk. It is not the act of buying a foreign fund that protects you. It is owning economies that do not all move to the same beat.
The underlying mechanism that makes geographic diversification valuable is the same logic Ray Dalio formalised in his Holy Grail framework: combining uncorrelated return streams reduces portfolio volatility significantly without sacrificing expected returns, provided the streams are genuinely independent rather than superficially different labels on the same economic driver.
When big ASX news breaks, our subscribers know first
What NDQ actually gives you, and what it does not
The case for NDQ is genuinely strong, and it deserves to be stated properly before the caveats arrive. Artificial intelligence, cloud computing, semiconductors, and digital platforms are structurally rewiring how business gets done and how people live. NDQ gives you broad exposure to that shift through roughly 104 of the largest non-financial companies on the Nasdaq.
The track record reflects it. Over the past decade, NDQ has delivered around 20.84% per annum in AUD after fees.
The 10-year return that frames the debate NDQ returned approximately 20.84% per annum in AUD over 10 years. That figure is real, but the measurement period matters enormously. It was generated during one of the most favourable stretches for US tech on record, and the next decade is not obliged to repeat those conditions.
Shorter windows sit lower. The 5-year return is around 14.21% to 14.22% per annum in AUD, and the 1-year return to late August 2026 was approximately 14.97%. Here are the fund’s core statistics in one place:
| Metric | NDQ |
|---|---|
| FUM | ~$8.9B (Sep 2026) |
| MER | 0.38% p.a. (current) |
| Holdings | ~104 |
| 1-year return (AUD) | ~14.97% (to Aug 2026) |
| 3-year return p.a. (AUD) | ~19.92% |
| 5-year return p.a. (AUD) | ~14.21% |
| 10-year return p.a. (AUD) | ~20.84% |
Worth noting on cost: NDQ’s management expense ratio (the annual fee charged as a percentage of your investment) is now 0.38% per annum, reduced from a prior 0.48% per annum.
Now the frame shifts. That decade of returns came with three structural vulnerabilities baked in, and understanding them is what separates a deliberate NDQ position from a performance-chasing one.
- Concentration. With only ~104 holdings, NDQ carries double-digit exposure to a handful of mega-caps such as Nvidia, Apple, and Microsoft. If one of them stumbles on regulation, competition, or execution, you feel it directly.
Mega-cap concentration inside US index funds reached historic extremes by mid-2026, with five stocks controlling approximately 23% of the broad market and driving over 70% of the index’s Q1 2026 decline, a dynamic that amplifies the same risks already present in NDQ’s 104-holding structure.
- Valuation and duration risk. US growth stocks have traded at premium multiples for years. Those valuations embed optimistic assumptions, which makes NDQ acutely sensitive to interest rate changes. Higher-for-longer rates compress exactly this kind of long-duration business.
- Currency. NDQ is unhedged into AUD, so you carry full US dollar exposure. If the Australian dollar strengthens against the greenback, your local-currency returns erode even when the underlying US stocks perform well.
None of this is a reason to avoid NDQ. It is a reason to size it deliberately. You need a clear picture of both the growth thesis and these structural limits before deciding what weight it should carry against the rest of your equity allocation.
What VEU adds to the picture, and why the fee difference matters
If NDQ is the concentrated growth engine, VEU is the structural counterweight most investors do not realise they are missing. Its job is to own the rest of the world.
That breadth buys you something specific: exposure to Asian consumer growth, European industrial and healthcare companies, Japanese equities, and emerging market financials, all through a single fund holding roughly 3,850 to 4,050 securities. The geographic split leans on Japan at approximately 15.8%, with a small 5.0% Australia weight and the remainder spread across developed and emerging markets.
The holdings tell the story of how different this is from a US tech basket:
- Taiwan Semiconductor Manufacturing
- Novo Nordisk
- Tencent
- ASML
- Nestlé
- Samsung Electronics
- SAP
- Novartis
- Roche
- AstraZeneca
These names illustrate the non-US, non-tech character of the fund. Semiconductors, pharmaceuticals, consumer staples, and enterprise software, listed across Taiwan, Denmark, China, the Netherlands, and Switzerland.
The diversification thesis is not theoretical. From 2000 to 2010, US large-cap growth lagged badly while non-US and emerging markets outperformed significantly. Investors with VEU-style exposure captured returns that US-only portfolios simply missed for a full decade.
Returns here are more modest over the long run. VEU’s 10-year return in AUD sits at approximately 9.61% per annum, according to ETFinfo.com.au to 21 January 2026. Over shorter windows it has been competitive, with a 1-year return of approximately 21.54% and a 3-year return of approximately 17.81% per annum to Q2 2026.
Here is how the two funds line up side by side:
| Characteristic | NDQ | VEU |
|---|---|---|
| Issuer | BetaShares | Vanguard Australia |
| Index tracked | Nasdaq-100 | FTSE All-World ex-US |
| Holdings | ~104 | ~3,850-4,050 |
| FUM | ~$8.9B | ~$6.14B |
| MER | 0.38% p.a. | 0.04% p.a. |
Geographic focus and sector tilt round out the contrast: NDQ is US-only and IT-heavy; VEU is global ex-US and tilted toward financials, industrials, materials, healthcare, and staples. On the 10-year figure, NDQ’s ~20.84% p.a. towers over VEU’s ~9.61% p.a., but that raw comparison hides something important about cost.
The fee gap compounds silently over a decade
VEU charges a management expense ratio of just 0.04% per annum against NDQ’s 0.38% per annum. That 0.34 percentage point gap looks trivial. Over ten years, it is not.
Take a $50,000 investment growing at a steady assumed 8% per annum for illustration. The lower fee means almost the entire return compounds for you rather than being skimmed by the fund manager each year. Over a decade, that structural cost advantage accumulates into a meaningful sum that a simple return comparison between the two funds never shows you.
This is not an argument to pick VEU over NDQ on fees alone. It is a prompt to be conscious of the concentration premium you are paying when you weight heavily toward NDQ. VEU’s real role is not to beat NDQ year by year. It is to keep engines running elsewhere in your portfolio if US tech goes through a multi-year flat or negative stretch.
How to think about the split, and where the real debate sits
There is a genuine intellectual argument underneath this decision, and pretending it has a clean answer would do you a disservice. Two camps disagree about whether broad ex-US diversification actually earns its place over a decade-plus horizon.
The pro-diversification camp points to 2000 to 2010, when US equities lagged and ex-US markets led, and to research showing that ex-US correlations below 1 reduce portfolio volatility and tail risk. The insurance, they argue, pays off in the regimes nobody predicts.
The skeptical camp points to 2010 to 2025, when US tech outpaced almost everything else, and argues that large ex-US allocations mainly diluted returns by underweighting the world’s most profitable businesses. They add a sharp caveat about crisis behaviour.
The correlation problem you should understand before treating diversification as crisis protection During severe global sell-offs, the 2008 financial crisis and the 2020 COVID shock among them, correlations between US and ex-US markets spiked toward 1. Everything fell together. Geographic diversification does not reliably protect you in a deep bear market; its value shows up across full cycles, not in the crash itself.
The recent numbers show how fluid the gap is. NDQ’s 1-year return to late August 2026 was around 14.97%, while VEU landed in a 15% to 21% range depending on the source and date. The lead changes hands with market conditions.
So the honest framing is this: the split between NDQ and VEU is not a performance optimisation problem with a correct solution. It is a question about which risk you are more willing to carry, US concentration risk or the opportunity-cost risk of underweighting the most innovative companies on earth.
The core-satellite framework makes that trade-off navigable rather than paralysing:
The core-satellite framework has a precise structural logic that goes beyond the label: the core should represent 70-90% of the portfolio in broadly diversified, low-cost holdings, while each satellite position must answer three questions before it earns a place, covering the thesis it expresses, why the core does not already capture it, and what time horizon the thesis requires.
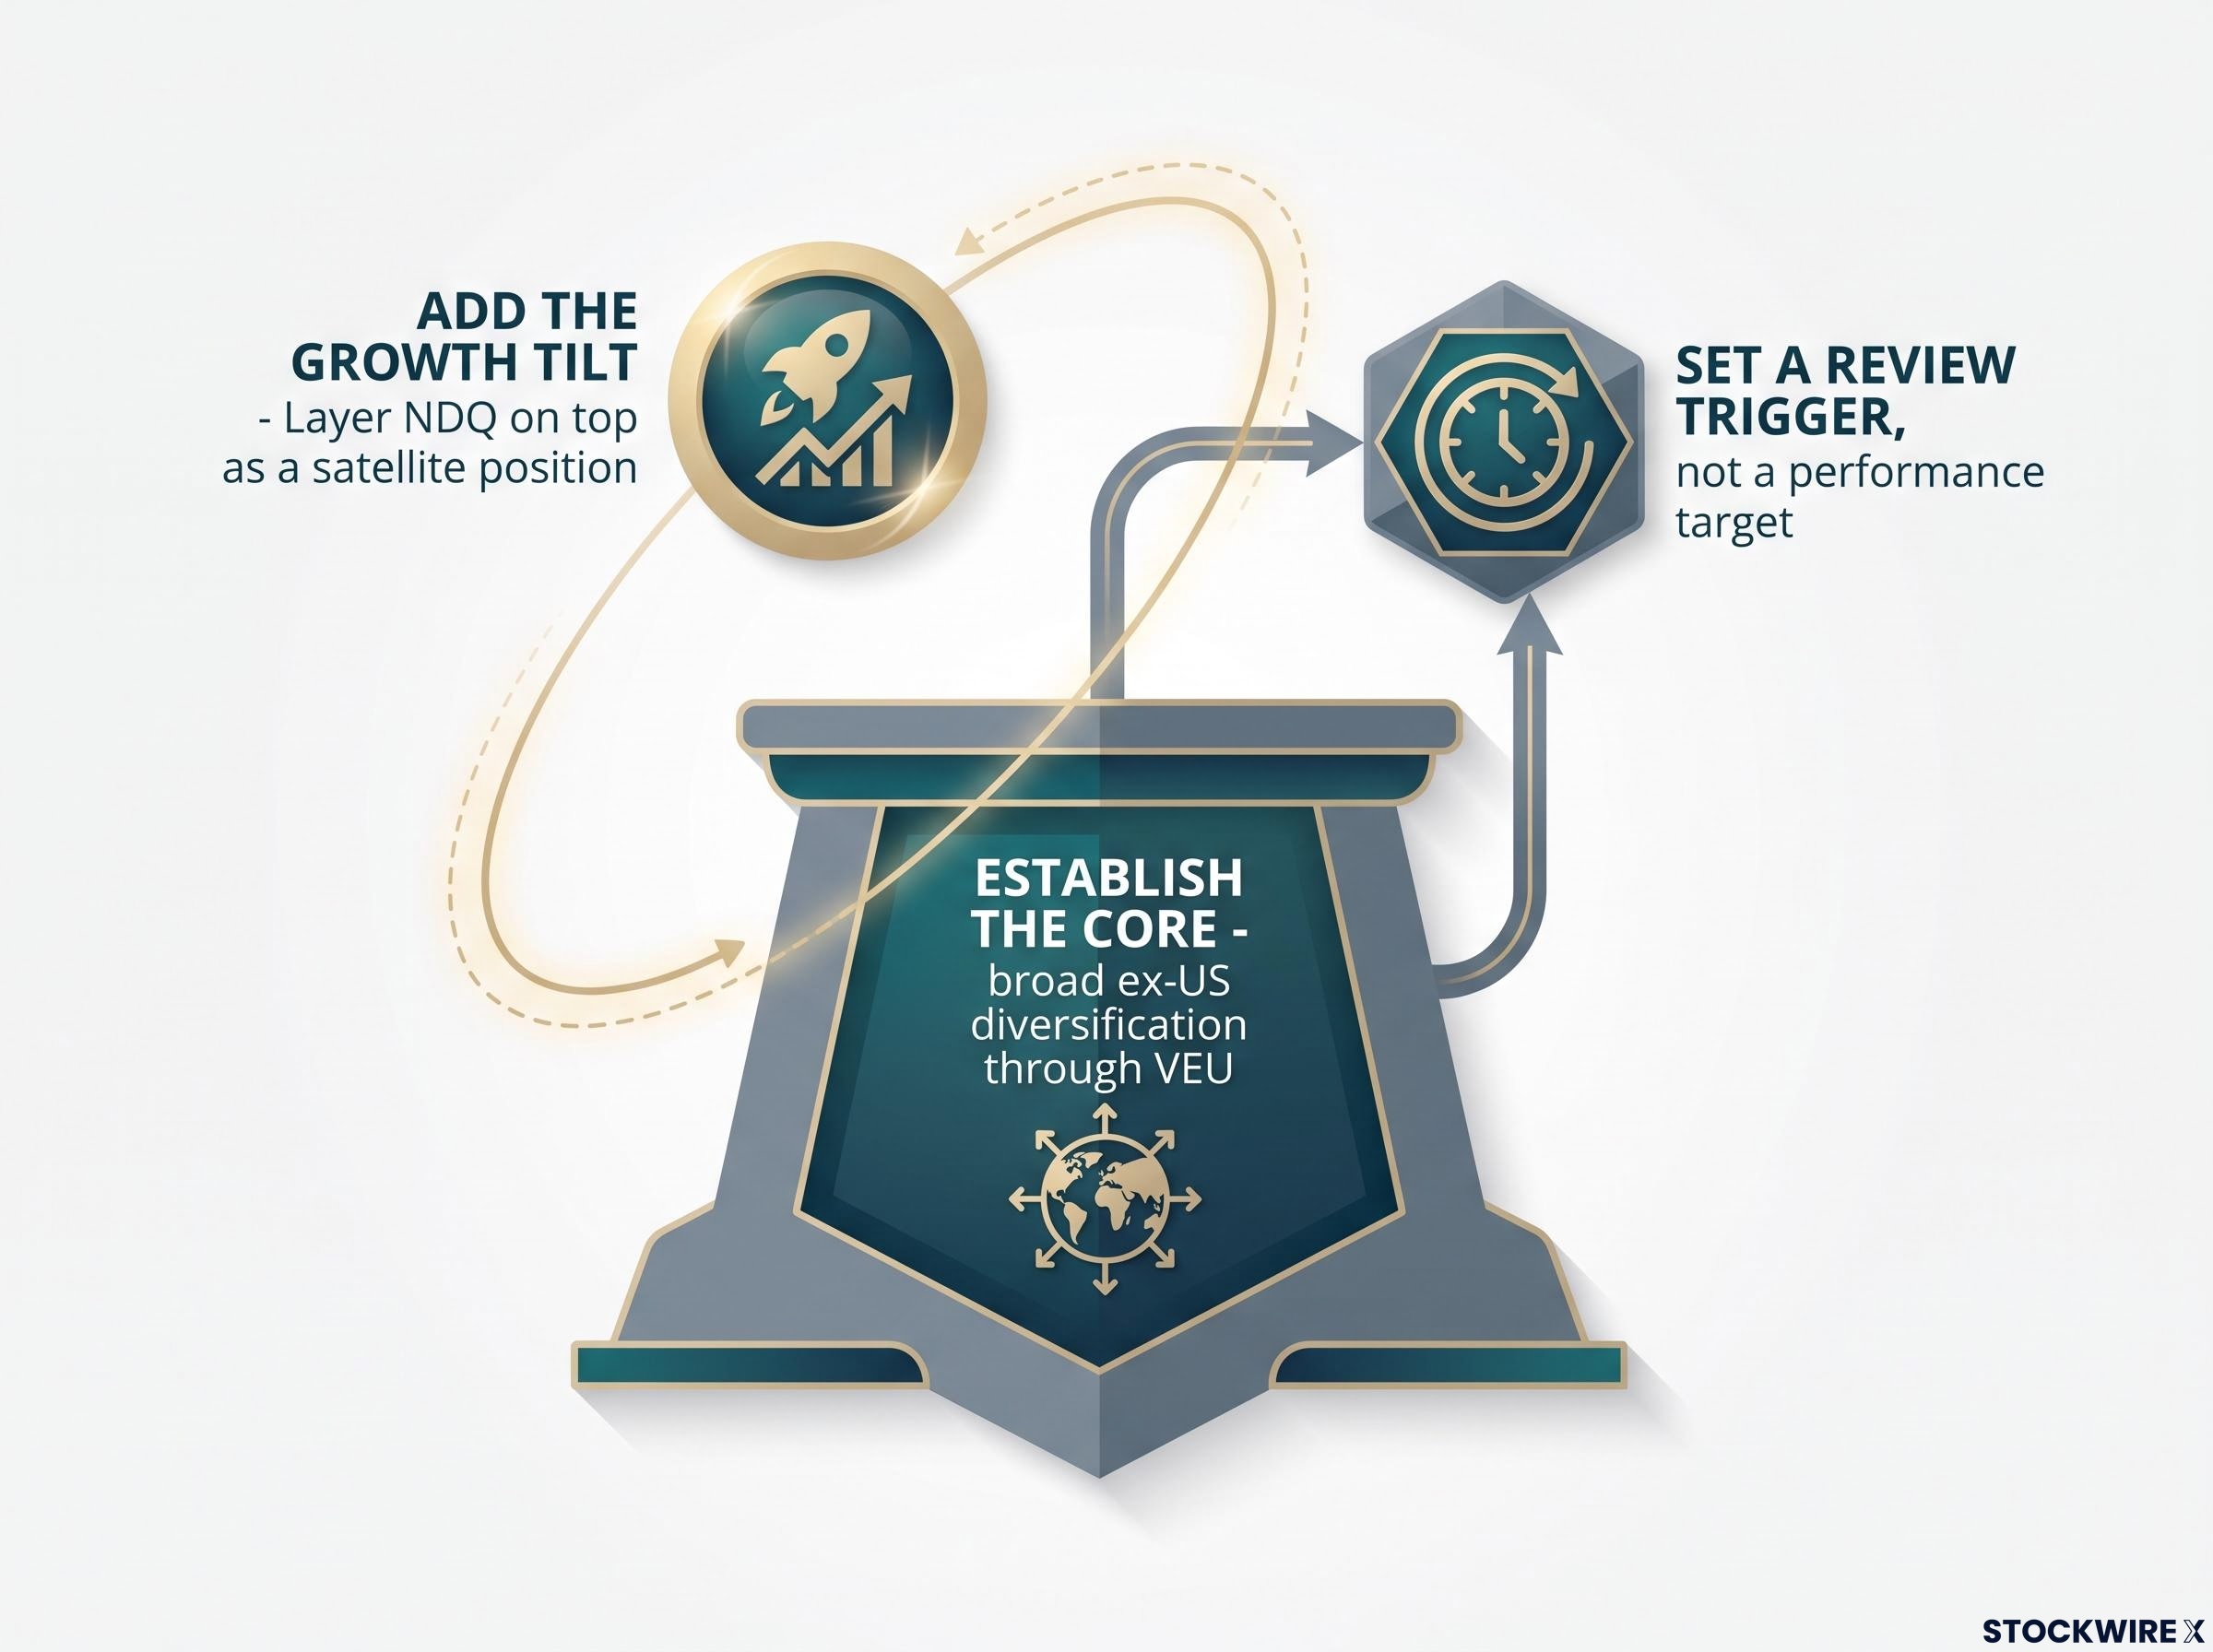
- Establish the core. Anchor your international equity with broad ex-US diversification through VEU or a similar global fund, so the bulk of your risk is spread across regions and sectors.
- Add the growth tilt. Layer NDQ on top as a satellite position, sized to your appetite for US tech concentration, not to whichever fund won last year.
- Set a review trigger, not a performance target. Decide in advance what would make you reassess the split, rather than rebalancing reflexively after two bad years on one side.
Currency threads through all of it. NDQ carries full unhedged USD exposure, while VEU spreads exposure across the euro, yen, sterling, and emerging-market currencies. Neither is hedged into AUD, so the AUD/USD rate materially shapes what NDQ actually returns in your account. Understanding this as a deliberate trade-off, rather than a puzzle to solve, is what lets you hold a position through a full decade of cycles instead of abandoning it after a rough stretch.
Making a deliberate call on your international equity structure
Strip everything back and the decision comes down to a clear lens. NDQ suits you if you want to run a deliberate growth tilt toward US technology and accept the concentration and currency risks that come attached. VEU suits you if you want the portfolio to keep compounding even when US tech is flat or falling.
Here is what the research genuinely cannot tell you: which market will lead over the next specific 10-year window. That is unknowable in advance, which is precisely why position sizing and periodic review matter more than the fund selection itself.
Before you set any ratio, work through a short self-audit:
- What does my superannuation already hold, and how US-weighted is it?
- How much USD exposure am I already carrying across my total portfolio?
- What is my tolerance for a multi-year flat or negative period in one fund?
- Do I actually understand the concentration premium I am paying by weighting toward NDQ?
Two structural details are worth holding in view as you answer. VEU includes roughly 5% Australia weight, so using it as a core international holding carries a small home-market overlap. And the fee contrast, 0.04% against 0.38%, remains a long-term compounding factor when you size the two positions.
Check what your superannuation already owns
This is the step most self-directed investors skip. Many Australians in balanced or growth super options already hold significant international equities, often heavily US-weighted.
If that describes your super, then a self-directed ETF allocation to NDQ is not creating a US tech tilt from scratch. It is compounding one that is already running in the background, which may leave your total portfolio far more NDQ-heavy than the ETF looks in isolation.
That is a prompt for awareness, not a directive to cut NDQ. The right response depends on your whole portfolio, not the fund on its own.
For investors who want a step-by-step framework for setting the actual split between VEU and a US fund, our dedicated guide to building a global portfolio with two ASX ETFs walks through the 60/40 IVV/VEU starting point and how to adjust it based on your existing ASX and superannuation exposure.
This article is for informational purposes only and should not be considered financial advice. Investors should conduct their own research and consult with financial professionals before making investment decisions.
Past performance does not guarantee future results. Financial projections are subject to market conditions and various risk factors. A deliberate structure built on understanding, rather than a performance-chasing allocation, is the version you can actually maintain for the decade required to capture either fund’s long-term compounding potential.