
What the Equity Risk Premium Says About US Stocks Right Now
18 mins ago


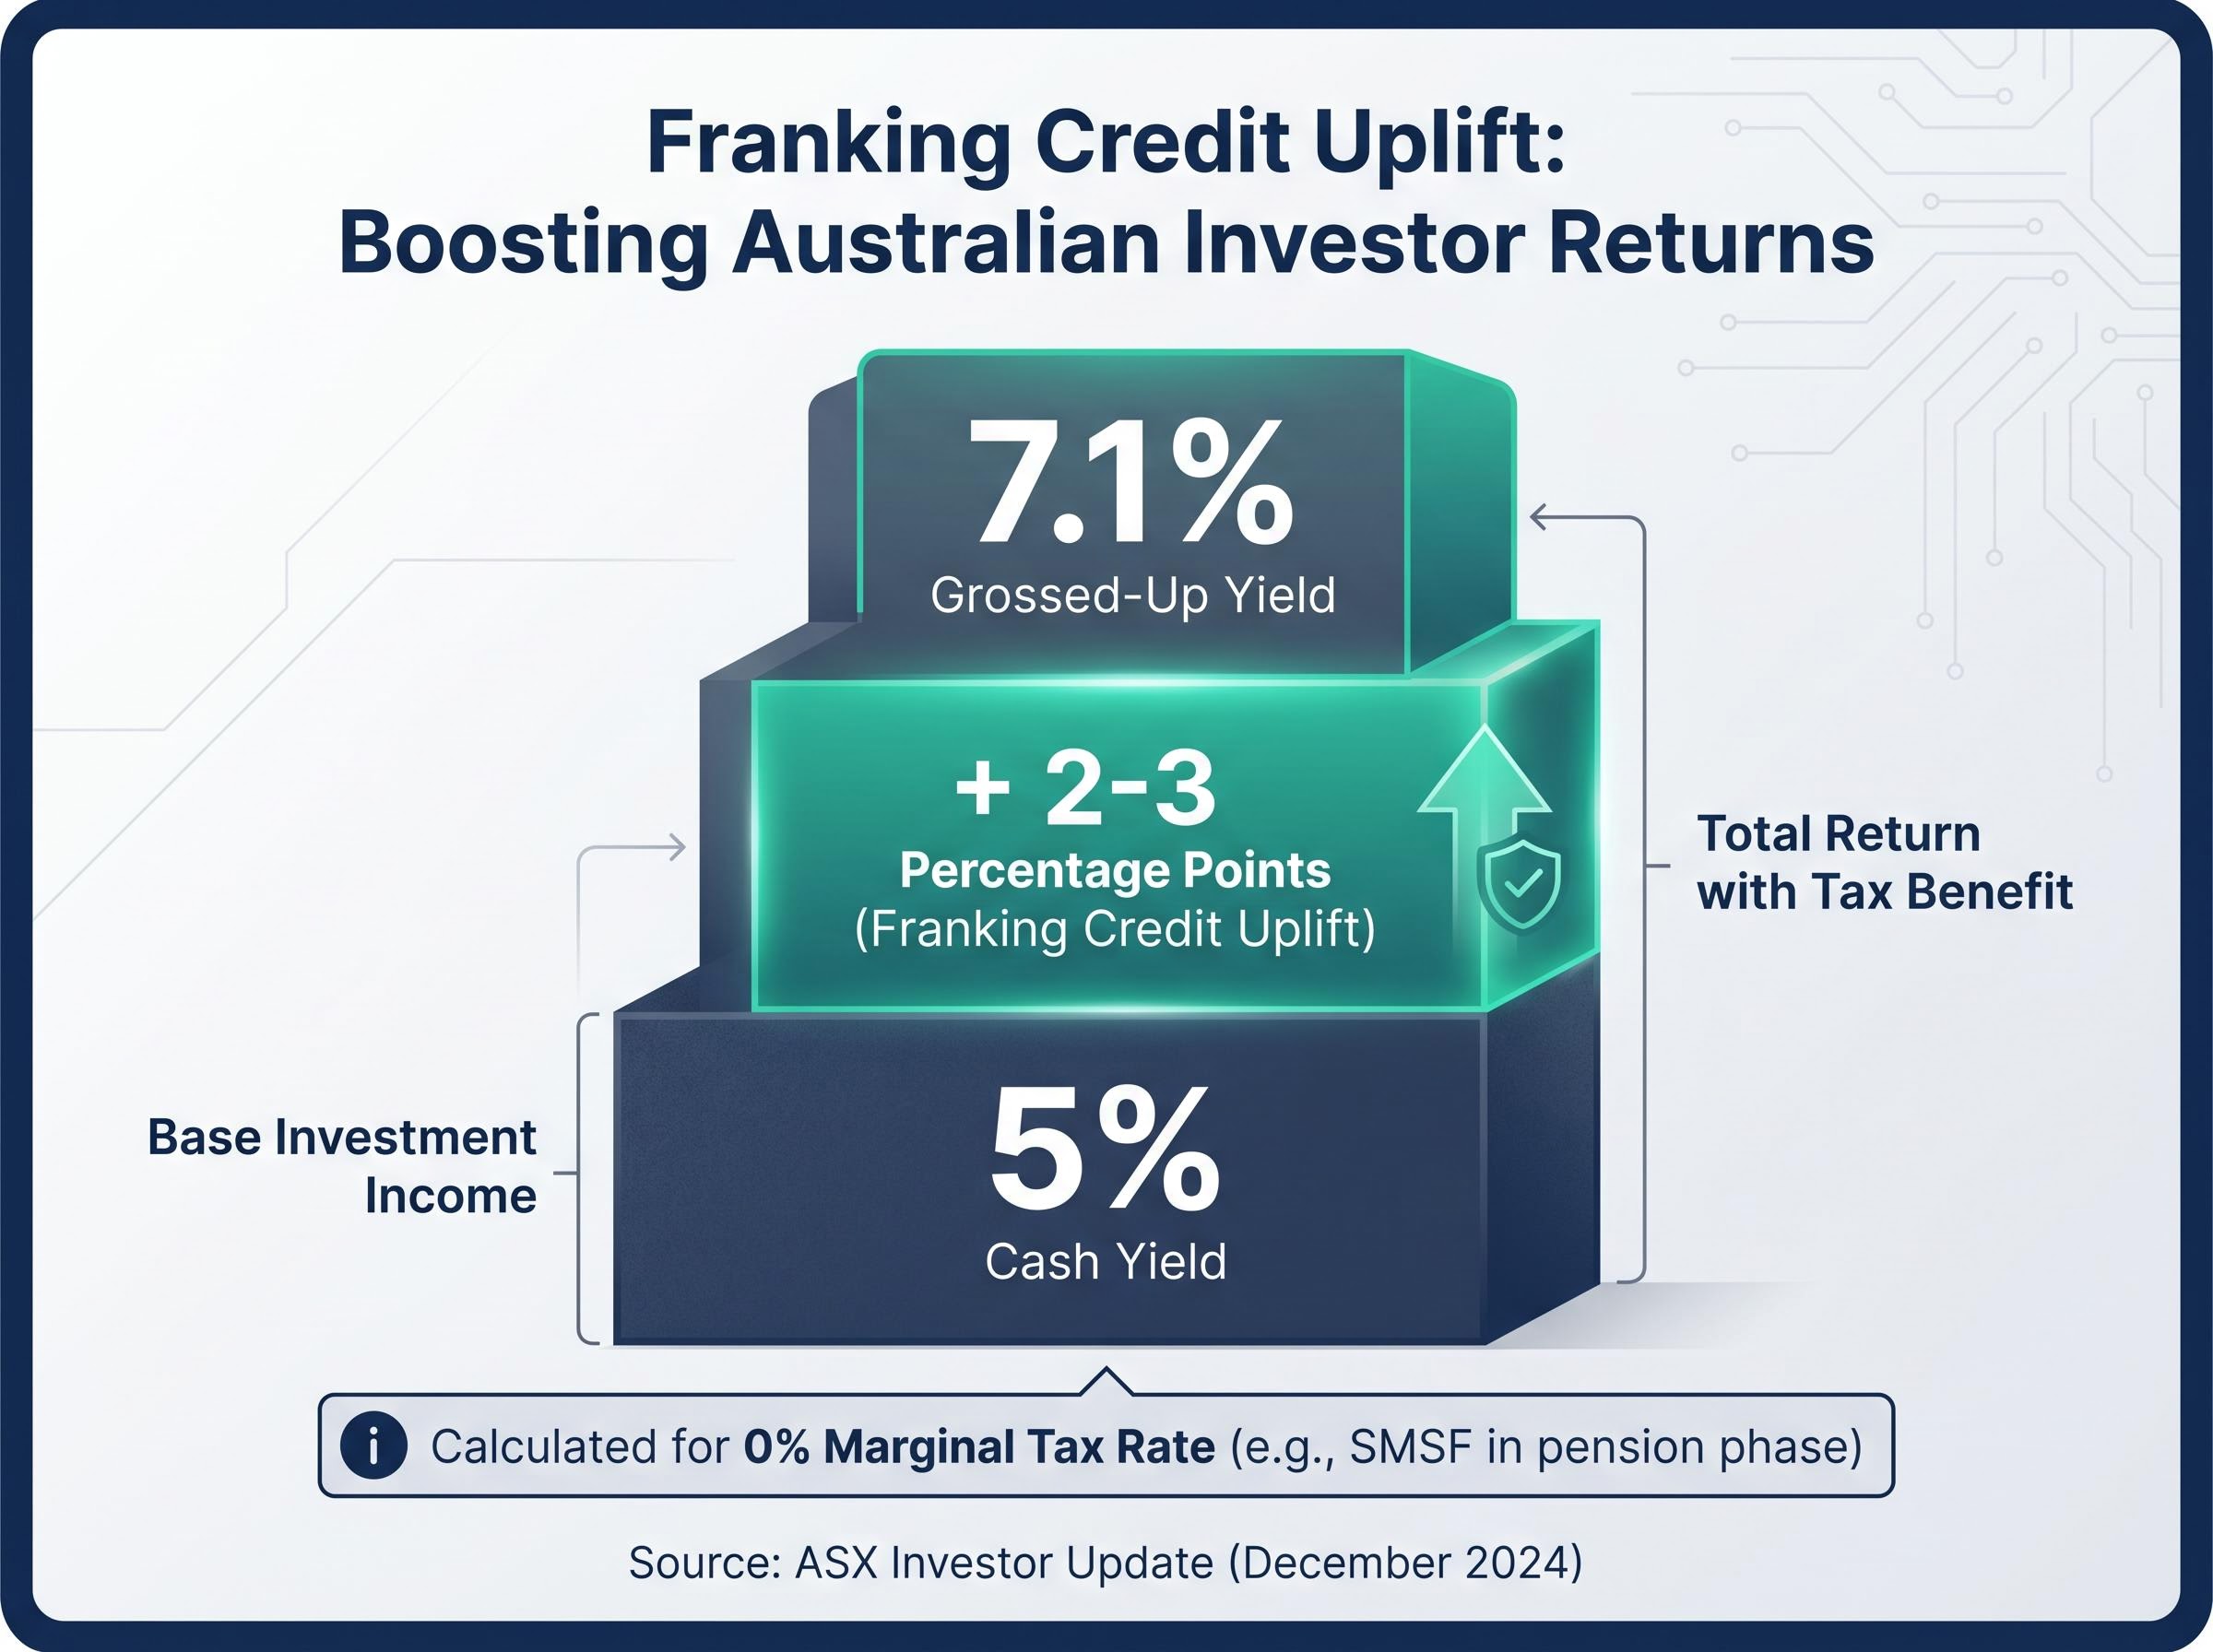
For many Australian income investors, particularly those with self-managed super funds (SMSFs) in pension phase, the big four banks are not simply convenient income sources. They are a structural feature of the portfolio. Fully franked dividends from Commonwealth Bank of Australia, Westpac, NAB, and ANZ deliver grossed-up yields of 7-9% when franking credits are included, a combination of cash income and tax advantage that few other ASX sectors can match. Yet understanding why banks pay reliable dividends is only half the equation. Knowing how to value them, and specifically how to apply the Dividend Discount Model (DDM) as a practical valuation framework, is what separates disciplined investors from yield chasers. This guide explains the structural reasons Australian bank stocks dominate income portfolios, then walks through the DDM step by step so any investor can apply it to any stable, dividend-paying ASX bank.
The income case for Australian bank stocks rests on three structural pillars, each reinforcing the others. Together, they explain why dividends from the majors are not merely attractive but systemically durable.
For SMSF trustees in pension phase who want to work through the grossed-up dividend arithmetic precisely, our dedicated guide to franking credit calculations covers the 30/70 formula with step-by-step worked examples, including the ATO automatic refund process and the 45-day holding rule that governs eligibility.
Graham Hand, writing in Firstlinks (February 2025), noted that for many retirees, “the fully-franked dividends from CBA, Westpac, NAB and ANZ still form the backbone of portfolio income.”
The combination of oligopoly pricing power, franking credit uplift, and long dividend track records means the income appeal of bank stocks is not accidental. It is structurally engineered by market design and tax policy working together.
At its core, the DDM captures a simple idea: a stock is worth the present value of all the dividends it will pay in the future. If an investor buys a bank share primarily for its income stream, the DDM asks a direct question. How much should that income stream cost today?
Livewire Markets (August 2024) framed this as the “yield plus growth” logic. A bank paying a 5% yield with 3% dividend growth should deliver roughly 8% total return per year. The DDM formalises that intuition into a formula that investors can apply consistently.
The Gordon Growth Model, the most widely used form of DDM, expresses the relationship as follows:
Share Price = Annual Dividend / (Required Return Rate minus Dividend Growth Rate)
Three inputs drive the output, and each requires a deliberate judgement call:
ASX Investor Update (September 2024) described the DDM as “most appropriate for established, dividend-paying companies with a history of distributions and moderate, predictable growth.” Morningstar Australia (April 2025) called it “a useful cross-check for mature, high-payout banks.”
Bank stocks suit the DDM precisely because they are mature franchises with high and stable payout ratios, where earnings are returned primarily through dividends rather than reinvestment into high-growth opportunities. The formula is a natural fit for this type of business.
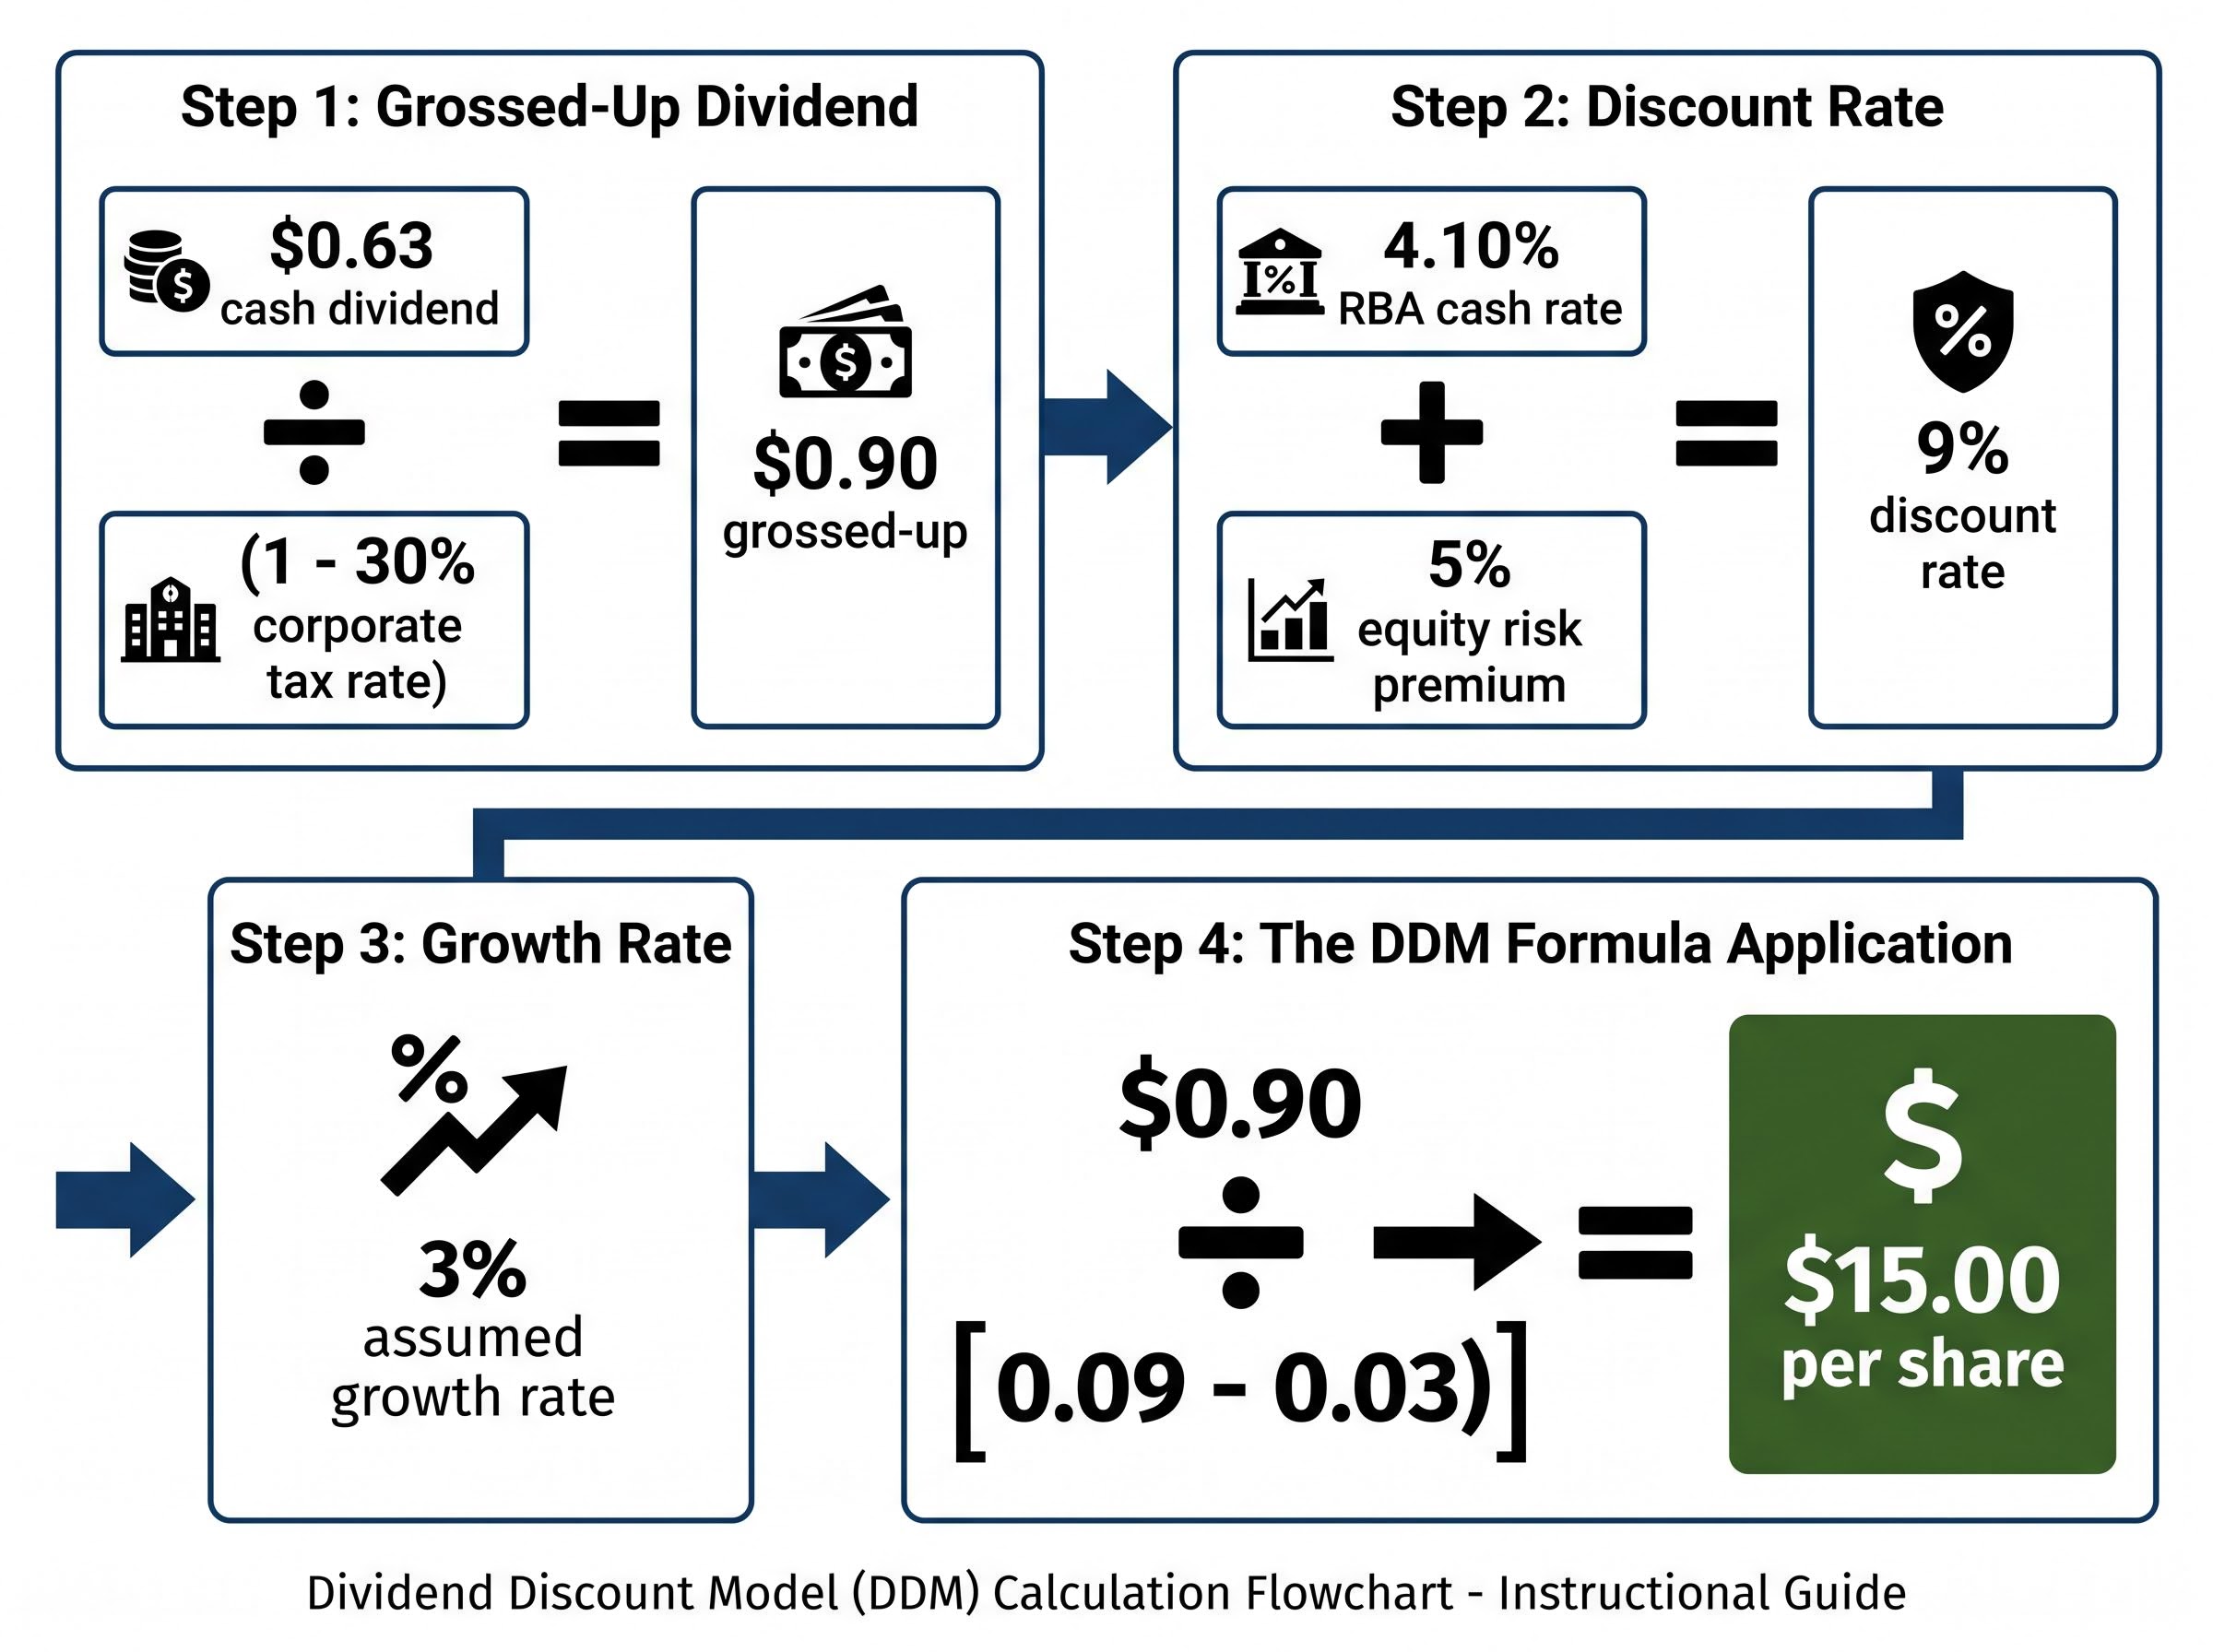
The DDM is not a calculator. It is a sequence of deliberate decisions, and understanding what is being decided at each step matters more than the arithmetic itself.
A single DDM output reflects one combination of assumptions. Change the growth rate by one percentage point and the valuation can shift by 30-50% or more. A sensitivity table maps the range of plausible outcomes across different input combinations, turning one answer into a field of possibilities.
The table below uses the grossed-up dividend of $0.90 and shows illustrative intrinsic values across a matrix of discount rates and dividend growth rates.
| Growth Rate | 6% Discount | 7% Discount | 8% Discount | 9% Discount | 11% Discount |
|---|---|---|---|---|---|
| 2% | $22.50 | $18.00 | $15.00 | $12.86 | $10.00 |
| 3% | $30.00 | $22.50 | $18.00 | $15.00 | $11.25 |
| 4% | $45.00 | $30.00 | $22.50 | $18.00 | $12.86 |
Reading this table, the mid-range assumptions (3% growth, 8-9% discount rate) cluster around $15-$18 per share. At the high-risk, low-growth corner (2% growth, 11% discount), the valuation drops to approximately $10. At the aggressive end (4% growth, 6% discount), it stretches toward $45, a figure most analysts would treat with scepticism for a mature bank.
The spread across the table is the message. DDM produces a range, not a price target.
Firstlinks (December 2024) noted that a two-stage DDM, which uses higher near-term growth transitioning to a lower terminal rate, can refine the output further, though it requires additional assumptions about where the transition occurs.
Choosing a discount rate or growth assumption is not an abstract exercise. Both inputs are anchored in observable economic conditions, and the current Australian environment argues for caution on each.
Morningstar (April 2025) observed that the big four were trading at approximately 13x forward earnings, described as “a slight premium to fair value in a low-growth environment.”
The macro backdrop in 2025-26 supports modest long-run dividend growth assumptions and a discount rate that remains elevated relative to the pre-2022 era. Importing optimistic assumptions from the ultra-low-rate years into the current environment would produce valuations disconnected from the conditions banks actually face.
The DDM’s weaknesses are specific and knowable. Understanding them precisely makes the model more useful, not less.
Dividend cut risk across the big four is not uniform: ANZ and Westpac carry payout ratios sitting above their own stated target ranges at approximately 73% and 76% respectively, while NAB’s grossed-up yield of approximately 6.06% currently leads the sector, creating meaningful variation in risk-adjusted income across what is often treated as a homogenous group.
Tristan Harrison, writing for Motley Fool Australia (May 2024), put it directly: “If you plug in a growth rate that’s too high for a mature bank, you can justify almost any price.”
Two tools fill the gaps DDM leaves:
The consistent recommendation from ASX Investor Update (September 2024), Morningstar (April 2025), and Firstlinks (December 2024) is the same: use DDM as one tool among several, never in isolation.
Investors wanting to move beyond single-metric analysis will find our full explainer on professional bank valuation frameworks, which covers the six-step due diligence process used by fund managers at Morningstar, Martin Currie, and Perpetual, including how to use APRA’s free Pillar 3 disclosures to stress-test capital adequacy and asset quality without relying on reported earnings multiples alone.
The value of DDM for bank investors is not precision. It is discipline. The model forces explicit decisions about growth and discount rates, surfacing assumptions that purely price-based analysis obscures.
A repeatable valuation process for any ASX bank stock follows five steps:
NIM, ROE and CET1 metrics provide the balance sheet and earnings quality layer that DDM and P/E ratios cannot: NAB’s H1 2026 ROE of 15.2% and CET1 ratio of 12.05% illustrate how capital strength and returns on equity interact to either support or constrain the dividend growth assumption that drives DDM outputs.
Recommended starting points for 2025-26: A discount rate of approximately 8-11% (reflecting the RBA cash rate of 4.10% plus an equity risk premium of 4-6 percentage points) and a conservative long-run dividend growth assumption of 2-3% per annum, consistent with a below-trend economic environment and moderating credit growth.
This framework works across all four major banks and smaller ASX-listed banks alike. It is not a one-off calculation tied to a single stock at a single moment but a repeatable analytical habit that improves with use.
Australian bank stocks earn their place in income portfolios through structural advantages that few other ASX sectors replicate. Disciplined valuation, however, prevents investors from overpaying for yield at the wrong point in the cycle.
The DDM is a thinking tool, not an answer machine. The quality of its outputs depends entirely on the quality of the assumptions fed into it, and those assumptions must be anchored in current macro realities. As the RBA continues its easing cycle and credit conditions evolve through 2025-26, investors who revisit their DDM inputs regularly will be better positioned to distinguish genuinely undervalued income from yield traps.
Readers looking to apply this framework to a specific ASX bank stock can explore the companion Bendigo and Adelaide Bank valuation analysis for a worked real-world example.
This article is for informational purposes only and should not be considered financial advice. Investors should conduct their own research and consult with financial professionals before making investment decisions. Past performance does not guarantee future results. Financial projections are subject to market conditions and various risk factors.
The Dividend Discount Model (DDM) values a stock by calculating the present value of all future dividends it is expected to pay. It is particularly well suited to bank stock valuation because major banks are mature franchises with high, stable payout ratios and long dividend histories.
Franking credits allow eligible investors, such as SMSFs in pension phase, to claim back tax already paid by the company on its profits. When applying DDM, using the grossed-up dividend (which adds the franking credit value to the cash payment) produces a valuation that reflects the full income received, lifting effective yields by roughly 2-3 percentage points above the cash yield.
A discount rate of approximately 8-11% is recommended for 2025-26, built from the RBA cash rate of 4.10% plus an equity risk premium of 4-6 percentage points. This range is materially higher than rates used in the ultra-low-rate years of 2020-21 and reflects current economic conditions.
A small change in the assumed dividend growth rate can shift the DDM valuation by 30-50% or more, especially when the growth rate is close to the discount rate. For mature Australian banks in the current environment, a conservative long-run growth assumption of 2-3% per annum is considered appropriate given moderating credit growth and rising unemployment projections.
Investors are advised to cross-check DDM outputs against the sector price-to-earnings ratio (currently around 13x forward earnings), use price-to-book ratios to assess whether returns on equity exceed the cost of equity, and track payout ratios to evaluate dividend sustainability. These tools address the known limitations of DDM, including its sensitivity to assumptions and its inability to capture credit cycle risk.